

Prices
March 9, 2017
Flat, Long, and Semi-Finished Imports through February 2017
Written by Peter Wright
Licensed data for February was reported by the Steel Import Monitoring System of the US Commerce Department on March 7th. An explanation of the methodology that we at SMU use to analyze the trade data is given at the end of this piece. All volumes in this analysis are reported in short tons. Total rolled product licensed imports in the single month of February were 1,990,476 tons with a three month moving average (3MMA) of 2,098,296 tons. We prefer not to dwell on single months results because of the extreme variability that can occur in individual products. In the comments below we use only three month moving averages because this presents a more representative picture.
Figure 1 shows the 3MMA through February licensed tons of semi-finished, flat and long products since January 2004.
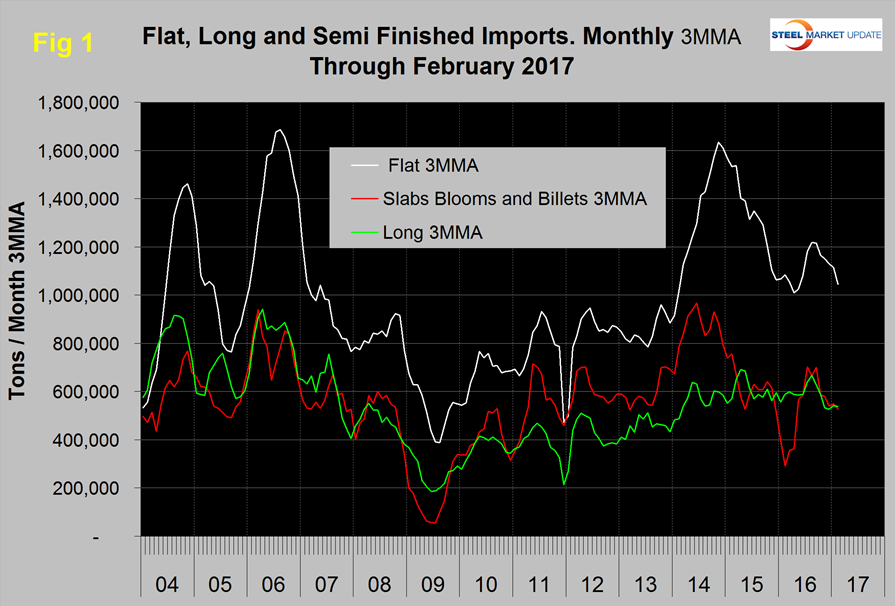
Imports of semi-finished in February were 592,779 tons with a three month moving average of 527,725 tons. “Flat” includes all hot and cold rolled sheet and strip plus all coated sheet products plus both discrete and coiled plate. The 3MMA of flat rolled imports had a recent low of 1,008,708 tons in April last year, rebounded to 1,217,982 in August and has since declined to 1,043,970 in February 2017. Long product imports have been range bound between 519,000 tons and 772,000 tons since March 2014 with no particular trend evident. In February the 3MMA of long product imports was 537,356 tons.
Figure 2 shows the 3MMA trend of sheet and strip products since January 2004.
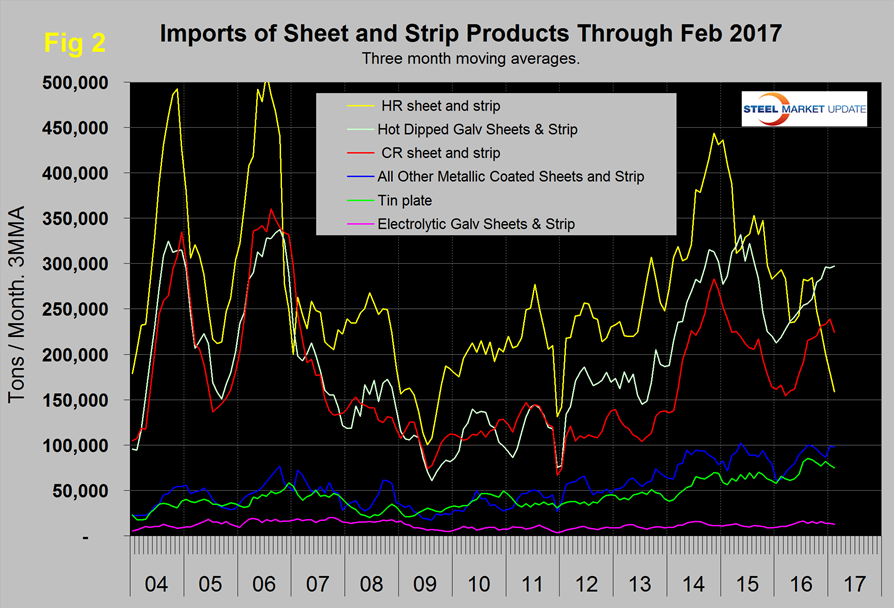
The total of these products was down by 6.1 percent in three months through February compared to three months through November. HRC was down sharply in the last five months and CRC and HDG are now higher than HRC on a 3MMA basis which is very unusual. Other metallic coated, mainly Galvalume and tin plate have been trending up since 2009. Electro-galvanized is up from this time last year but the volumes are small.
Table 1 provides an analysis of major product groups and of sheet products in detail. It compares the average monthly tonnage in the three months through February 2017 with both three months through November (3M/3M) and three months through February 2016 (Y/Y).
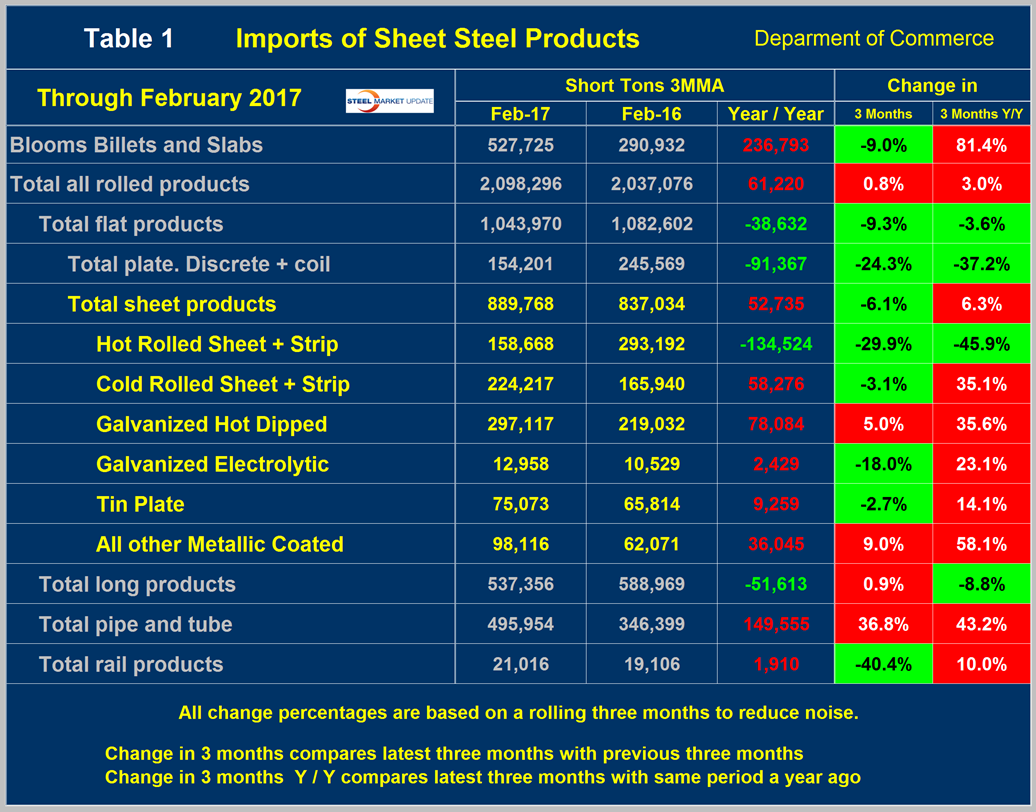
On a Y/Y basis the 3MMA of the total of all rolled products was down by 61,220 tons or 3.0 percent, as total sheet products were down by 6.3 percent. Tubulars were up by 43.2 percent and long products were down by 8.8 percent. Semi-finished slabs, blooms and billets were up by 81.4 percent, a result that was driven by the volume data for February last year which even on a 3MMA basis was exceptionally low.
There were big differences between the individual sheet products compared to last year. HRC was down by 45.9 percent and CRC and HDG were up by 35.1 percent and 35.6 percent, respectively. Other metallic coated (mainly Galvalume) was down by 58.1 percent. Table 2 shows the same analysis for long products.
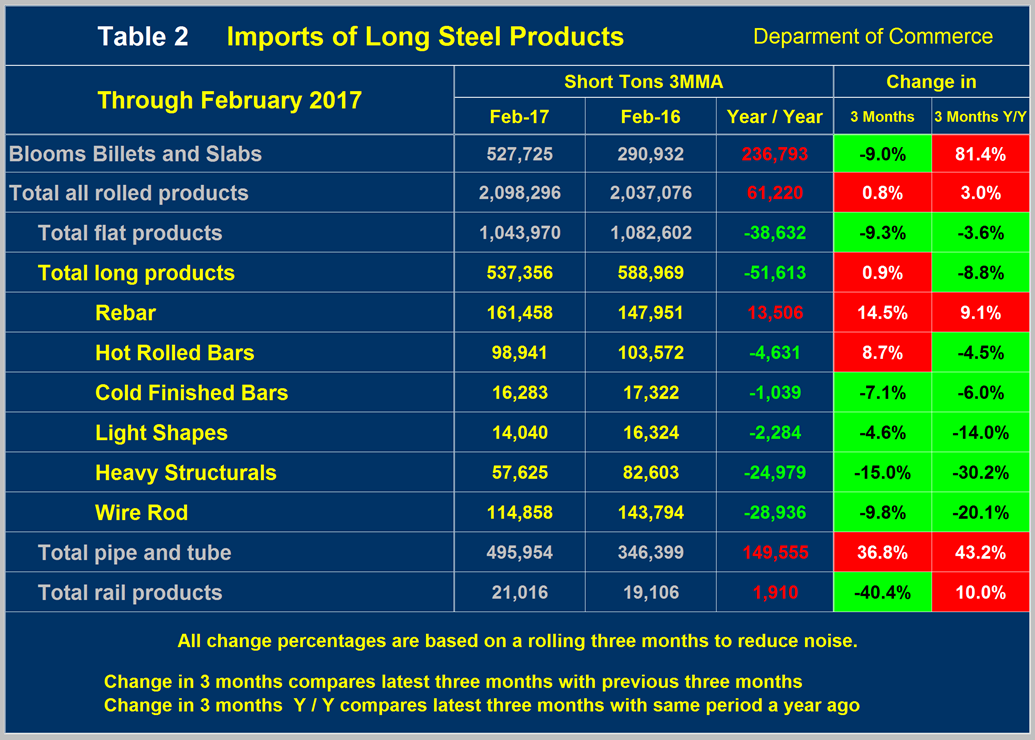
The total tonnage of long products was down by 51,613 tons per month Y/Y. Rebar was the only long product to increase. On a 3M/3M basis the total volume of long products increased by 0.9 percent.
Figure 3 shows the import market share of sheet and long products through December which is the latest data available (January exports and AISI shipment data for January will be released later this week).
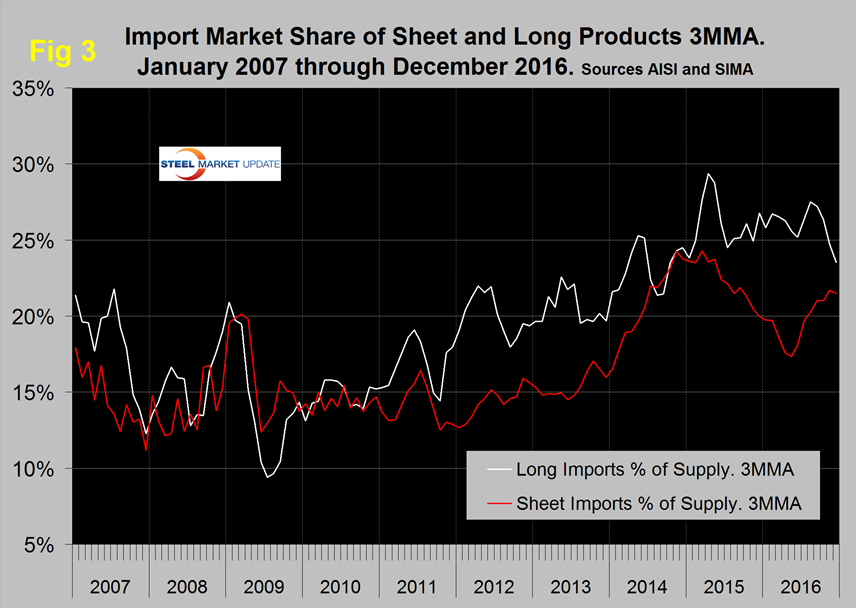
The import market share of sheet products peaked at 24.3 percent in March 2015. After declining to 17.4 percent in May 2016 the import share gradually increased to 21.5 percent in December. Long product import market share peaked at 29.4 in April 2015 and in December stood at 23.5 percent.
Net imports equals imports minus exports and our analysis is based on the final volumes through December. We regard this as an important look at the overall trade picture and its effect on demand at the mill level. Figure 4 shows net sheet product imports on a 3MMA basis at 623,245 tons in December which was down from 665,083 in August.
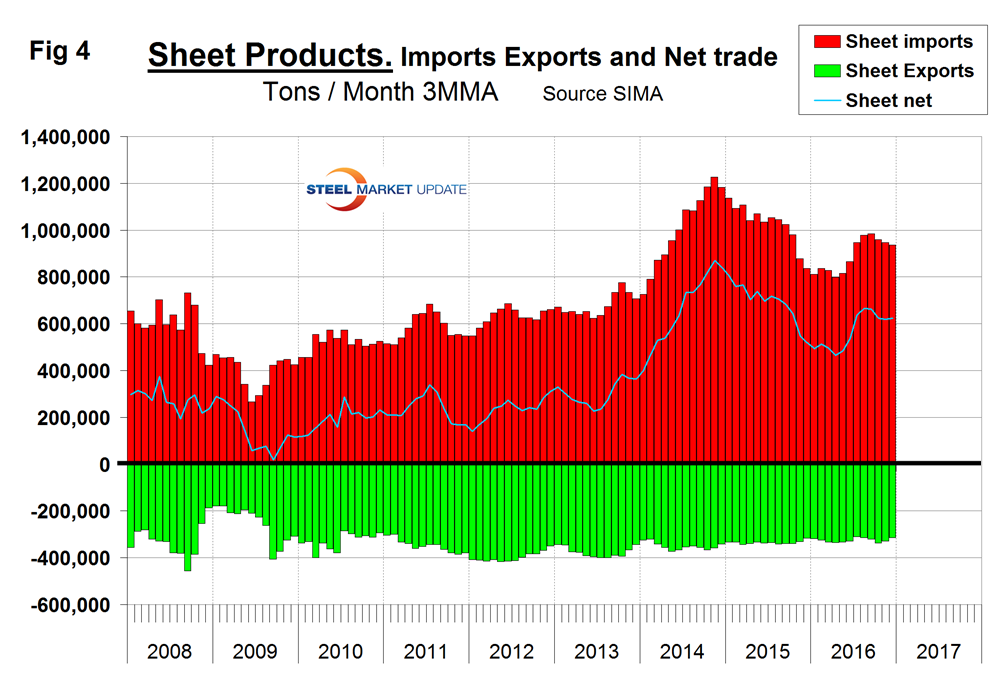
The total of net sheet imports in 2016 was down by 1.459 million tons from the 2015 total. Compared to imports, exports have been relatively consistent for almost eight years. Net sheet steel imports are still high by historical standards. If as expected the Fed continues to raise interest rates in 2017, the US dollar will appreciate against the currencies of the steel trading nations and this in turn will put upward pressure on imports and downward on exports in the balance of 2017.
Explanation: The SMU publishes several import reports ranging from this very early look using licensed data to the very detailed analysis of final volumes by product, by district of entry and by source nation which is available on the premium member section of our web site. The early look, the latest of which you are reading now has been based on three month moving averages (3MMA) using the latest licensed data, either the preliminary or final data for the previous month and final data for earlier months. We recognize that the license data is subject to revisions but believe that by combining it with earlier months in this way gives a reasonably accurate assessment of volume trends by product as early as possible. We are more interested in direction than we are in absolute volumes at this stage. The main issue with the license data is that the month in which the tonnage arrives is not always the same month in which the license was recorded. In 2014 as a whole our data showed that the reported licensed tonnage of all carbon and low alloy products was 2.3 percent less than actually receipts, close enough we believe to confidently include licensed data in this current update. The discrepancy declined continuously during the course of the twelve month evaluation as a longer time period was considered.


