

Market Data

March 28, 2017
Currency Update for Steel Trading Nations
Written by Peter Wright
Please see the end of this report for an explanation of data sources.
The Broad Index value of the US $ is reported several days in arrears by the Federal Reserve, the latest value published was dated March 17th (Figure 1).
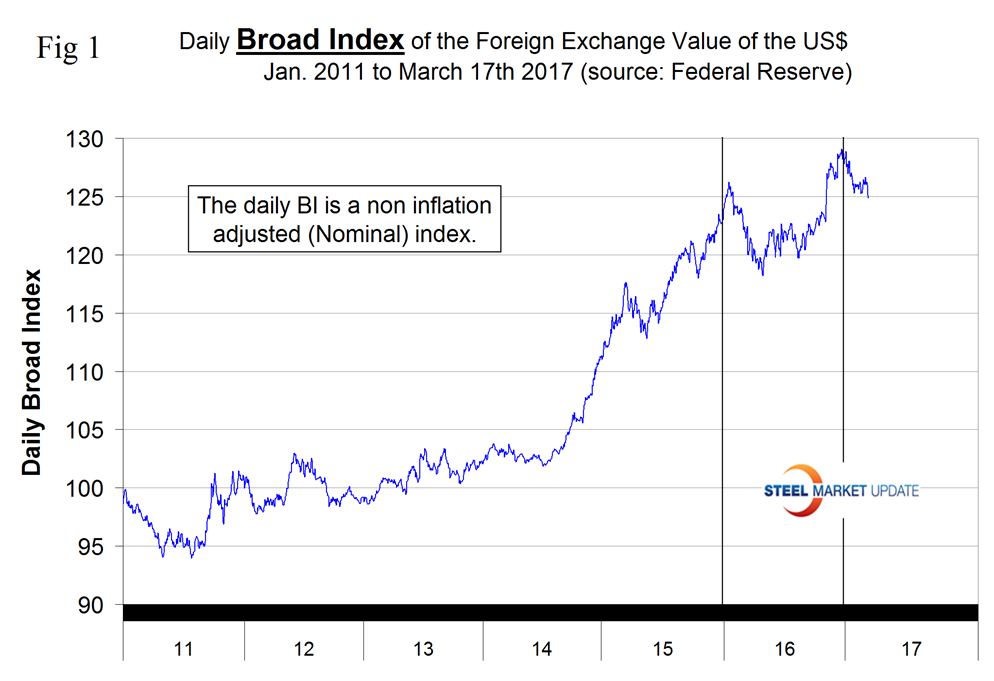
The dollar had a recent peak of 128.963 on January 3rd which was the highest value since April 4, 2004, almost 15 years. Traders anticipate interest rate differentials and have become much less hawkish on the dollar. Since January 3rd the dollar has weakened to 124.8776, a decline of 3.2 percent and the lowest value since November 9th.
From Andrew Hecht, March 26th: “The most compelling argument for a return of the rally in the dollar is the interest rate differentials that are in place as a result of two rate hikes equaling 50 basis points by the Fed since December 2016. The Fed has indicated that two more rate hikes are likely coming before the end of this year. The Fed Funds rate currently stands at 1 percent and could rise to 1.5 percent by the end of 2017. While those rates are historically low, they create a bullish case for the dollar considering the other two reserve currencies in the world, the euro, and yen, have short-term rates of negative forty basis points, and that is not likely to change this year. The current interest rate differentials and prospects for them to widen mean that the downside for the dollar is limited. It appears to be that the current weakness in the dollar is political: a reaction to the difficulty the new administration faces in fulfilling campaign promises even though a majority of Congress shares the same political party with the President. Fundamentals, in the form of interest rate differentials, the long-term trend, and short-term oversold condition in the dollar index could mean we are coming close to a low for the greenback in the days and weeks ahead. I remain bullish on the dollar, but it does not look like it is running away on the upside anytime soon. Of course, if European elections provide shocking results, the dollar could take off like a rocket based on its long record of stability.”
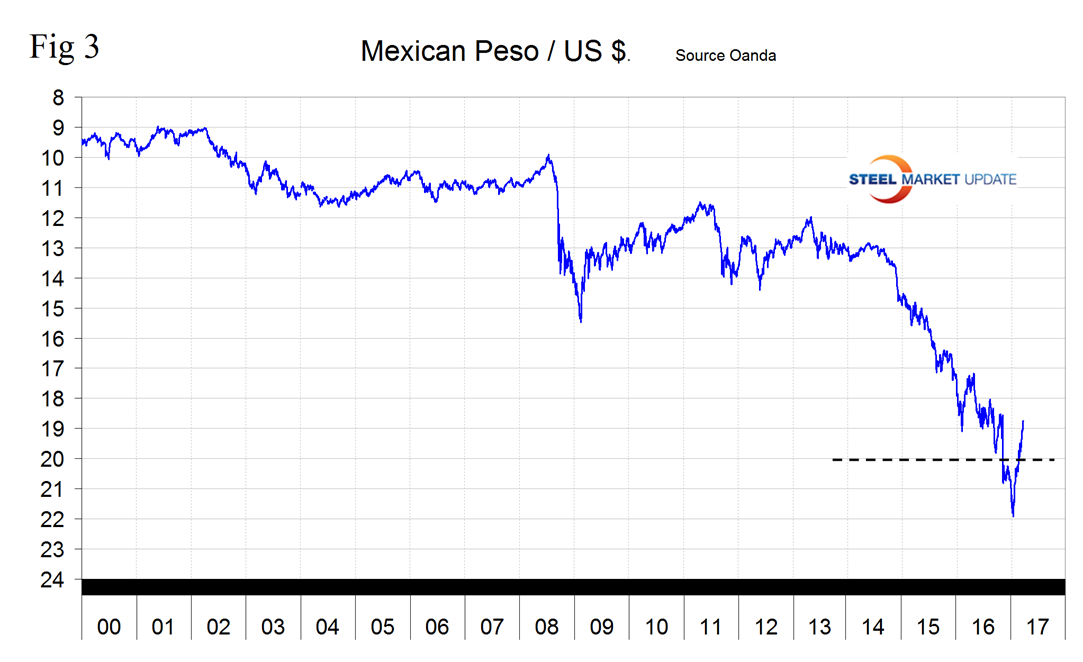
Each month we publish an update of Table 1 which, even though it shows the change in value in four different time frames, is still a bit of a snapshot of the value of the major sixteen steel and iron ore trading nations.
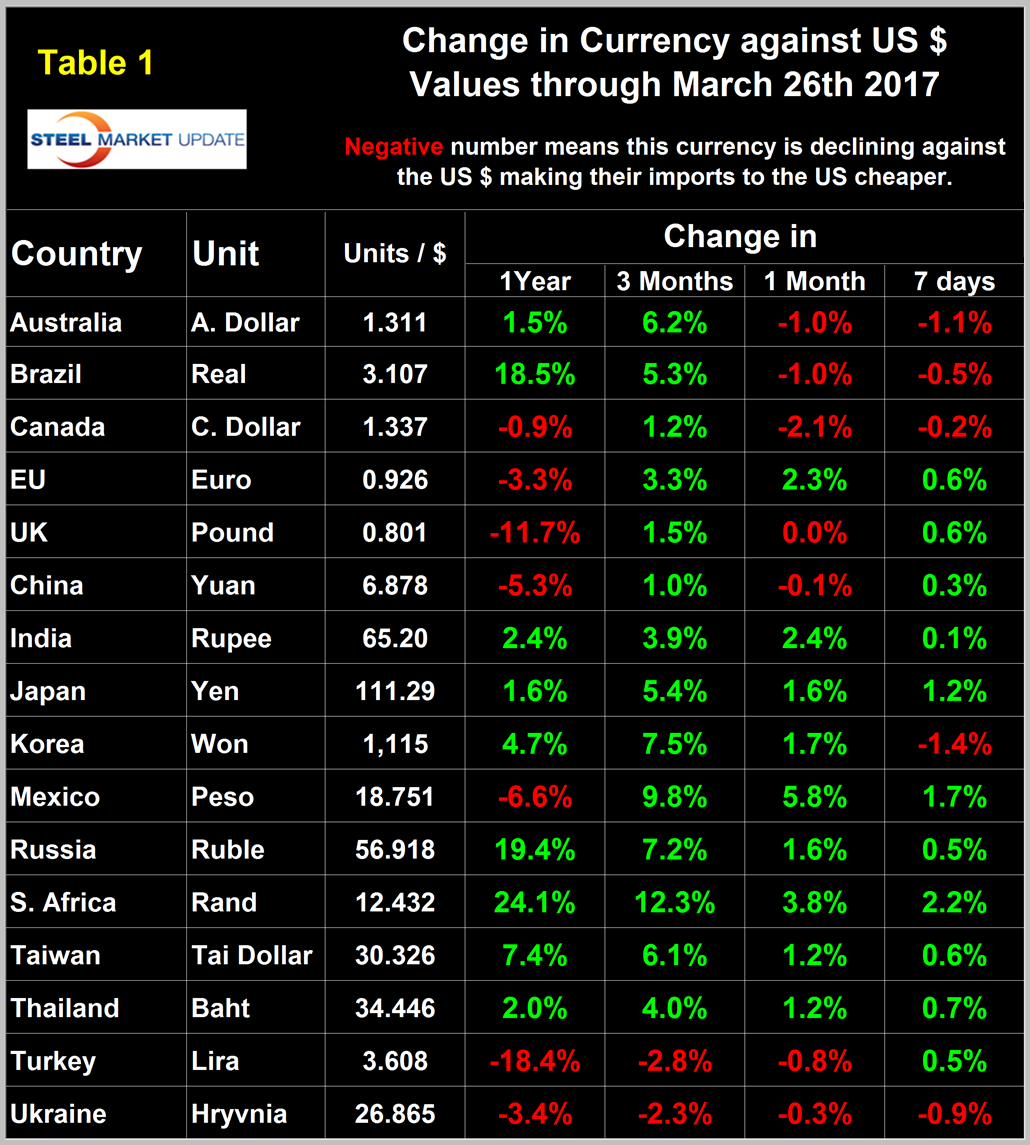
Snapshots are something we try to avoid in all our data presentations because direction is everything. Last month we published both January and February versions to try to present a better sense of direction in the sixteen currencies. This month we have started a different look as shown in Figure 2.
It took a lot of digging to get as far as we did with this analysis and we will finish it off next month. However it does show very dramatically how the direction in the value of the dollar on a rolling 3 month comparison has done a complete reversal between November 2016 when it was strengthening against all sixteen to March 2017 when it weakened against fourteen of the sixteen. Table 1 is color coded to indicate strengthening of the dollar in red and weakening in green. We regard strengthening of the US Dollar as negative and weakening as positive because the effect on net imports. The March 26th version of Table 1 has the dollar weakening against nine of the sixteen at the one month level and against eleven of the sixteen at the seven day level.
In each of these reports we comment on a few of the 16 steel trading currencies listed in Table 1. Charts for each of the 16 currencies are available through March 26th for any premium subscriber who requests them. We also include writings from experts who we regard as credible to explain some of the currency moves that we are living through. This month we came across an article by Shikha Kothari about Bitcoin and decided to summarize it here because increasingly this decentralized currency is finding application in legitimate business. In January SMU had an unfortunate introduction to Bitcoin when one of our computers was hijacked for ransom and a payment of three units was demanded for the de-encryption of our data (we elected not to pay).
Bitcoin
“Bitcoin is the technological revolution in currency. It has revised the meaning of money. Since the barter system, only a fiat currency has been considered the main medium of exchange in most transactions. But with the creation of Bitcoin, we can say the world is moving forwardly at a fast pace. Bitcoin was created in 2009: it hit the headlines in 2013 and currently is trading at $1,283.80. Bitcoin is not controlled by any authority. This is unlike the fiat currencies such as the dollar, euro, and yen, which are all controlled by a central bank. Instead, Bitcoin is controlled by a global peer-to-peer network of computers and isn’t tangible. Bitcoin is neither a company nor an entity. It is the first decentralized cryptocurrency, created by Satoshi Nakamoto immediately after the financial crisis. Basically, people are turning towards Bitcoin to minimize potential losses due to the increase in risk of traditional currencies. We believe that this is due to recent uncertainty surrounding global financial markets. Economic distress in countries such as Japan, China, India, and Venezuela has threatened to destabilize those countries’ currencies and have sparked an interest in the digital alternative. The same thing happened when Britain voted to leave the European Union last year, as well as with the unlikely victory by Donald Trump to win the U.S. presidential election. The Federal Reserve chairperson Janet Yellen has signaled that Fed may further increase the interest rates this year if the economy continues to improve as expected. The increase in rates will make the dollar even stronger and against Japanese and the Chinese currency. Traders who consider Bitcoin as a wealth protection and management product, which is the clear majority of Bitcoin users as of now, will move into Bitcoin to protect their assets from devaluation.”
The Mexican Peso
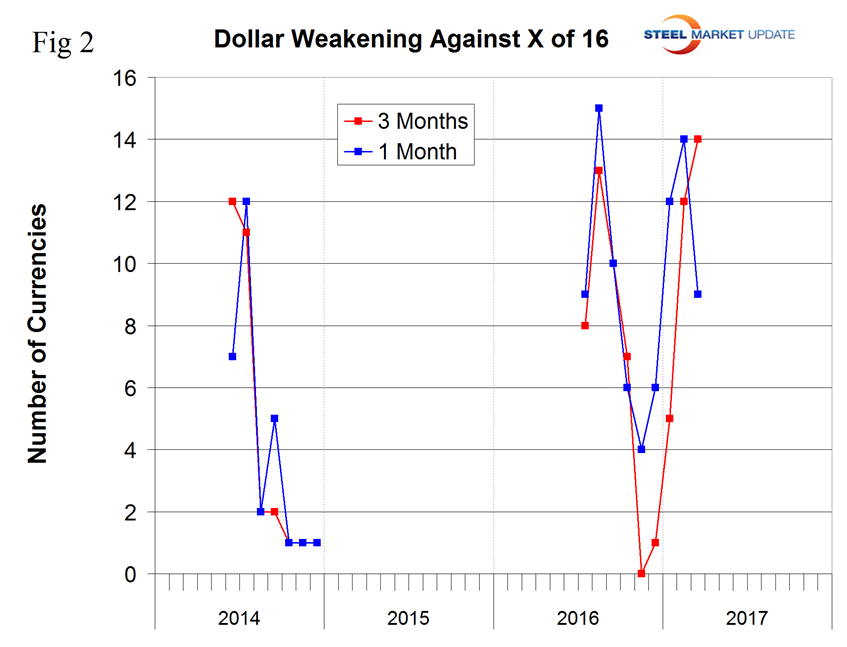
The Mexican Peso has manifested the most dramatic strengthening of all the currencies we are examining here at the one month and seven day level. Two days after the US election the peso broke through the 20/US $ level for the first time ever and continued to decline until January 19th when it reached 21.9211/US $. Since then the peso has recovered to reach 18.751/$ on March 26th (Figure 3).
The Peso has appreciated by 9.8 percent in three months, 5.8 percent in one month and by 1.7 percent in seven days. On January 1st 1994, when the NAFTA was initiated it took only 3.5 pesos to buy one US dollar.
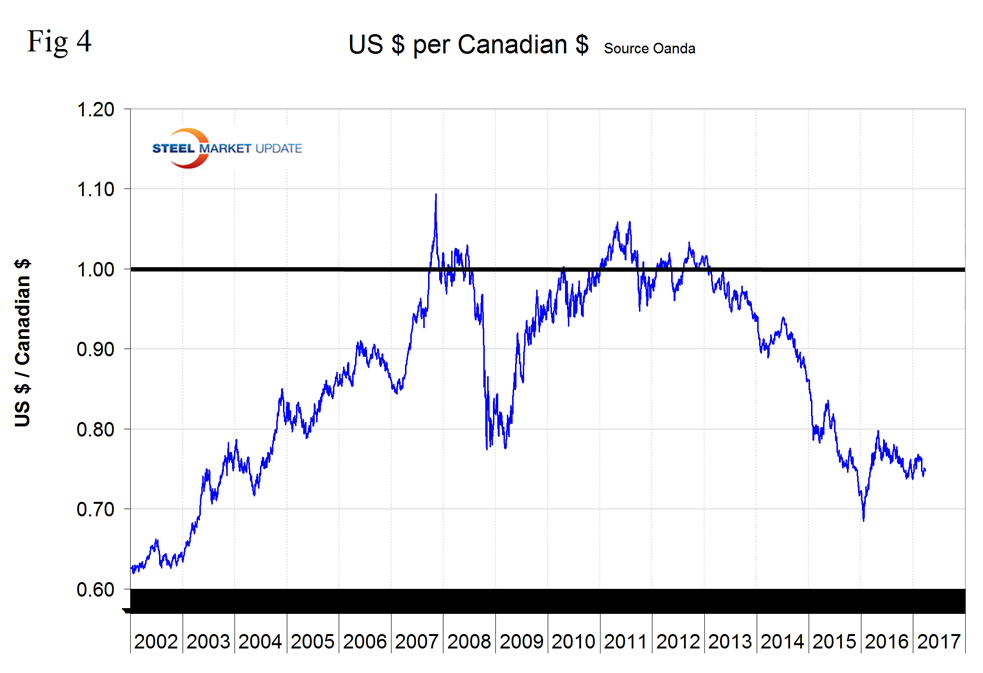
The Canadian Dollar
The Canadian $ has been relatively stable over the last year with only a 0.9 percent decline against the green back (Figure 4).
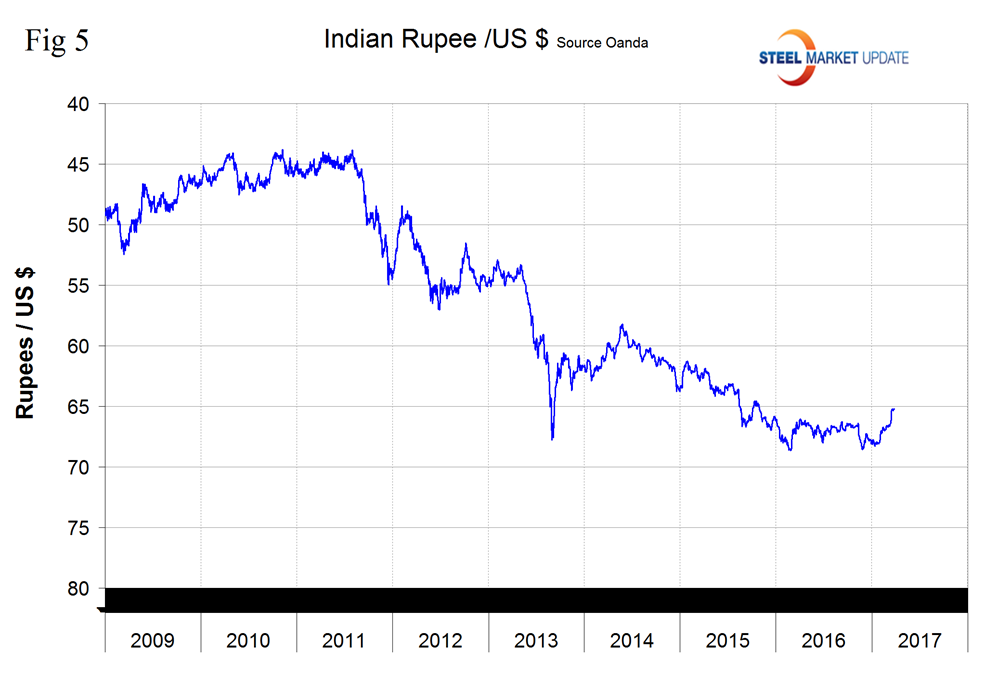
The Indian Rupee
This is the first time we’ve reported on India which is an oversight because their steel production volume is approaching 100 million tonnes. On February 22nd the IMF Executive Board Concluded 2017 Article IV Consultation with India. The following is extracted from the IMF statement. Economic risks are tilted to the downside. On the external side, despite the reduced imbalances and strengthened reserve buffers, the impact from global financial market volatility could be disruptive, including from U.S. monetary policy normalization or weaker-than-expected global growth. In the absence of disruptive global financial volatility, slower growth in China, Europe and the United States would have only modest adverse spillovers to India, given weak trade linkages. A key domestic risk stems from the government’s currency exchange initiative, where the near-term adverse economic impact of accompanying cash shortages remains difficult to gauge, while it may have a positive economic impact in the medium term. Domestic risks also flow from a potential further deterioration of corporate and public bank balance sheets, as well as setbacks in the reform process, including in GST design and implementation, which could weigh on domestic demand-driven growth and undermine investor and consumer sentiment. On the upside, larger than expected gains from GST and further structural reforms could lead to significantly stronger growth: while a sustained period of continued-low global energy prices would also be very beneficial to India.
Figure 5 shows the value of the Rupee in US dollars since January 2009. The Rupee has strengthened by 3.9 percent in three months and by 2.4 percent in one month.
Explanation of Data Sources: The Broad Index is published by the Federal Reserve on both a daily and monthly basis. It is a weighted average of the foreign exchange values of the U.S. dollar against the currencies of a large group of major U.S. trading partners. The index weights, which change over time, are derived from U.S. export shares and from U.S. and foreign import shares. The data are noon buying rates in New York for cable transfers payable in the listed currencies. At SMU we use the historical exchange rates published in the Oanda Forex trading platform to track the currency value of the US $ against that of sixteen steel trading nations. Oanda operates within the guidelines of six major regulatory authorities around the world and provides access to over 70 currency pairs. Approximately $4 trillion US $ are traded every day on foreign exchange markets.


