

Market Data

June 22, 2017
Global Trade of Hot Rolled Coil
Written by Peter Wright
We are continuing our investigation to quantify the players in the global trade of both HRC and CRC. We now have data for the first quarter of this year. This information is sourced quarterly from the Iron and Steel Statistics Bureau in the UK. It takes about 10 weeks after the close of a quarter before all the countries have submitted their information. However, even if rather late, we think the history helps explain where we are now and shines a light on the relative position of the U.S. in the global picture. This update covers the global trade of HRC through Q1 2017.
Data was received from 45 exporting nations and 201 importing nations, not including those within the EU. For the purpose of this analysis, we consider the EU as a single trading block. Figure 1 shows the global total by quarter, including both trade within the EU and excluding that volume. In Q1 2017, total global trade increased sharply. But when trade within the EU is excluded, we see that global HRC trade has been quite flat since Q4 2014.
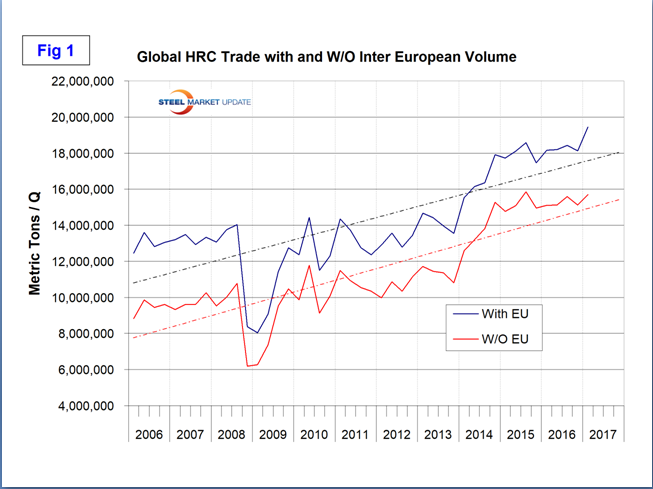
In 2016 as a whole, 60,780,000 metric tons of hot rolled coil were traded around the world, not including trade within the EU. In Q1 2017, the annual rate was 62,822,000 tons. The top six exporters in Q1 in order of volume were China, Japan, Russia, India, South Korea and Taiwan. Ukraine, Turkey and the EU comprised the next group and all were less than half Taiwan’s volume.
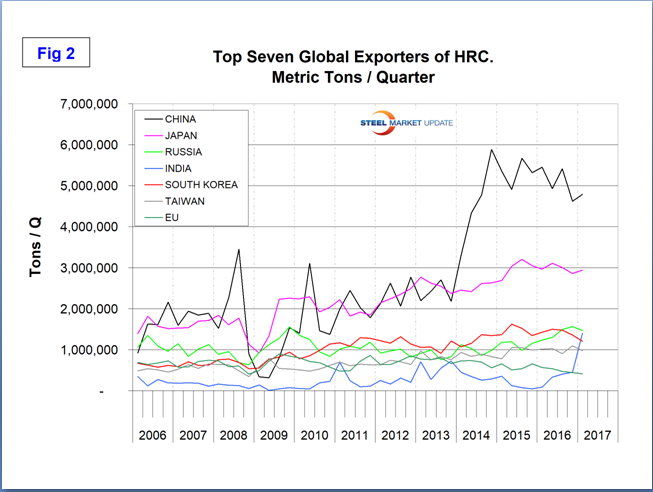
Figure 2 shows the relative size of China as an exporter, but also that Japan is exporting well over half as much as China. The most significant change in Q1 2017 was that India increased its volume by 91 percent compared to Q4 2016 and moved into fourth place. China exported 20.4 million metric tons of HRC in 2016, but its tonnage has been contracting since Q4 2014. China’s annual rate in Q1 2017 was 19.1 million tons.
The EU has been successful in shutting out China’s HRC imports in both Q4 2016 and Q1 2017, as shown in Figure 3. Vietnam is the largest volume destination for China’s exports, followed by South Korea. One of the main points of this analysis is to identify trends such as this because as one nation successfully defends against another, the volume will pop up somewhere else. As seen below, the defending nation doesn’t necessarily experience a decline in total import volume.
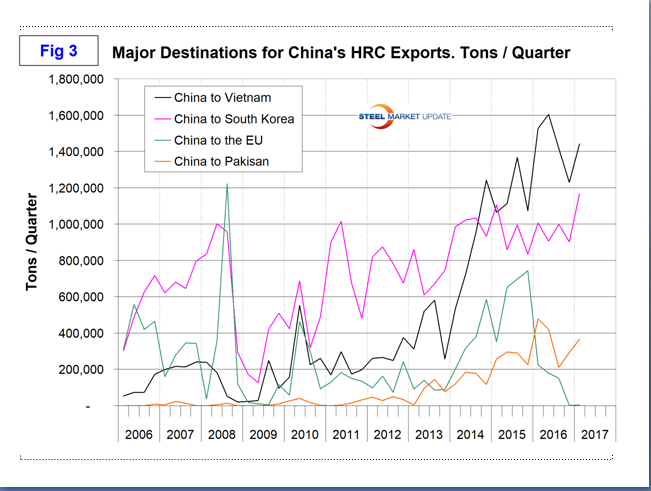
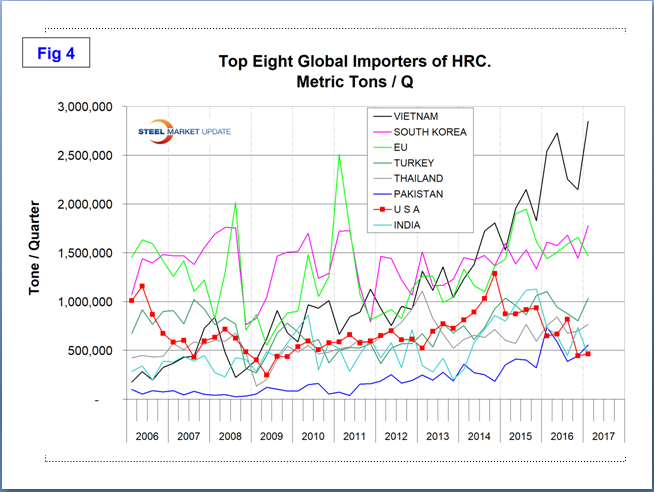
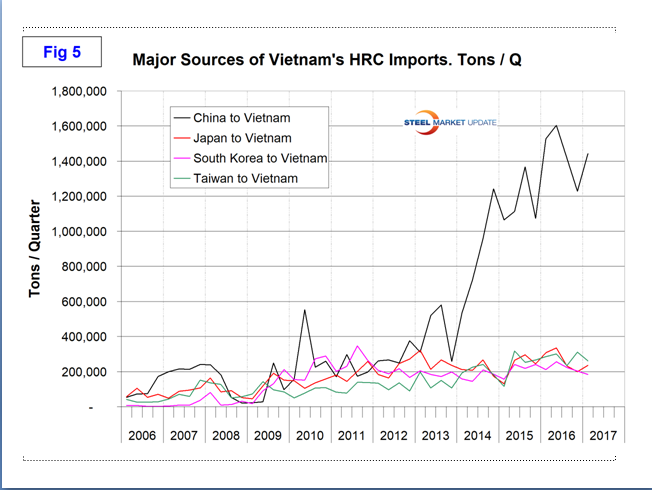
Figure 4 shows the top eight importing nations through Q1 2017. In the first quarter, the U.S. was in seventh place. Vietnam has by far the highest volume of any importing nation, which on the face of it seems impossible as its annualized import rate of HRC in Q1 2017 was 11.4 million tons. We assume that this must be the further processing and re-export of Chinese coil. In Figure 5 we see the startling increase in tonnage shipped from China to Vietnam since Q4 2013. Vietnam’s other sources have been relatively unchanged. It is evident that the U.S. is not (as has been frequently claimed) the most porous import market in the world. The EU was in third place for total HRC imports in Q1 in spite of shutting out China.
We intend to continue this exercise quarterly for our premium subscribers.


