

Prices

July 6, 2017
Sheet Imports Increase 15.1 Percent from May to June
Written by Peter Wright
The final license data for June was reported by the Steel Import Monitoring and Analysis system of the U.S. Commerce Department on July 5. An explanation of the methodology that we at SMU use to analyze the trade data is given at the end of this piece. All volumes in this analysis are reported in short tons. The total volume of carbon and alloy products was up again in June to the highest level since March 2015. Flat rolled and long products were up, but semis decreased. Total rolled product licensed imports in the single month of June were 2,918,333 tons with a three-month moving average (3MMA) of 2,609,133 tons. We prefer not to dwell on single month results because of the extreme variability that can occur in individual products. In the comments below, we use three-month moving averages to give a more representative picture.
Figure 1 shows the 3MMA through June licensed tons of semi-finished, flat and long products since January 2004.
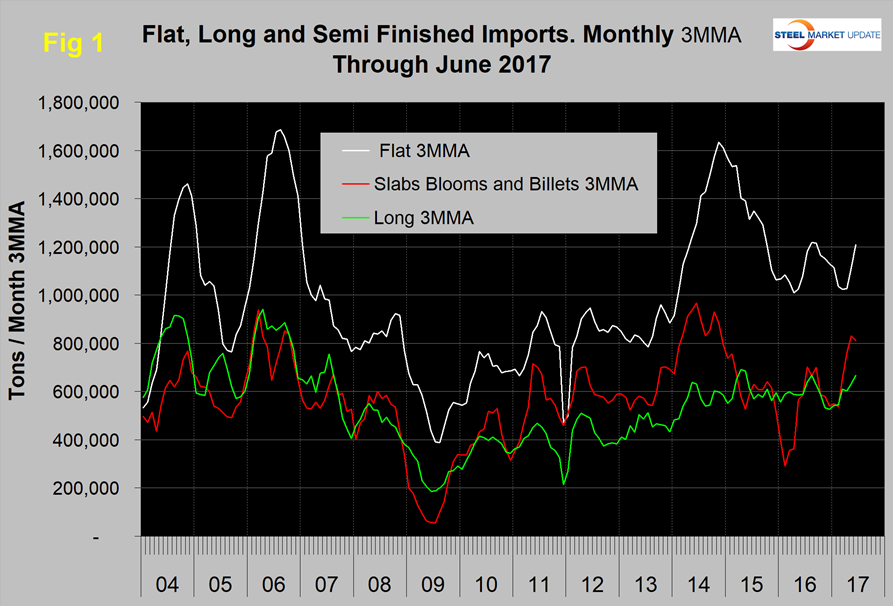
Imports of semi-finished in June were 804,671 tons with a three-month moving average of 811,392 tons. “Flat” includes all hot and cold rolled sheet and strip plus all coated sheet products plus both discrete and coiled plate. The 3MMA of flat rolled imports was up by 161,000 tons from May. Long product imports have been range bound between 519,000 tons and 772,000 tons since June 2014 with no particular trend evident. In June 2017 the 3MMA of long product imports was 667,724 tons.
Figure 2 shows the 3MMA trend of sheet and strip products since January 2004.
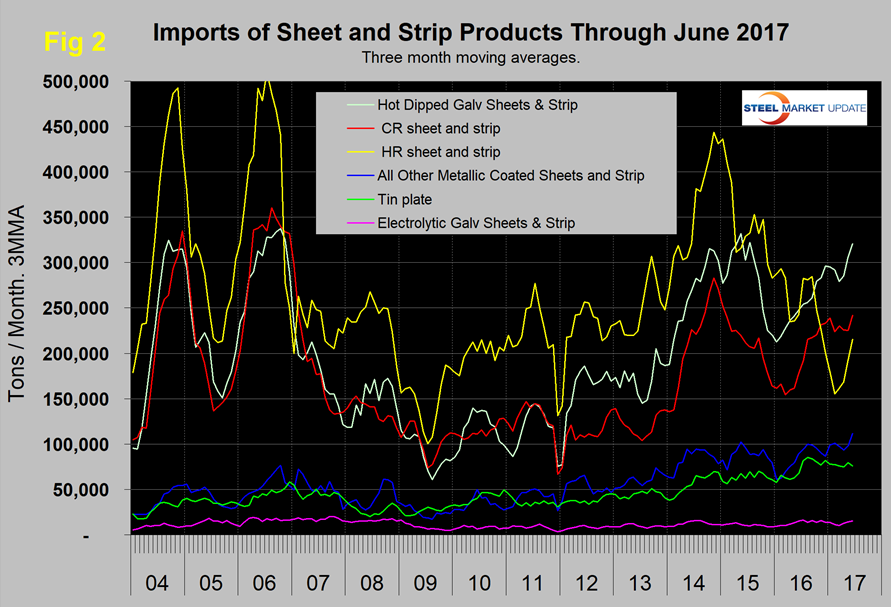
The total of these products was up by 15.1 percent in three months through June compared to three months through March and up by 16.8 percent year over year. HRC was down sharply in the five months through February, but has increased since then. CRC and HDG are now higher than HRC on a 3MMA basis, which is very unusual. Other metallic coated (OMC), mainly Galvalume and tin plate, have been trending up since 2009. Electrogalvanized has been declining for a year.
Table 1 provides an analysis of major product groups and of sheet products in detail. It compares the average monthly tonnage in the three months through June 2017 with both three months through March (3M/3M) and the three months through June 2016 (Y/Y).
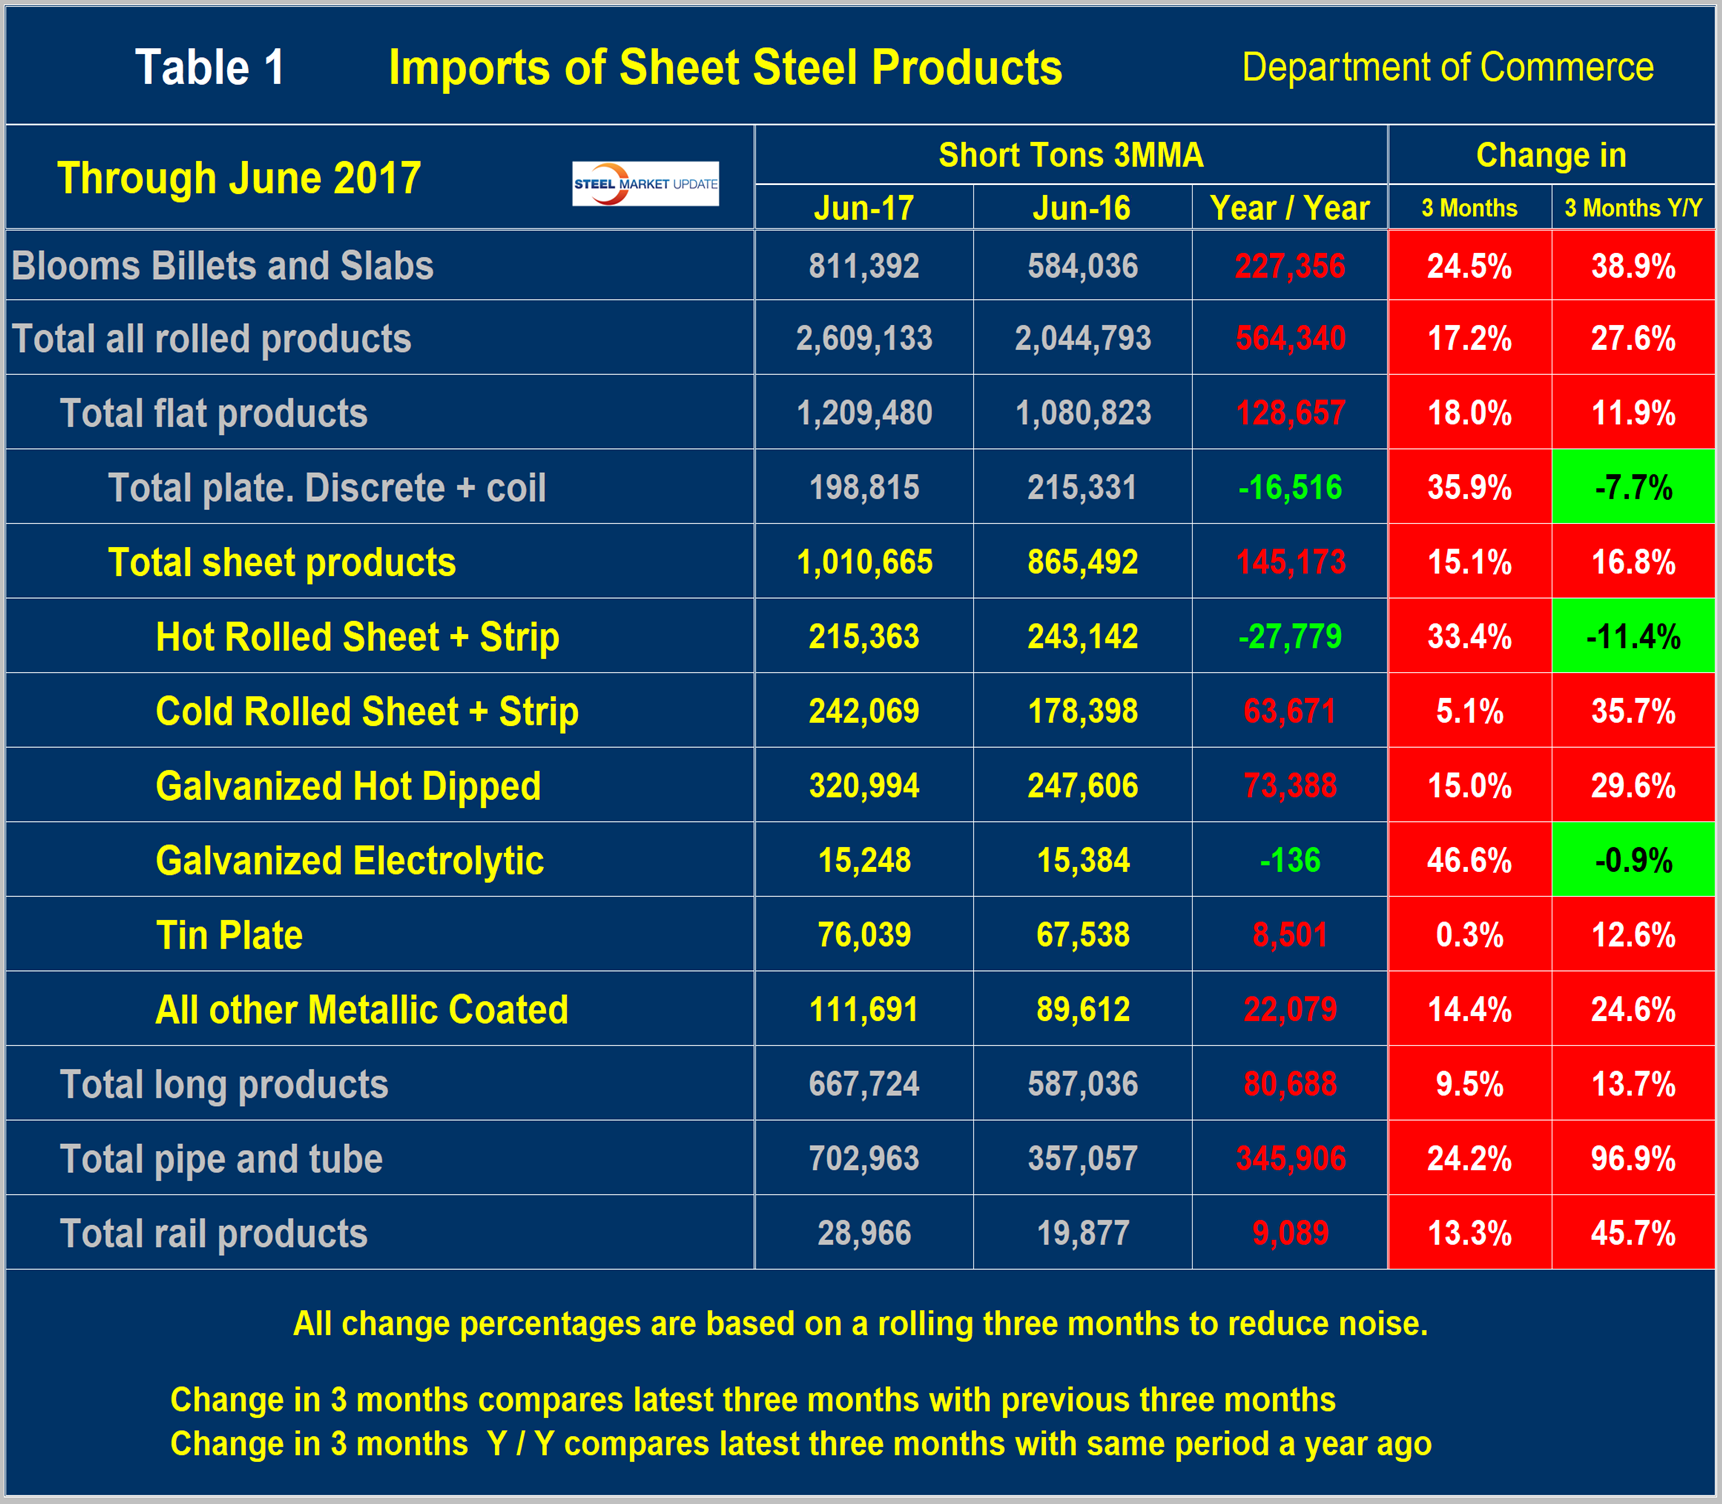
All product groups were up in the three month time comparison and only plate, HRC and electrogalvanized had any relief compared to the year ago results. The total of all rolled products was up by 27.6 percent Y/Y. Total sheet products were up by 16.8 percent. Tubulars were up by 96.9 percent and long products were up by 13.7 percent.
There were big differences between the individual sheet products compared to last year. HRC was down by 11.4 percent Y/Y, CRC and HDG were up by 35.7 percent and 29.6 percent, respectively. OMC was up by 24.6 percent. Table 2 shows the same analysis for long products. The total tonnage of long products was up by 80,688 tons per month Y/Y. On a 3M/3M basis, the total volume of long products increased by 13.7 percent.
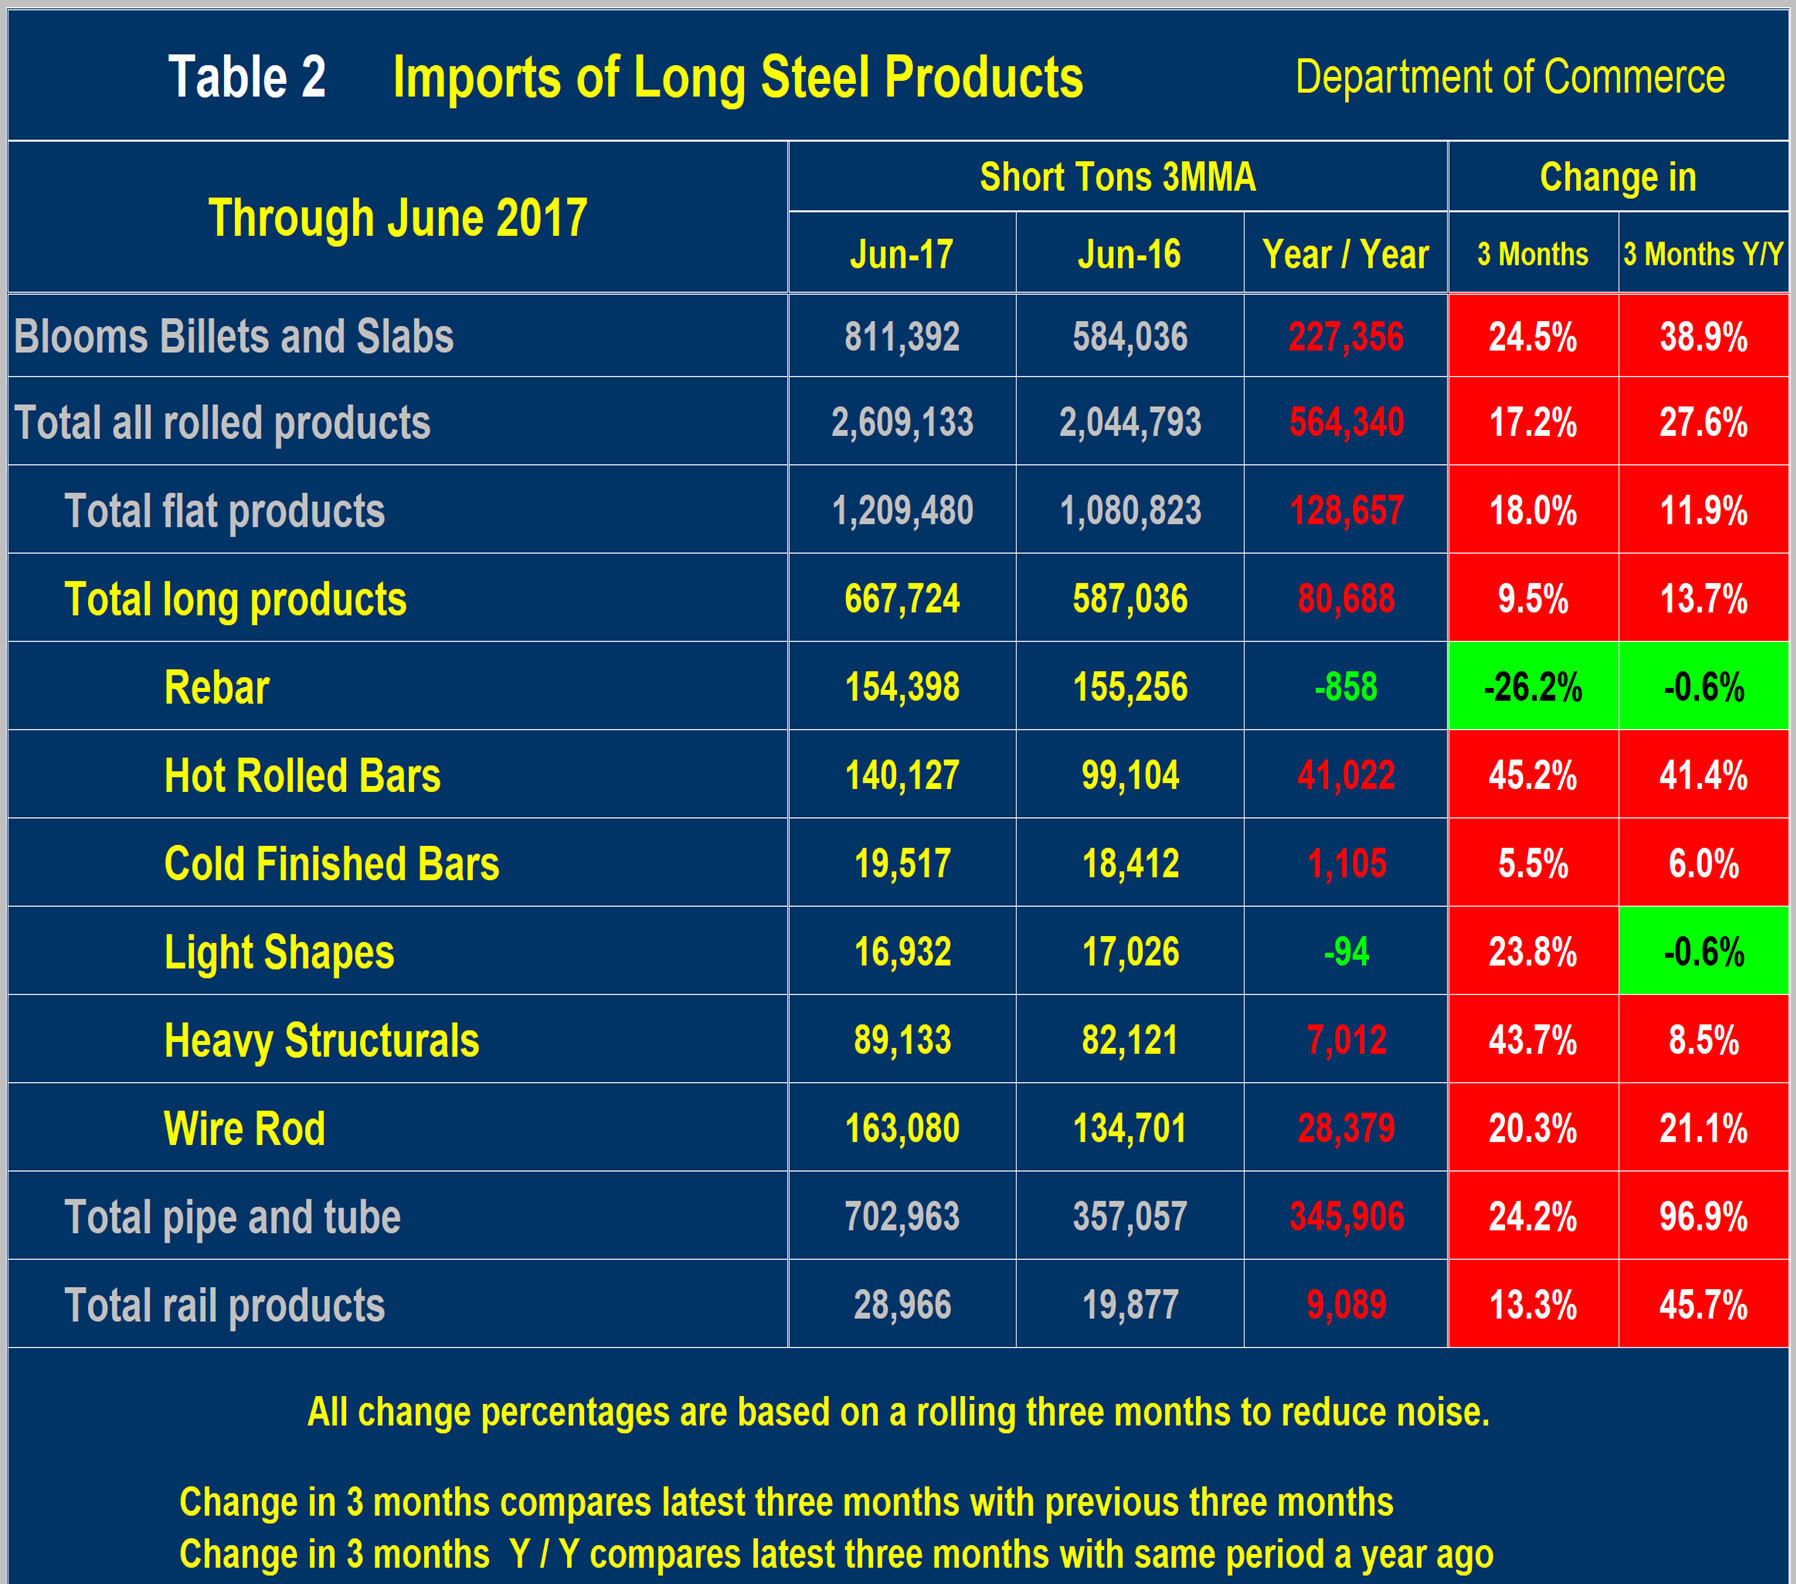
Figure 3 shows the import market share of sheet and long products through April, which is the latest data available.
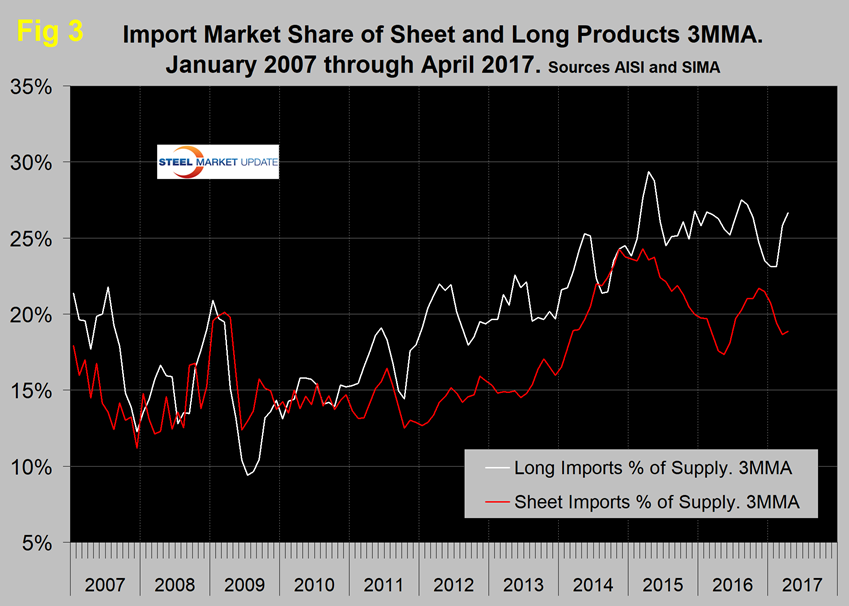
The import market share of sheet products peaked at 24.3 percent in March 2015. There was a recent low of 17.4 percent in June 2016 and a bounce to 21.7 percent in November. The April 2017 level was 18.9 percent. Long product import market share has been considerably higher than for sheet products since early 2015 and in April was 26.6 percent.
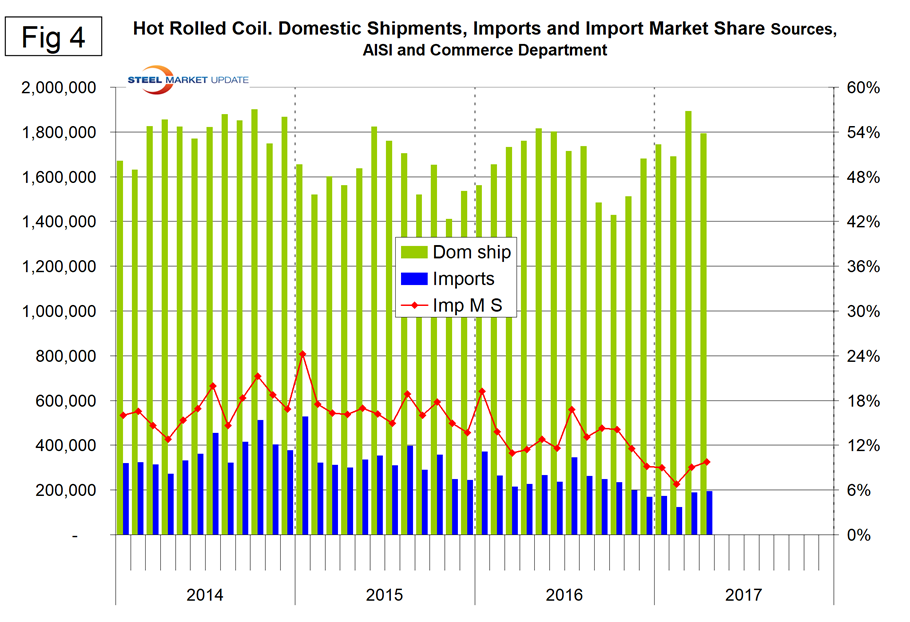
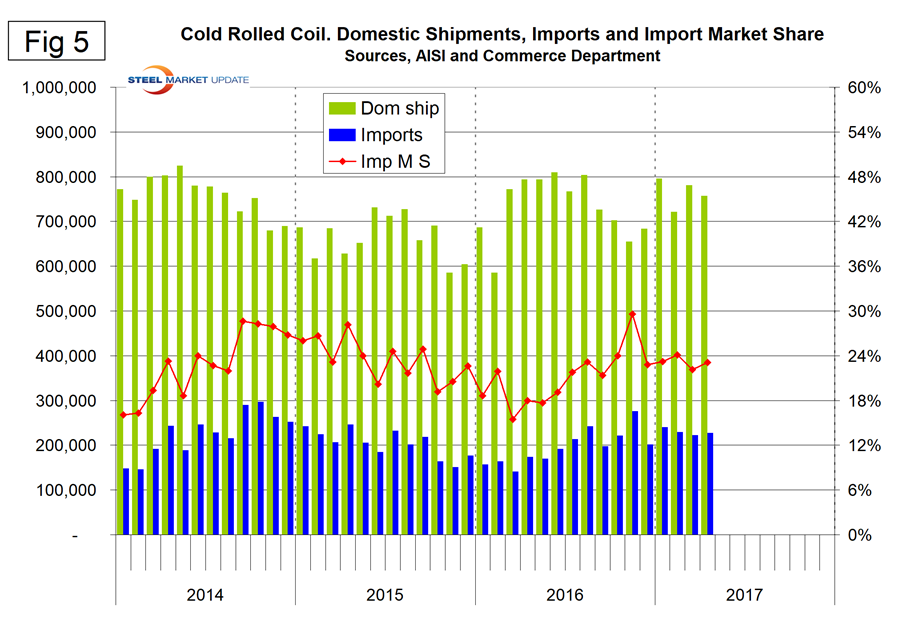
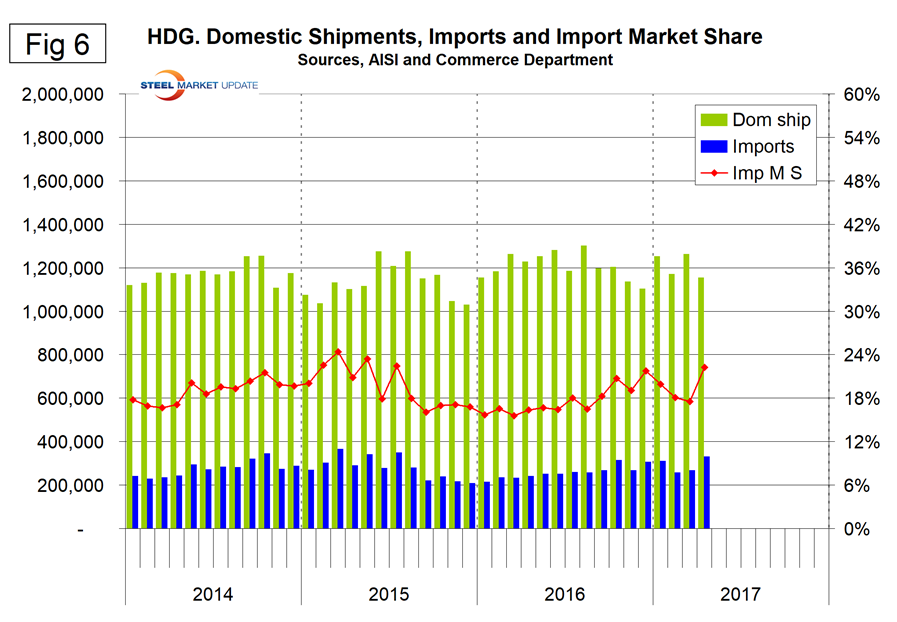
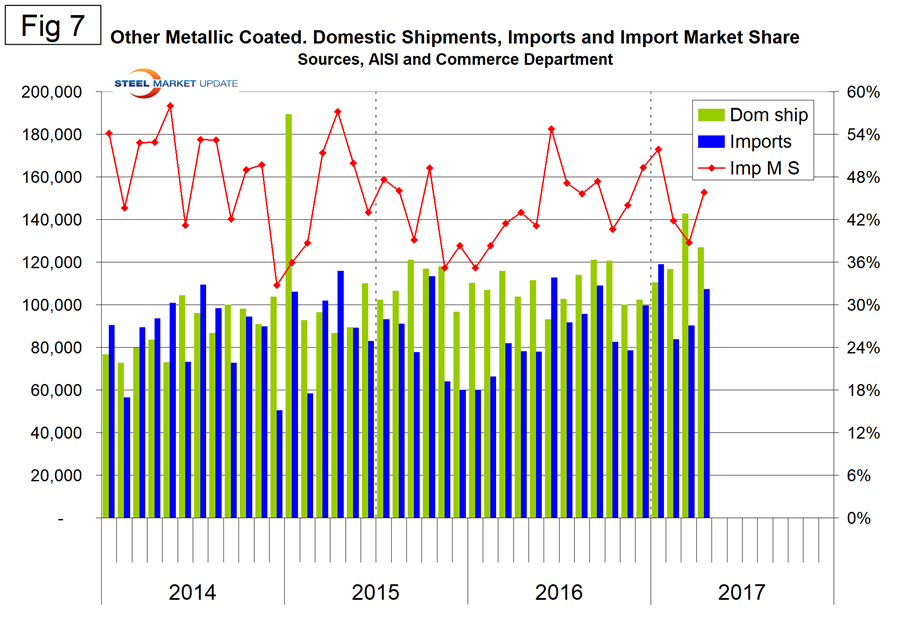
Figures 4 through 7 show domestic mill shipments to domestic locations, imports and import market share for the four major sheet products. Note: the right-hand import share axes are the same to give true comparability. HRC has the lowest import share, CRC and HDG are similar and OMC is by far the highest.
Net imports equals imports minus exports, and our analysis is based on the final volumes through April. We regard this as an important look at the overall trade picture and its effect on demand at the mill level. Figure 8 shows net sheet product imports on a 3MMA basis to be 524,997 tons in April, which was almost the same as March but down from 665,083 in August last year.
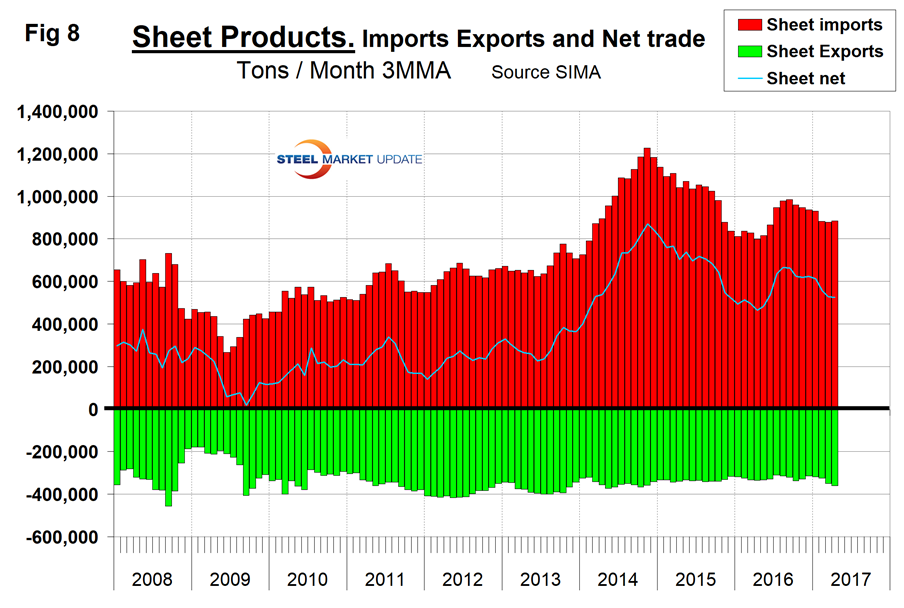
Exports have increased every month since last November, and this has been a major driver of the decline of net imports. Net sheet steel imports are still high by historical standards. If as expected the Fed continues to raise interest rates in 2017, the U.S. dollar will appreciate against the currencies of the steel trading nations and this in turn will put upward pressure on imports and downward on exports in the balance of 2017.
Explanation: The SMU publishes several import reports ranging from this very early look using licensed data to the very detailed analysis of final volumes by product, by district of entry and by source nation, which is available on the premium member section of our website. The early look, the latest of which you are reading now, has been based on three-month moving averages using the latest licensed data, either the preliminary or final data for the previous month and final data for earlier months. We recognize that the license data is subject to revisions, but believe that by combining it with earlier months in this way gives a reasonably accurate assessment of volume trends by product as early as possible. We are more interested in direction than we are in absolute volumes at this stage. The main issue with the license data is that the month in which the tonnage arrives is not always the same month in which the license was recorded. In 2014 as a whole, our data showed that the reported licensed tonnage of all carbon and low alloy products was 2.3 percent less than actual receipts, close enough we believe to confidently include licensed data in this current update. The discrepancy declined continuously during the course of the 12-month evaluation as a longer time period was considered.
Statement from the Department of Commerce: The Steel Import Monitoring and Analysis (SIMA) System, under the Department of Commerce, collects and publishes data of steel mill product imports. By design this information provides stakeholders valuable information on steel trade with the United States. This is achieved through two tools: the steel licensing program and the steel import monitor. All steel mill imports into the United States require a license issued by the SIMA office. The SIMA Licensing System is an on-line automatic system for users to register, apply for, and receive licenses in a quick and timely manner. This on-line system allows importers to process imports with minimal effort and added efficiency. In addition to managing the licensing system, SIMA publishes near real-time aggregate data on steel mill imports into the United States. These data incorporate information collected from steel license applications and publicly released Census data. The data are displayed in tables and graphs for users to analyze various levels and changes in steel trade involving the United States. Additionally, SIMA provides data on U.S. steel mill exports, as well as imports and exports of select downstream steel products.


