

Market Data

July 31, 2017
Key Market Indicators Recover from June Blip
Written by Peter Wright
In the Key Indicators data released in July, both the present situation and trends have recovered from what now appears to have been a temporary downward blip in June. Trends lead the present situation by about four months. An explanation of the Key Indicators concept is given at the end of this piece for those readers who are unfamiliar with it. This will explain the difference between our view of the present situation, which is subjective, and our analysis of trends, which is based on the latest facts available.
![]() The total number of indicators considered in this analysis is 36.
The total number of indicators considered in this analysis is 36.
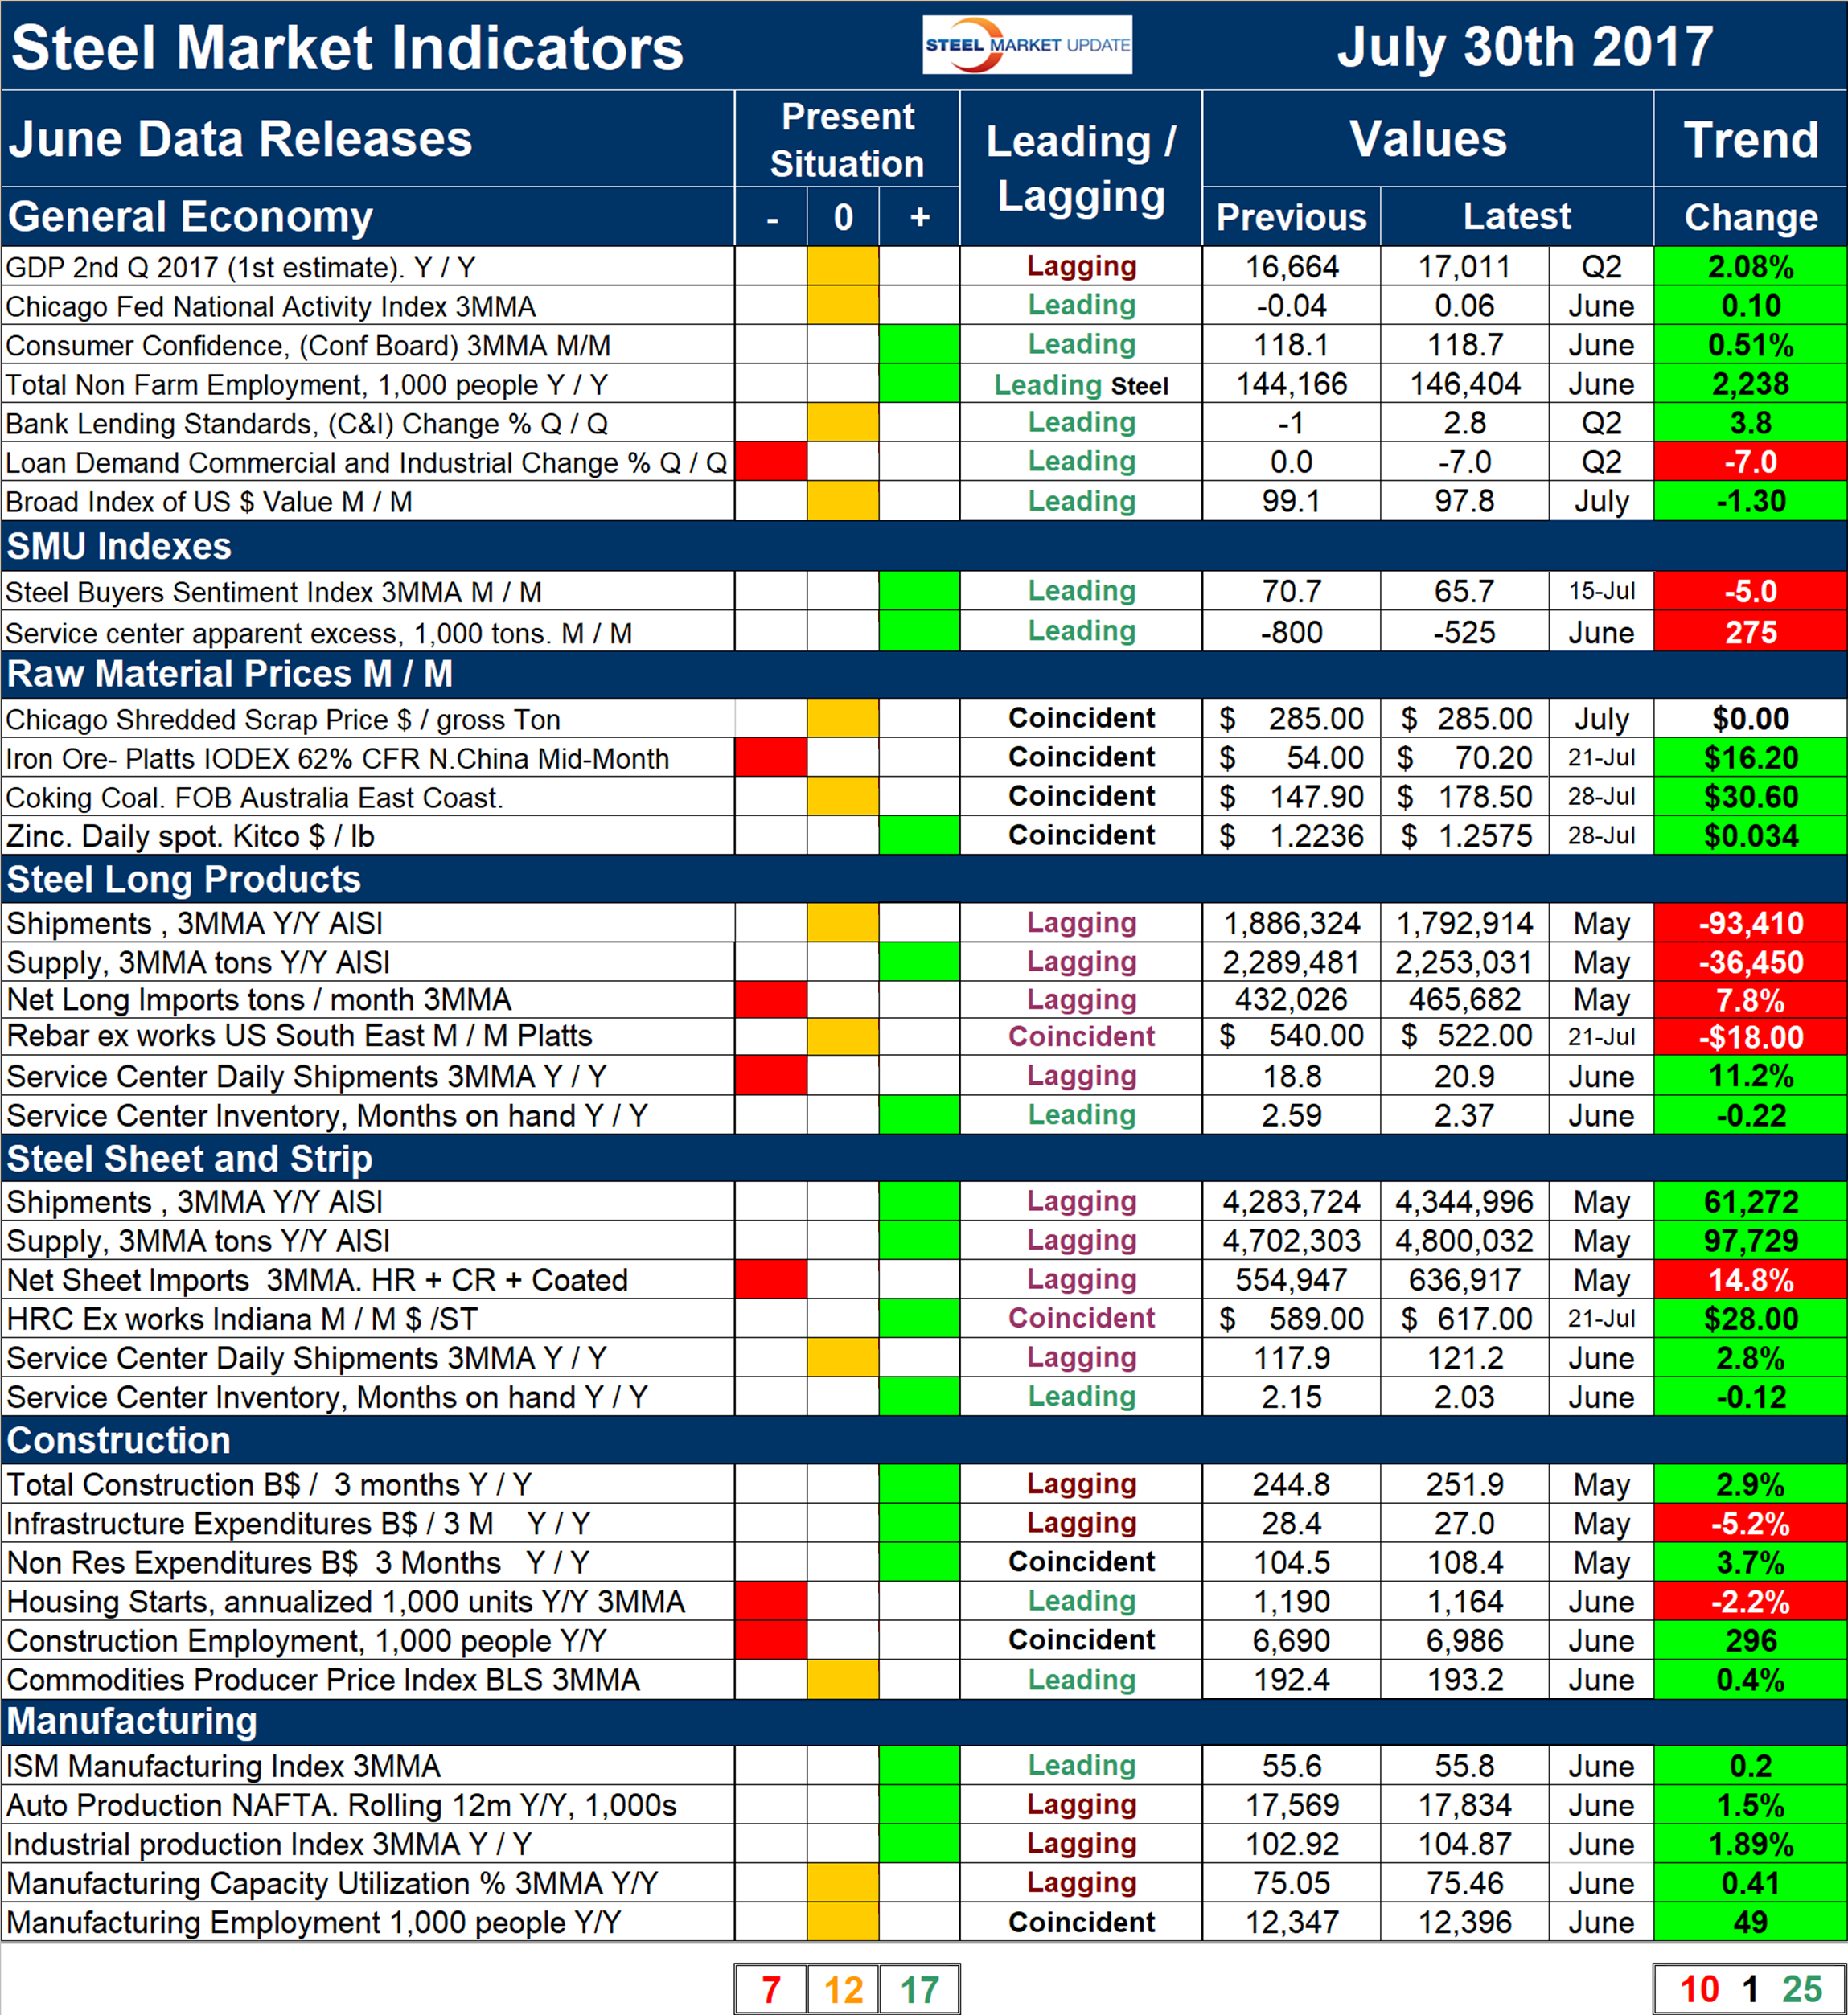
Please refer to Table 1 for the view of the present situation and the quantitative measure of trends. Readers should regard the color codes in the present situation column as a visual summary of the current market condition. The “Trend” columns of Table 1 are also color coded to give a quick visual appreciation of the direction in which the market is headed. All data included in this table was released in July. The month or specific date to which the data refers is shown in the second column from the far right. All data is the latest available as of July 30, 2017.
Present Situation
There was a net decrease of two indicators that we consider to be negative in July and an increase of two neutrals. We currently view 17 of the 36 indicators as positive, 12 as neutral and 7 as negative. Our intent in using the word neutral is to say that this indicator is considered to be in the mid-range of historical data. The changes in the July data releases were as follows: The price of coking coal recovered beyond the negative threshold, which we regard to be $150/MT. Shipments of long products were re-classified from positive to neutral. The supply of sheet products did the reverse and became historically positive. Supply = shipments to domestic locations plus imports and is a proxy for demand. There were no changes in the present situation of either construction or manufacturing.
Figure 1 shows our monthly assessment of the present situation since January 2010 on a percentage basis.
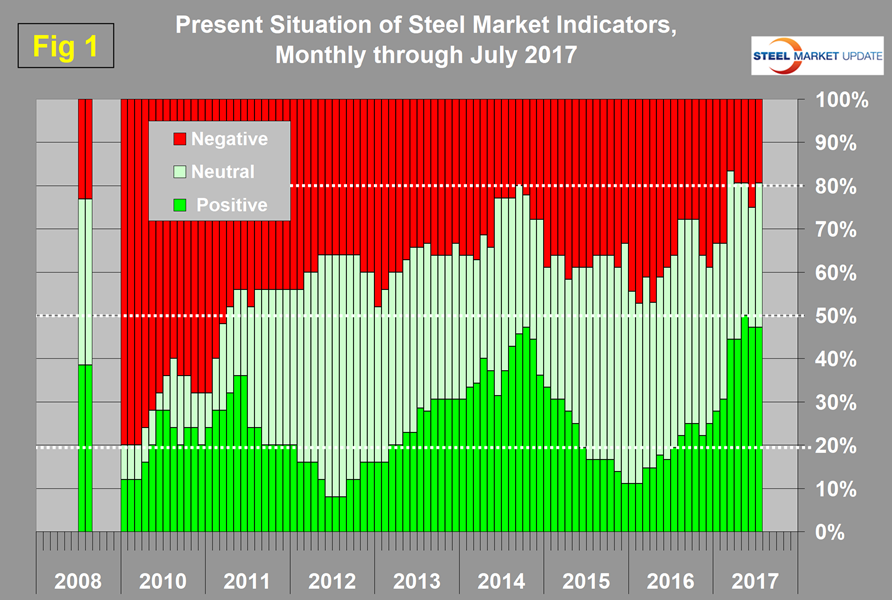
The number of indicators classified as positive peaked at 47.2 percent in October 2014 and steadily declined to 11.1 percent in the three months through January 2016. Beginning in February 2016, there was a steady increase in the number of indicators that we consider to be positive through May 2017 when a new high of 50.0 percent was reached. June declined to 47.2 percent positive and 25.0 percent negative. In July, the positives remained at 47.2 percent, but the negatives declined to 19.4 percent. The combination of positive and neutral indicators at the end of March was the highest ever at 83.3 percent.
Trends
Most values in the trends columns are three-month moving averages to smooth out what can be very erratic monthly data. Trend changes in the individual sectors since the end of June are described below together with some general comments (in most cases this is not July data, but data that was released in July for previous months.)
In the four months October through January, there was a steady improvement in trends. There was a positive surge in February that was sustained in March and April followed by a significant decline in both May and June and a partial recovery in July. Figure 2 shows the trend of the trends and the pre-recession situation at the far left of the chart.
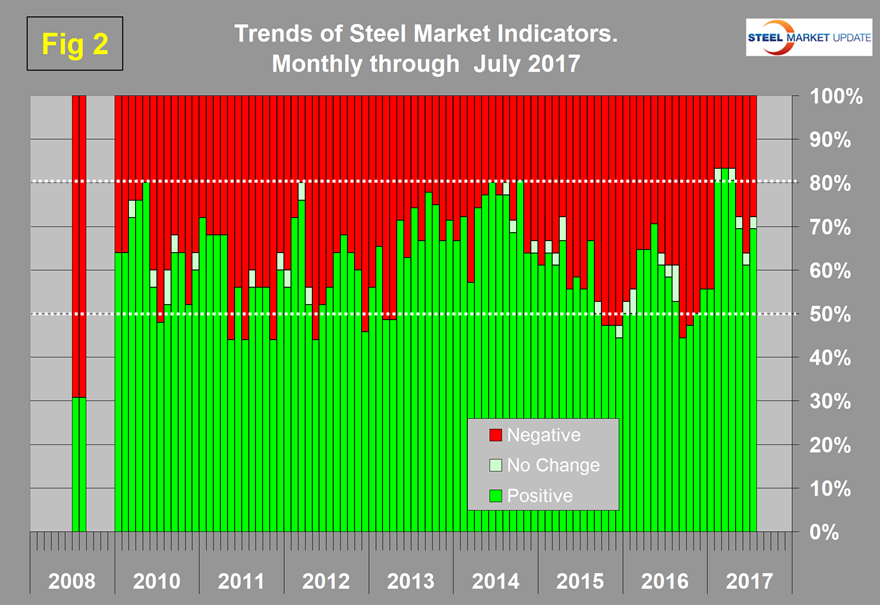
The proportion of indicators trending positive through July 30 was 69.4 percent, the same as May and up from 61.1 percent at the end of June. March, at 83.3 percent, was the best result since our data was first compiled.
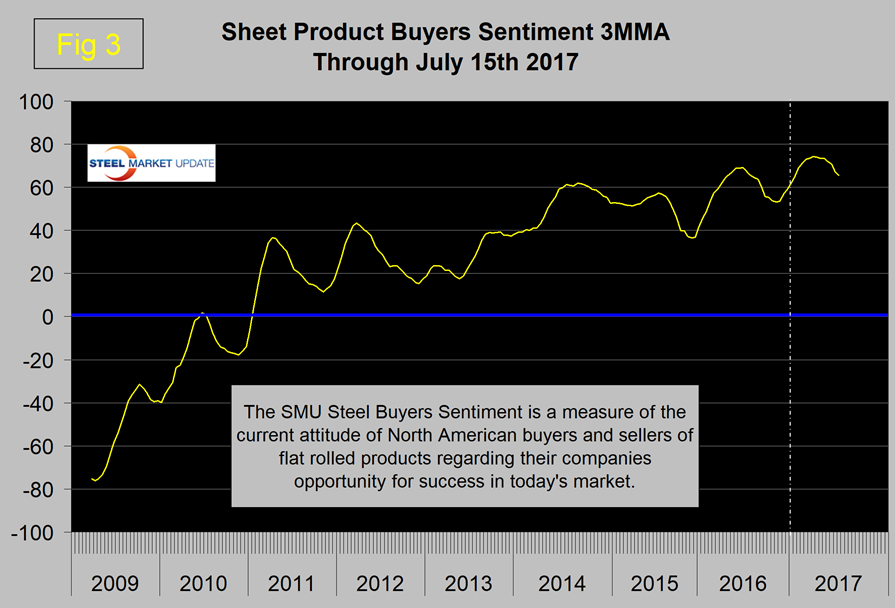
Changes that occurred in the July data were as follows: In the General Economy section, both the Chicago Fed National Activity Index and consumer confidence reversed direction and trended positive. There were no changes in the direction of the trends of the SMU proprietary indexes. Both continued to trend negative, but both have historically high values. The steel buyer’s sentiment has declined slightly from its all-time high in mid-March of 74.17 to 65.67 in mid-July (Figure 3).
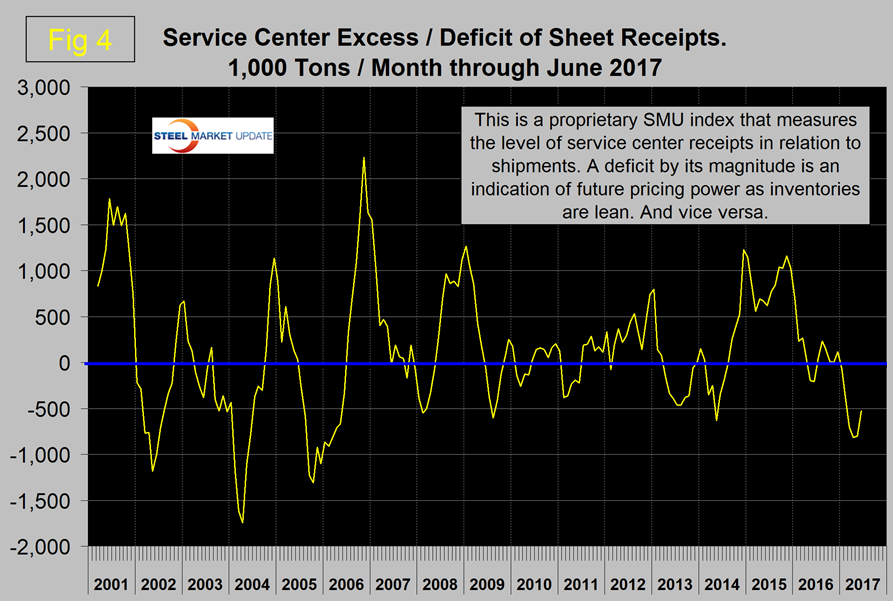
Service center excess of sheet products turned negative in January and became increasingly negative through April before reversing slightly in May and June. This is a proprietary SMU calculation. We regard an inventory deficit to be positive in terms of pricing power; the deficit was 816,000 tons in April, 800,000 tons in May and 532,000 tons in June (Figure 4).
In the raw materials section, the price of Chicago shredded was unchanged in July after declining in June. The prices of iron ore and coking coal reversed direction and trended up. We regard rising raw materials prices as positive and indicative of a strengthening market. The steel long products sector did not fare well in July. Both shipments and supply reversed direction and declined as did the price of rebar ex works U.S. South East. Indicators for sheet products improved from four of six to five of six trending positive. The change was in the price of HRC ex works Indiana. In the construction sector, housing starts declined in June. There were no other trend changes in construction. In the June manufacturing data, all indicators were trending positive. The only change was in the ISM index, which had declined in May but recovered in June.
We believe a continued examination of both the present situation and direction is a valuable tool for corporate business planning.
Explanation: The point of this analysis is to give both a quick visual appreciation of the market situation and a detailed description for those who want to dig deeper. It describes where we are now and the direction in which the market is headed and is designed to describe the market on a specific date. The chart is stacked vertically to separate the primary indicators of the general economy, of proprietary Steel Market Update indices, of raw material prices, of both sheet and long product market indicators, and of construction and manufacturing indicators. The indicators are classified as leading, coincident or lagging as shown in the third column.
Columns in the chart are designed to differentiate between where the market is today and the direction in which it is headed. Our evaluation of the present situation is subjectively based on our opinion of the historical value of each indicator. There is nothing subjective about the trends section, which provides the latest facts available on the date of publication. It is quite possible for the present situation to be predominantly red and trends to be predominantly green or vice versa depending on the overall situation and direction of the market. The present situation is sub-divided into below the historical norm (-) (OK), and above the historical norm (+). The “Values” section of the chart is a quantitative definition of the market’s direction. In most cases values are three-month moving averages to eliminate noise. In cases where seasonality is an issue, the evaluation of market direction is made on a year-over-year comparison to eliminate this effect. Where seasonality is not an issue concurrent periods are compared. The date of the latest data is identified in the third values column. Values will always be current as of the date of publication. Finally, the far-right column quantifies the trend as a percentage or numerical change with color code classification to indicate positive or negative direction.


