Prices

September 14, 2017
Ferrous Futures Under Pressure…Run For the Hills or Buy The Dips?
Written by David Feldstein
The following article on the hot rolled coil (HRC) futures markets was written by David Feldstein. As the Flack Global Metals Director of Risk Management, Dave is an active participant in the hot rolled futures market, and we believe he provides insightful commentary and trading ideas to our readers. Besides writing futures articles for Steel Market Update, Dave produces articles that our readers may find interesting under the heading “The Feldstein” on the Flack Global Metals website, www.FlackGlobalMetals.com. Note that Steel Market Update does not take any positions on HRC or scrap trading and any recommendations made by David Feldstein are his opinions and not those of SMU. We recommend that anyone interested in trading HRC or scrap futures enlist the help of a licensed broker or bank.
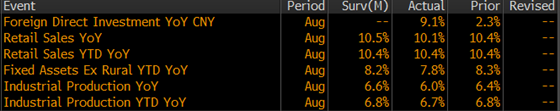
We’ve seen some interesting developments over the past week with some downside pressure on ferrous raw materials and metals prices. Last night’s disappointing Chinese economic data added fuel to the fire.
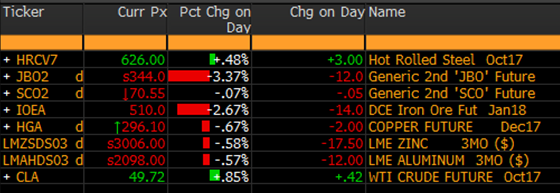
Scrap and iron ore futures were down 3.4 percent and 2.7 percent on the day, while base metals were all down, but not by more than 0.7 percent. Oil had a nice day gaining almost 1 percent and trading above $50/bbl for some of the day.
In spite of the most recent price increase announcement and strong ISM PMI data, CME Midwest HRC futures have moved down from $635 on Aug. 31 to the $620-$625 range as of today. The curve remains flat.
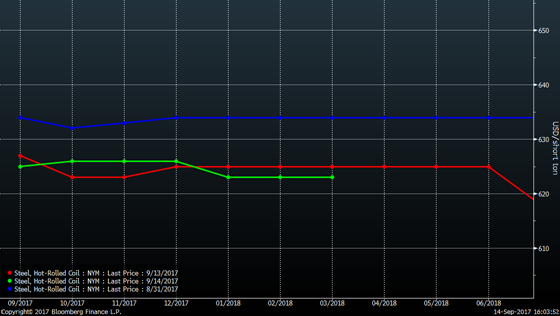
Buy the dips!
– Rallying ferrous raw materials, global finished steel and base metal prices.
– Persistently low flat rolled inventory evidenced in the MSCI, ISM and Durable Goods reports.
– Conditions ripe for distribution and customer restocking.
– A global uptrend in manufacturing purchasing managers indexes.
– A rebounding U.S. energy industry.
– Falling import volumes expected for the remainder of 2017.
– Demand boosted from Hurricanes Harvey and Irma.
This time isn’t different and this rally won’t last forever, but global steel fundamentals look to remain strong. Globally, ferrous raw materials prices, ferrous finished prices and base metals prices have been in rally mode. This gives us some information about supply and demand, as well as the effect of increasing cost curves. The fundamental data has been mostly positive to back up the price moves. The seven “buy the dip” bullet points above remain intact. However, before we start seeing downbeat economic data to tell us the rally is coming to an end, we will first see price erosion. So….

Technical Corner
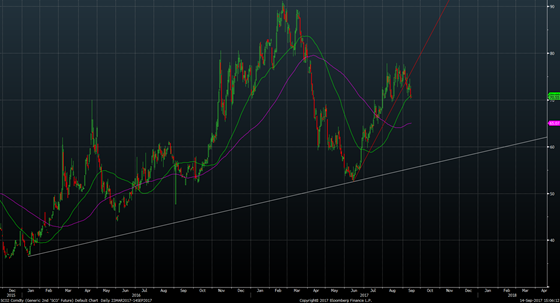
LME Scrap prices have moved down $15 this week, but closed just above a short-term uptrend line, and the long-term trend line remains in place.
2nd Month LME Turkish Scrap Future
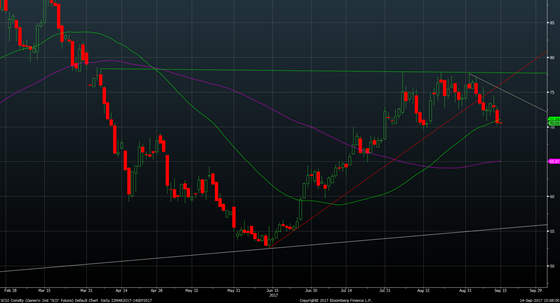
SGX iron ore futures have been under pressure since the beginning of last week and closed below a short-term trend line, but the long-term uptrend remains in place.
2nd Month SGX Iron Ore Future
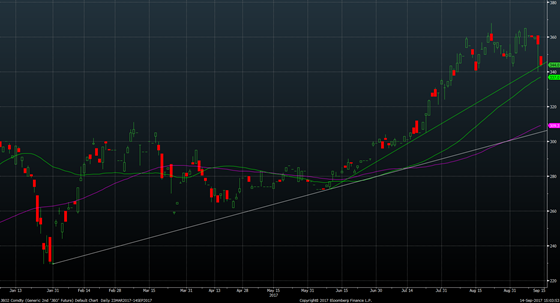
Taking a closer look at the 2nd month SGX iron ore future, we see it failed to break above $78/t after a couple of attempts to break above it. It also closed today below its 50-day moving average. On the other hand, it has formed a nice bullish “cup and handle pattern.” So pay close attention to ore. If it rebounds and breaks above 78, that indicates there is another big leg to the rally coming. However, if the sell-off continues, iron ore technicals start to turn to mush.
2nd Month SGX Iron Ore Future
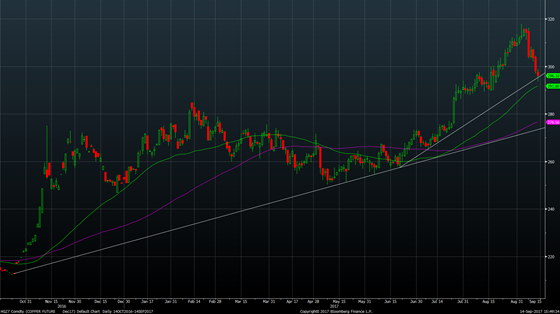
Copper has seen a fantastic rally that exhausted just below $3.20/lb. It has retraced almost 7 percent, but has held its short-term uptrend line, is well above its 50-day M.A. and far above its long-term uptrend.
CME December Copper Future
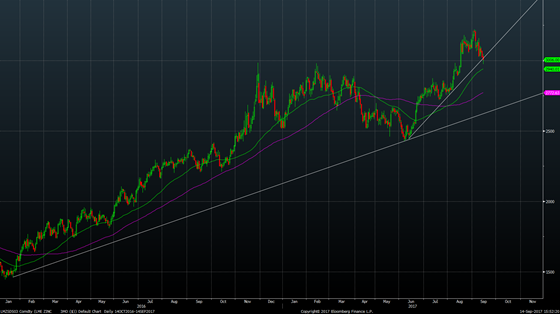
LME zinc is showing a similar pattern to copper, although it closed just below its short-term uptrend line.
3rd Month LME Zinc Future
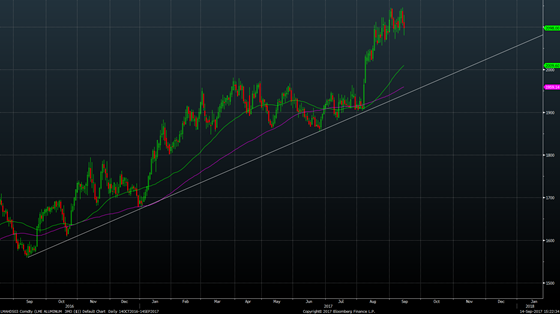
Aluminum looks great.
3rd Month LME Aluminum Future
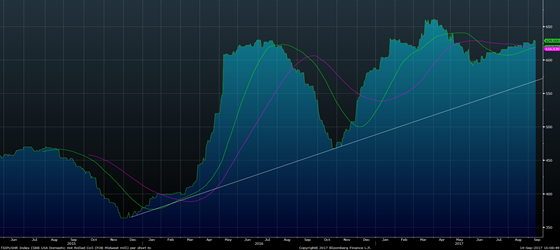
The TSI Midwest HRC Index remains in a solid uptrend, making higher highs and lower lows.
TSI Midwest HRC Index
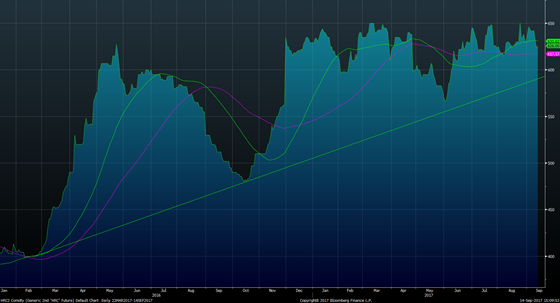
We see the same thing with the 2nd month CME Midwest HRC future as the index. Even though there has been some pressure on HRC futures this week, it can be expected as prices move around the range they’ve been in throughout 2017.
2nd Month CME Midwest HRC Future
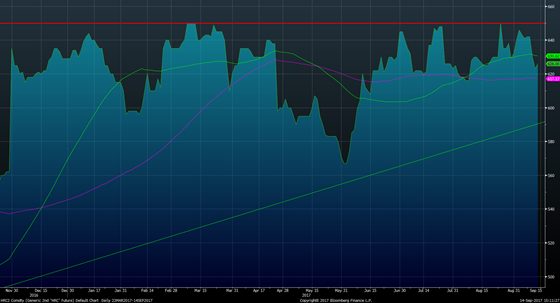
Taking a closer look at the chart, you see there is strong resistance up at $650/st. If prices fall to $600 in the short term and bounce, HRC futures will have formed into a “reverse head and shoulders,” a bullish pattern that could portend a big rally to come if it forms and then breaks above $650.
2nd Month CME Midwest HRC Future
Collectively, while there seems to be some recent price pressure on the group, the uptrends remain unbroken and fundamentals continue to be strong. It’s been quiet out there on the futures front as the world slowly returns from the summer. All in all, variation is expected, but will it turn into a sharp selloff?

Buy The Dips!
One day this strategy will go bad, but until it does, keep doing what works.
The opportunity might present itself in HRC futures at any time, so pay close attention to President Trump’s tweets, keep your local broker on speed dial and remember Ferrous Bueller’s philosophy…
“Life moves pretty fast. If you don’t stop and take a look around once in a while, you could miss it.”