

Market Data

October 3, 2017
Little Change in U.S. Share of Global Scrap Trade
Written by Peter Wright
The United States’ share of the global steel scrap trade has changed little in the two and a half years through second-quarter 2017. Steel Market Update performs this analysis quarterly to understand the gyrations of the domestic scrap market and where the U.S. stands as a global player. This data is not very current because some nations are slow to report, but we still believe it gives a valuable perspective on global trends and is the foundation of where we are today.
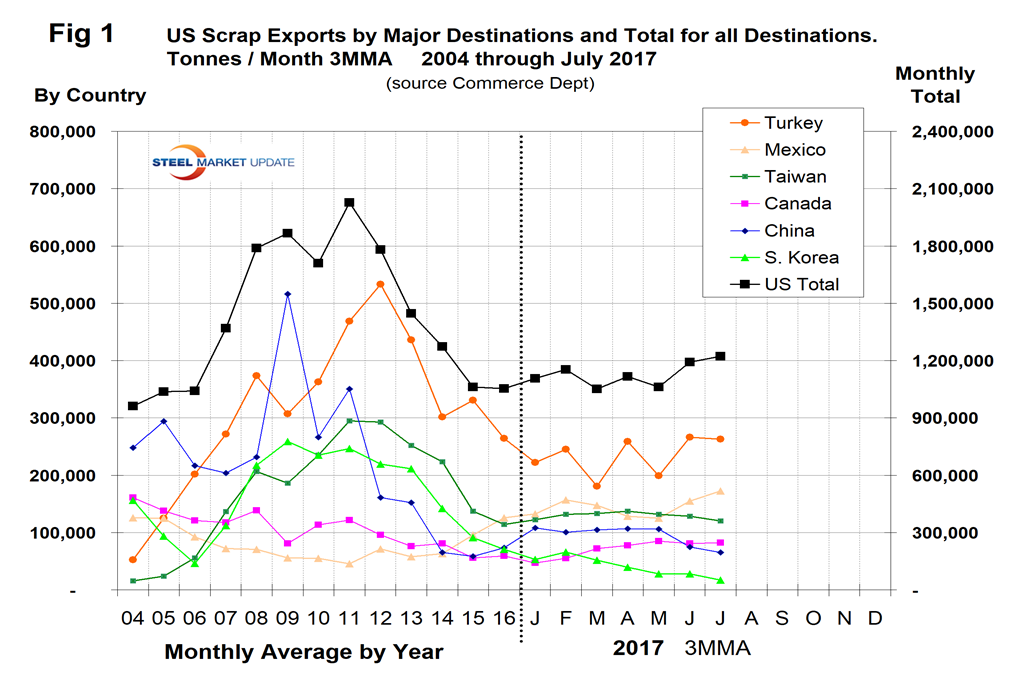
![]() To set the scene, Figure 1 shows total scrap exports from the U.S. as reported by the Department of Commerce on the right axis together with the major destinations reported on the left axis. It shows the monthly average for the years 2004 through 2016 and the three-month moving average for January through July 2017. Year to date through July, U.S. scrap exports are up by 19.7 percent from the same period in 2016. The increase compared to 2015 is similar, and 2017 is approaching the rate for 2014. Exports are well down from the rate experienced in the years 2008 through 2013.
To set the scene, Figure 1 shows total scrap exports from the U.S. as reported by the Department of Commerce on the right axis together with the major destinations reported on the left axis. It shows the monthly average for the years 2004 through 2016 and the three-month moving average for January through July 2017. Year to date through July, U.S. scrap exports are up by 19.7 percent from the same period in 2016. The increase compared to 2015 is similar, and 2017 is approaching the rate for 2014. Exports are well down from the rate experienced in the years 2008 through 2013.
In our analysis of global scrap trade, we have excluded scrap that moved within the EU from the global total. Figure 2 shows the total tonnage of global trade since Q1 2000 and the volume of the top five suppliers: the U.S., the EU, the UK, Japan and Russia. These five accounted for 63.7 percent of the total in Q2 2017. The total tonnage of ferrous scrap traded between nations in Q1 2016 was the lowest since the recession, but bounced back in the latest five quarters. However, there has been a declining trend since 2011.
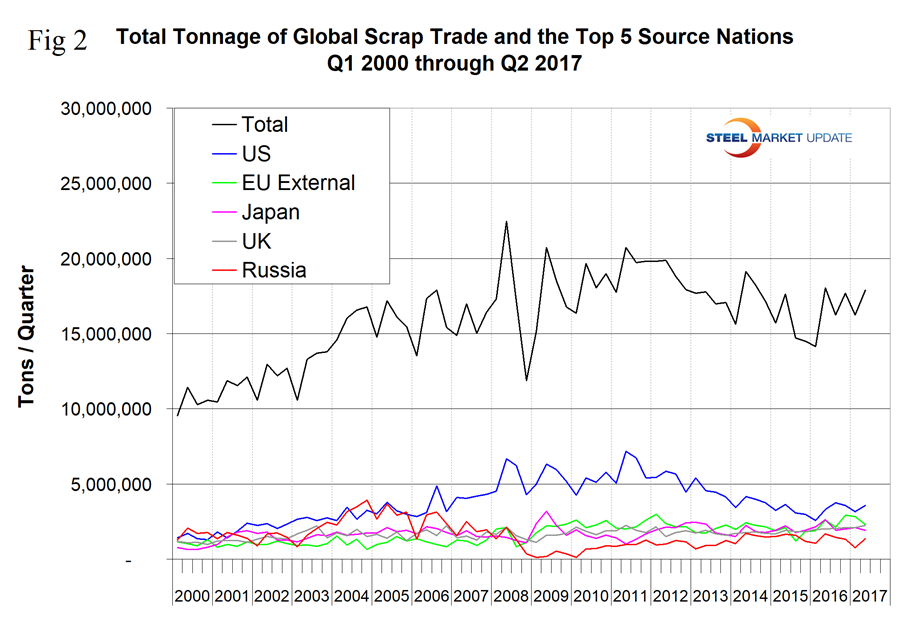
Figure 3 is the same graph with the total removed to better illustrate the volume of the five major players. The U.S. is still the biggest player on a tonnage basis, but the EU has been closing the gap since Q3 2015.
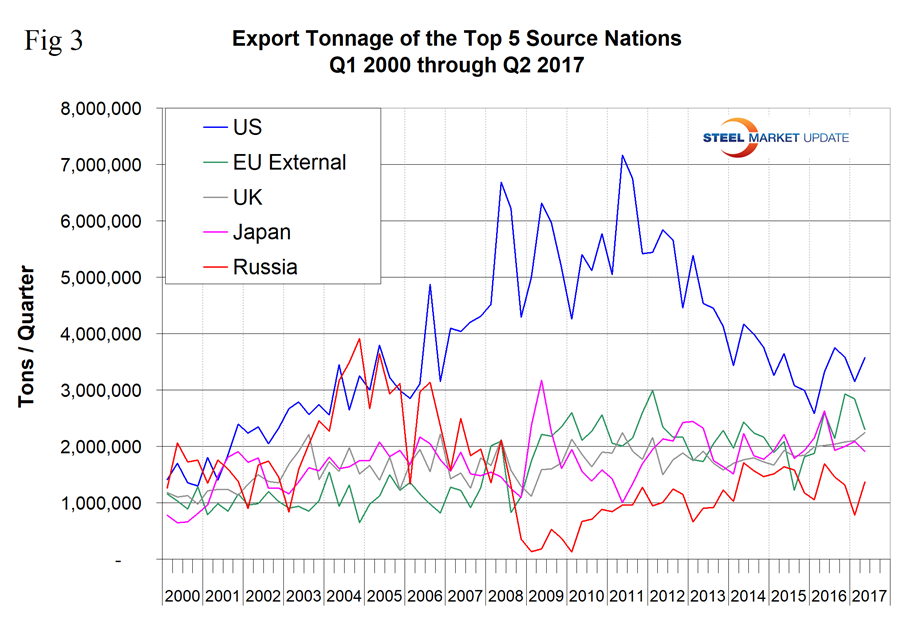
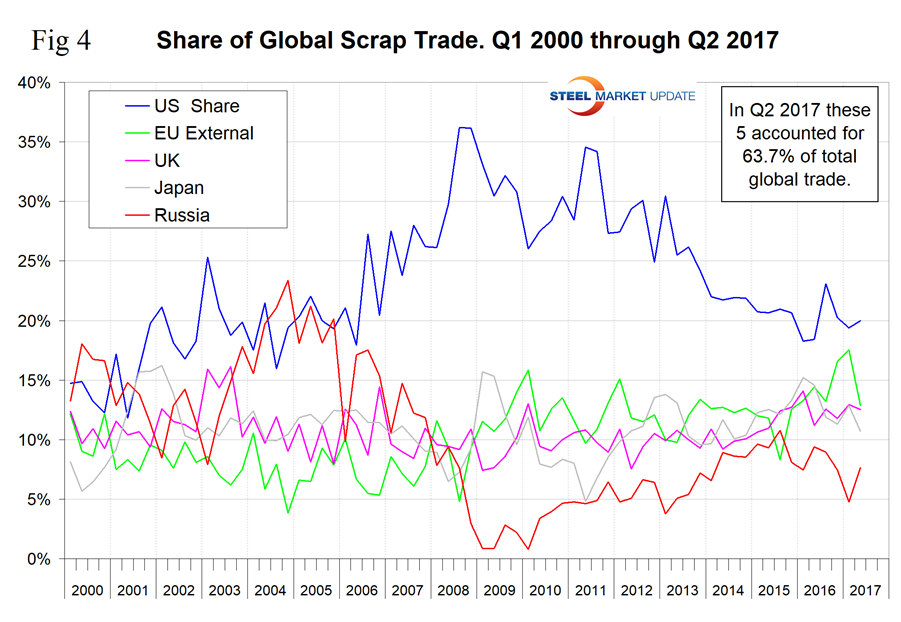
Figure 4 shows the market share of the top five sources. The U.S. share peaked at 36.2 percent in the third and fourth quarters of 2008 and has declined to 20.0 percent by Q2 2017. We attribute the long-term decline in the U.S. share to both a decline in actual global commerce and the strengthening of the U.S. dollar. The dollar strengthened from 2011 through Q4 2016. We can expect the weakening of the dollar in 2017 to lead to an increase in U.S. scrap exports in future quarters. The EU’s share increased to 17.5 percent in Q1 2017 and declined to 12.9 percent in the latest data.
There is somewhat of a relationship between the U.S. global share and the U.S. domestic scrap price. The result is shown in Figure 5 with a correlation of 65.9 percent. The fact that our export share increases as our domestic price increases might seem backwards at first glance. However, scrap is a global commodity and this would seem to reflect the effect of exports on the domestic price.
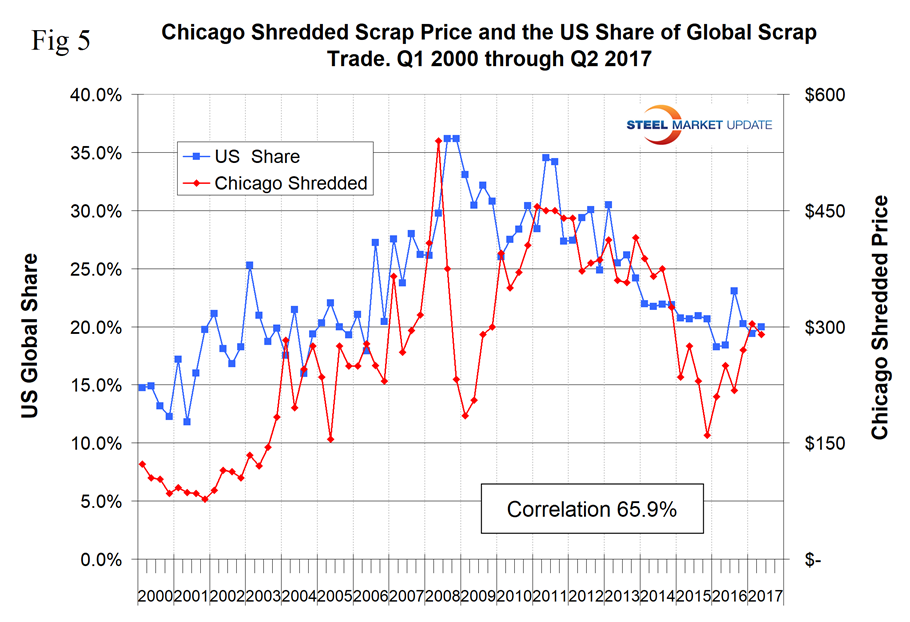
Figure 6 shows the tonnage received by the four major importing nations. Turkey is by far the largest global scrap buyer with a tonnage totaling more than the other three combined.
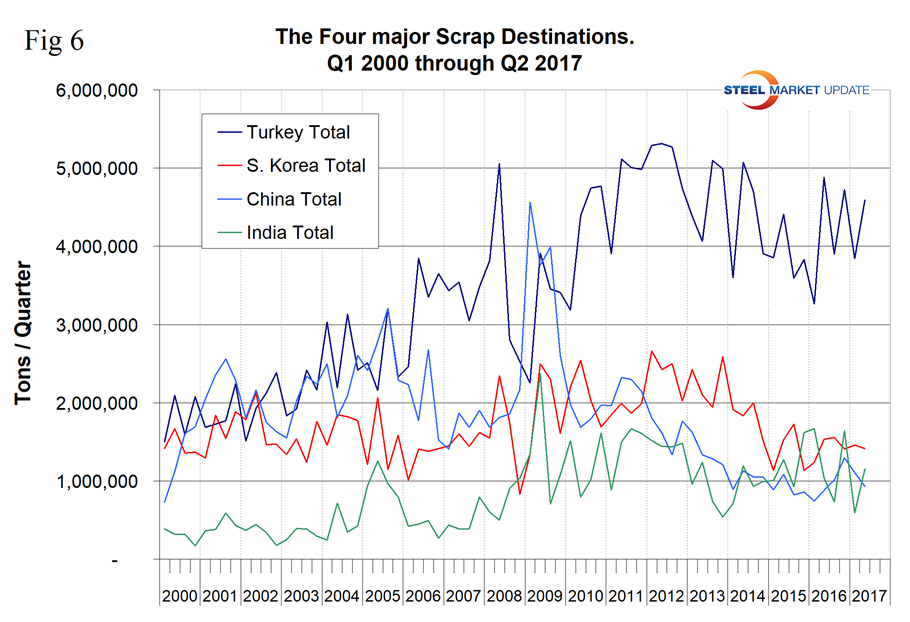
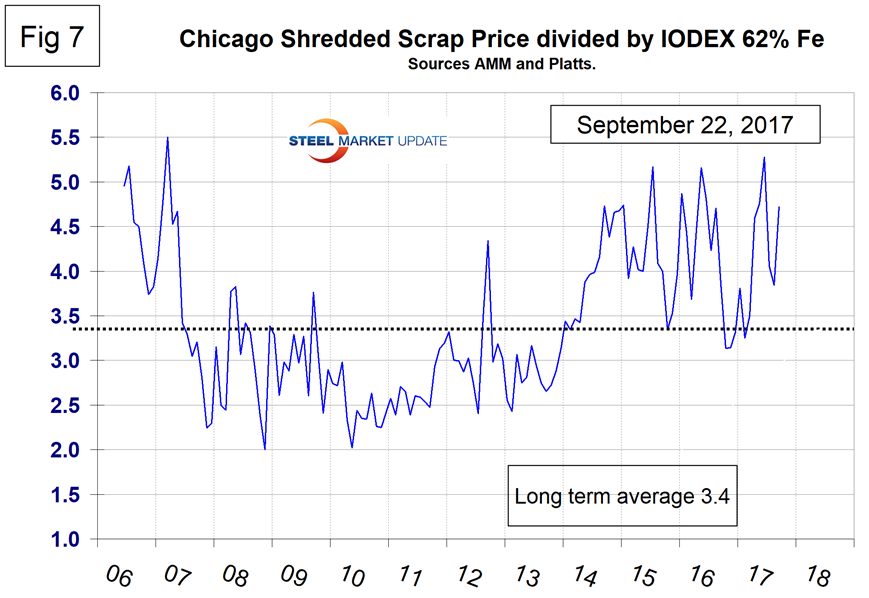
Since Q1 2015, Turkey’s share has ranged from 27 percent to 22.8 percent and was 25.6 percent in Q2 2017. China’s scrap imports have been consistent in the last three and a half years, but in Q2 2017 its exports surged from virtually zero to 279,000 tons. This is still a small volume. We expect China to totally disrupt the global scrap market before the end of this decade as the massive consumption of steel within China begins to be recycled. China’s steel production is 93 percent BOF, and its mills have recently shut most or all of their induction furnace capacity due to pollution problems. In the long run, China will reduce its dependence on iron ore in preference for scrap, but considering its already huge surplus in capacity, new investments in EAFs are likely to be slow. Turkey’s import tonnage declined in 2014 and 2015 and recovered in the last five quarters. Part of the reason for these gyrations was the purchase of semifinished billets and slabs, much of them from China. When the price of scrap is high relative to the price of iron ore as it is today, Chinese semifinished has a lower cost landed Turkey than the Turkish EAF mills can produce for themselves. The price ratio of scrap to ore has a long-term average of 3.4, but in September 2017 was 4.72, as shown in Figure 7.
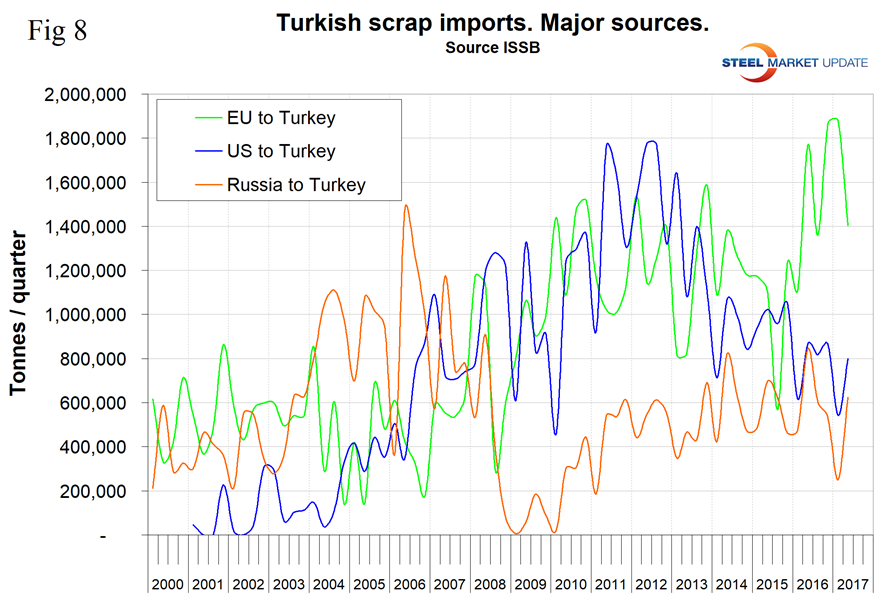
In the period 2010 through 2013, Turkey purchased a similar tonnage from the U.S. as it did from the EU, but as the euro declined in U.S. dollar terms, EU scrap become more attractive, and in 2017 European shipments to Turkey surged to over double the U.S. tonnage, as seen in Figure 8.
SMU Comment: We see three out of five trends in this analysis putting upward pressure on U.S. domestic scrap prices in 2017. We also see a huge disruption of the global scrap market on the horizon:
1) Global scrap trade has increased from a recent low point in Q1 2016.
2) U.S. global share has been declining for five years with a partial recovery in the last four quarters.
3) China is not yet a player as a global scrap exporter, but we have to believe that a dramatic change is near at hand as the massive consumption of steel in China is increasingly recycled to obsolete scrap.
4) For much of the last four years, including today, the price ratio of iron ore to scrap has made semifinished out of China attractive compared to scrap.
5) The U.S. dollar has been weakening is 2017, and it looks as though the global scrap market has been slow to take advantage of this change. Scrap exports have increased by 19.7 percent year to date though July.


