

Market Data

October 15, 2017
Demand for Steel Sheet Continues to Expand
Written by Peter Wright
Demand for steel sheet products continued to expand through August. This report summarizes total steel supply by product from 2003 through August 2017 and year-on-year changes. It then compares domestic mill shipments with total supply to the market. It quantifies market direction by product and enables a side-by-side comparison of the degree to which imports have absorbed demand. Sources are the American Iron and Steel Institute and the Department of Commerce with analysis by Steel Market Update.
Apparent supply is a proxy for market demand. Demand momentum for sheet products in total was positive in three months through August, but individual products varied. Cold rolled, HDG and electrogalvanized were positive. Hot rolled was slightly negative and other metallic coated (mainly Galvalume), which continued to have very strong growth, slowed.
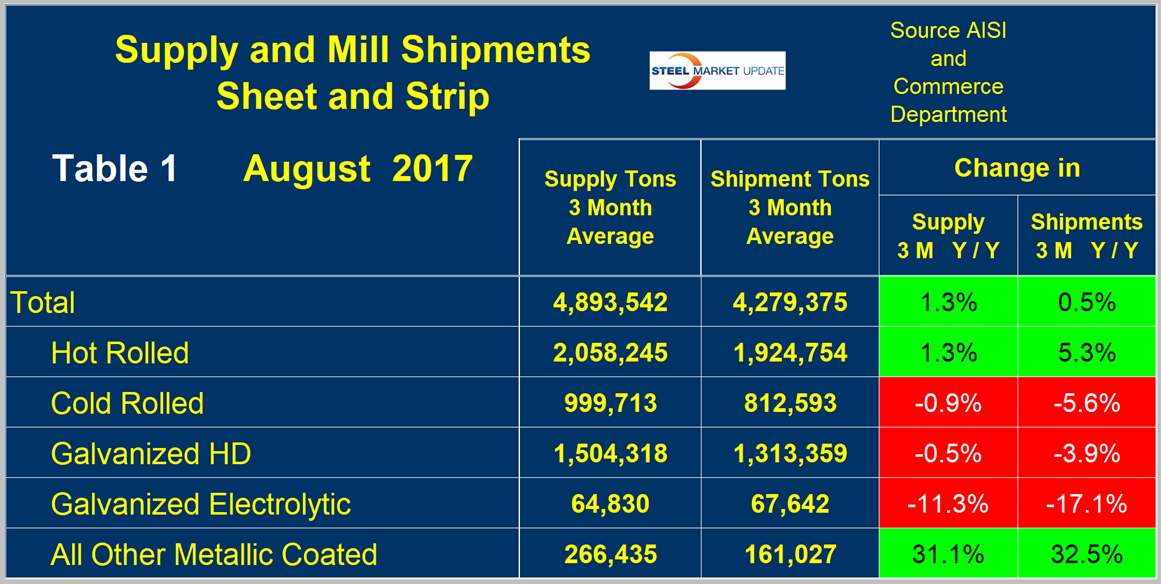
Table 1 describes both apparent supply and mill shipments of sheet products (shipments includes exports) side by side as three-month averages through August with year-over-year growth rates for each. Comparing these two time periods, total supply to the market was up by 1.3 percent, but mill shipments were up by only 0.5 percent. These were almost the same results as in three months through July. The fact that supply was up by more than mill shipments means that imports were more of a factor in the market compared to the same three months last year. Table 1 breaks down the total into product detail and shows that hot rolled and other metallic coated made up some ground against imports. For the other products, the domestic mills lost share. A review of supply and shipments separately for individual sheet products is given below.
Apparent Supply
Apparent supply is defined as domestic mill shipments to domestic locations plus imports. In the three months through August 2017, the average monthly supply of sheet and strip was 4.894 million tons, up by 2.7 percent year to date and by 1.9 percent in three months through August compared to three months through May. In three months through August year over year, supply was up by 1.3 percent. The short-term increase (3 months) compared to the long-term improvement (12 months) means that through August momentum was positive. There is no seasonal manipulation of any of these numbers. By definition, year-on-year comparisons have seasonality removed, but 3m/3m comparisons do not. Table 2 shows the change in supply by product on this basis through August.
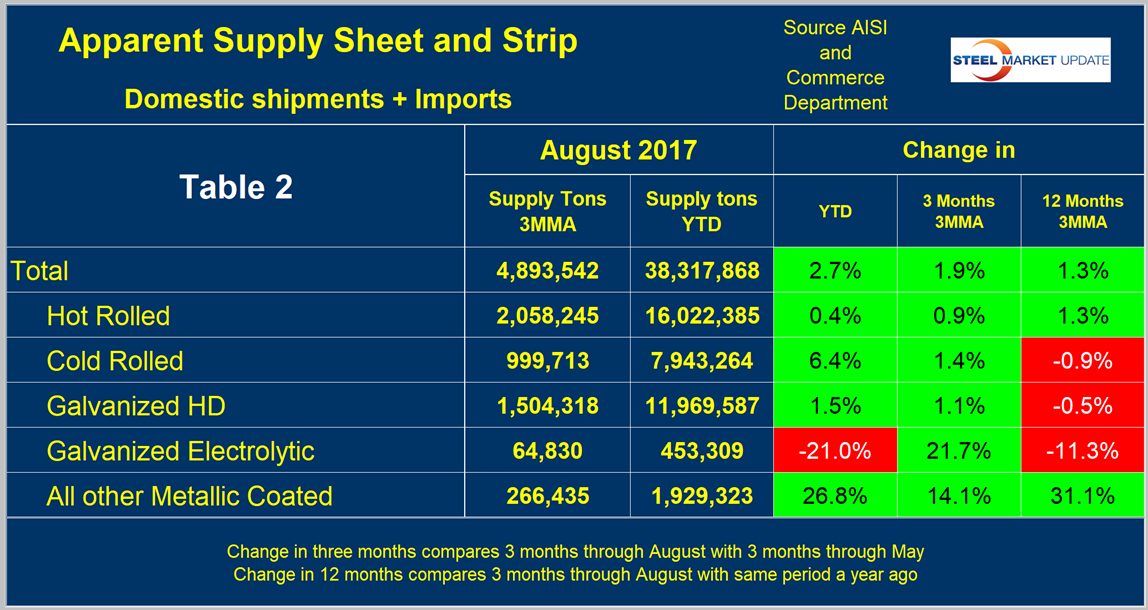
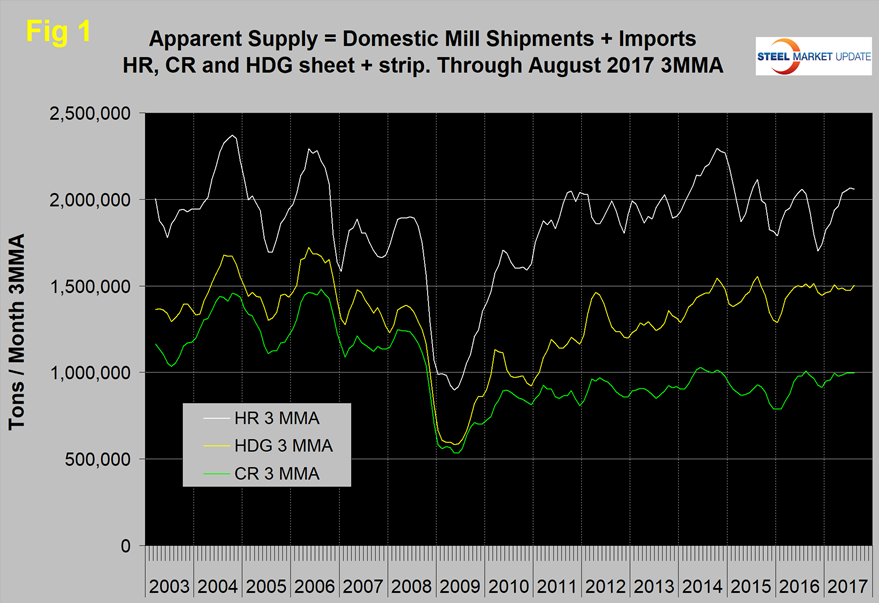
Figure 1 shows the long-term supply picture for the three major sheet and strip products, HRC, CRC and HDG, since January 2003 as three-month moving averages. HRC has recovered well this year, but all three are back approximately to where they were at this time last year.
Mill Shipments
Table 3 shows that total shipments of sheet and strip products including hot rolled, cold rolled and all coated products were up by 2.3 percent year to date, down by 1.5 percent in three months through August compared to three months through May, and up by 0.5 percent year over year. This means that mill shipment momentum for sheet products as a whole was negative. Electrogalvanized had a sharp recovery in the last three months and other metallic coated did the reverse.
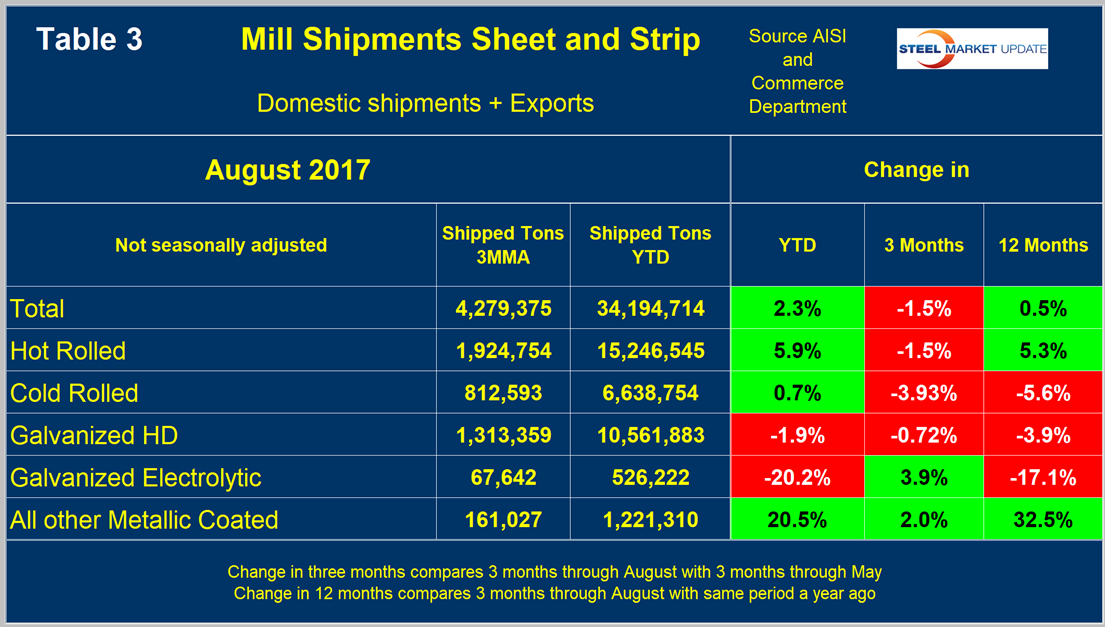
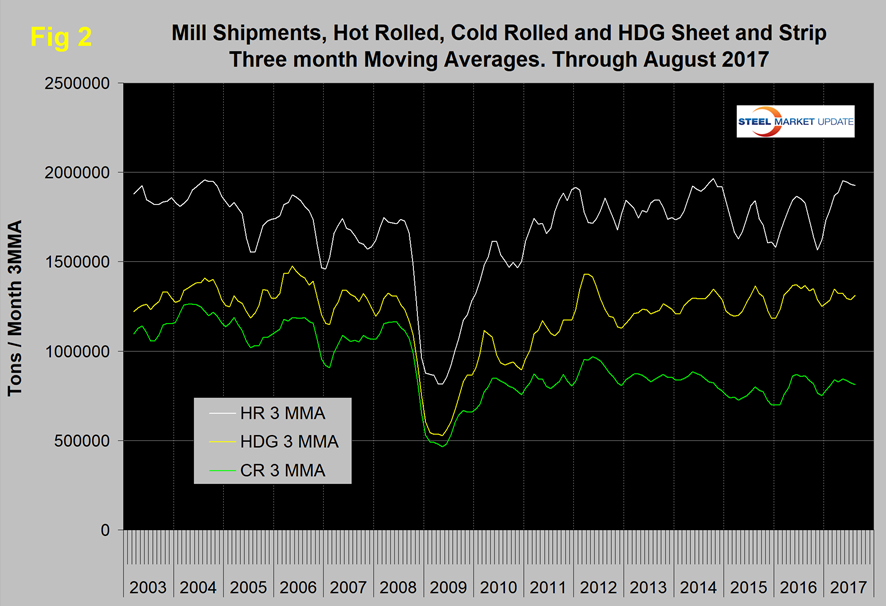
Figure 2 puts the shipment results for the three main products into the long-term context since January 2003. Shipments of hot rolled are at a three-year high, but cold rolled and HDG have made no progress.
SMU Comment: A problem with this data is that it’s now well into October and the latest information we have for shipments and supply is for August. The AISI puts out weekly data for crude steel production, the latest for which was the week ending Oct. 7. This provides the most current data for steel mill activity. Figure 3 shows the year-on-year change in weekly crude output on a four-week moving average basis.
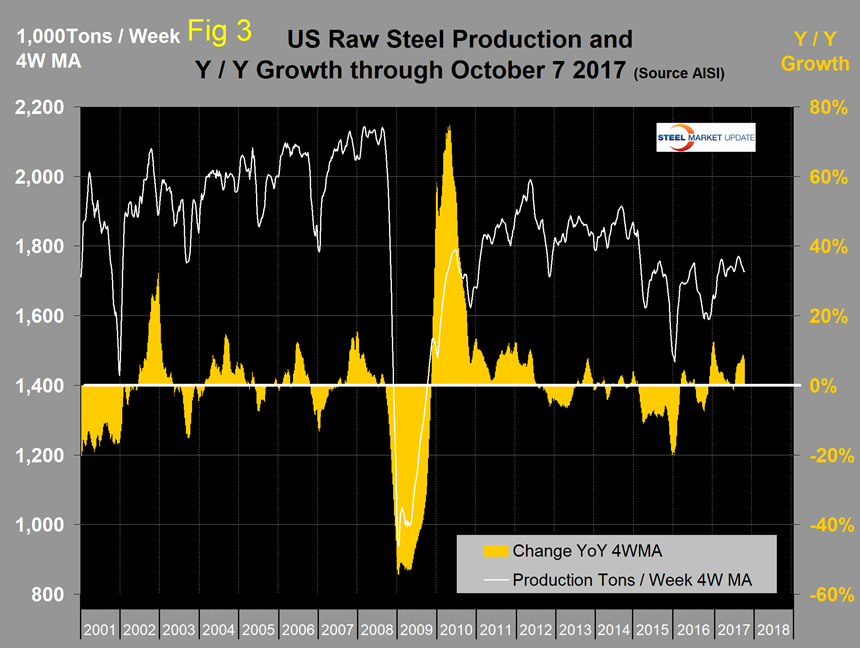
Growth became positive year-on-year in the week ending Aug. 15 and has been increasingly positive since then, ranging between 7.3 percent and 8.8 percent in the last five weeks of data. Imports in June, July and August showed a surge in sheet products when volume exceeded a million tons per month for the first time since September 2015. Licensed volume in September fell back to 983,000 tons. Based on the strength of the economic indicators analysis that SMU performs and our proprietary measure of buyer sentiment, we are expecting demand for sheet products to continue to increase through the balance of the year.


