

Prices

August 22, 2019
Hot Rolled Futures: HRC Futures Roll Over; Bear Market Continues
Written by David Feldstein
The following article discussing the global ferrous derivatives markets was written by David Feldstein. As an independent steel market analyst, advisor and trader, we believe he provides insightful commentary and trading ideas to our readers. Note that Steel Market Update does not take any positions on HRC or scrap trading, and any recommendations or comments made by David Feldstein are his opinions and not those of SMU or the CRU Group. We recommend that anyone interested in trading steel futures enlist the help of a licensed broker or bank.
The following intro is from the Aug. 1 SMU article, “Bear Market Rally Losing Steam and Approaching Resistance”…
Keep doing what’s been working until it stops working. “Get back in there and sell, sell, sell!!!” targeting the yellow area in the chart below ($615 to $635 or better). If you are long steel, it’s time to start working on your hedge for the balance of 2019 ideally targeting sale in the months of October through January. Barring material curtailment to supply, whether planned or unplanned, it looks all but certain that a test of the price low made in June is coming.
Rolling 2nd Month CME Midwest HRC Future
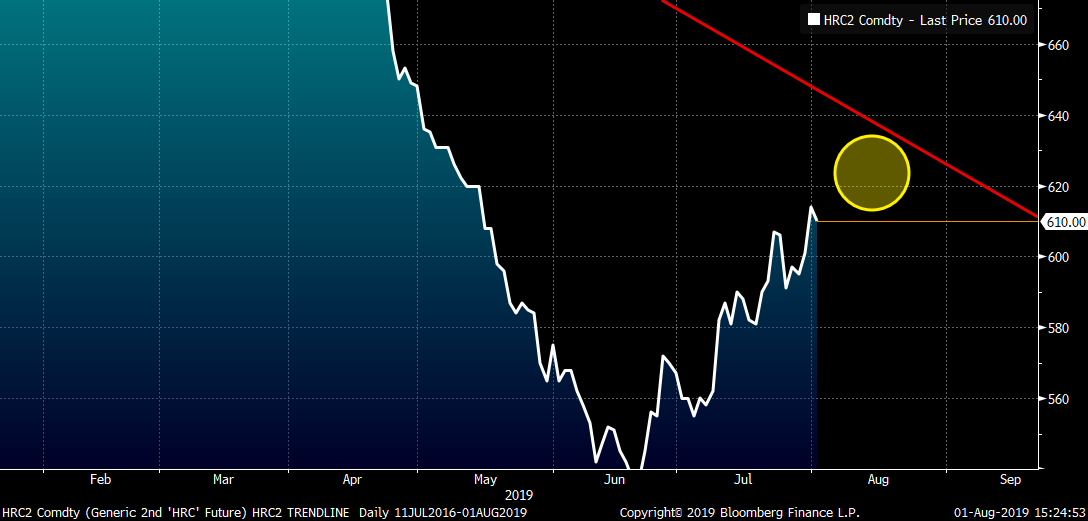
CME HRC futures held on for about seven business days (8/2-8/12) after that article, but only 1,220 tons traded at or above $615 during a very slow summer period. The sell-off began on Aug. 13 culminating on Tuesday of this week when 35,500 total tons traded on the day. Sellers got very aggressive selling 19,280 tons of Q4, which settled $15-19/st lower on the day. About 6,240 tons were traded in Q1, which also saw a double-digit drop on the day. I inquired with HRC voice broker Andre Marshall of Crunch Risk regarding which firms were involved in these trades, but apparently Crunch Risk prides itself on customer anonymity. Doing his best impression of Sergeant Schultz from Hogan Heroes, Andre told me, “I know nothing!” I’ll try him again around 9:30 p.m. next Tuesday night at Champions in the Marriott Atlanta Airport Hotel. I hope to see you there, too!
Rolling 2nd Month CME Midwest HRC Future
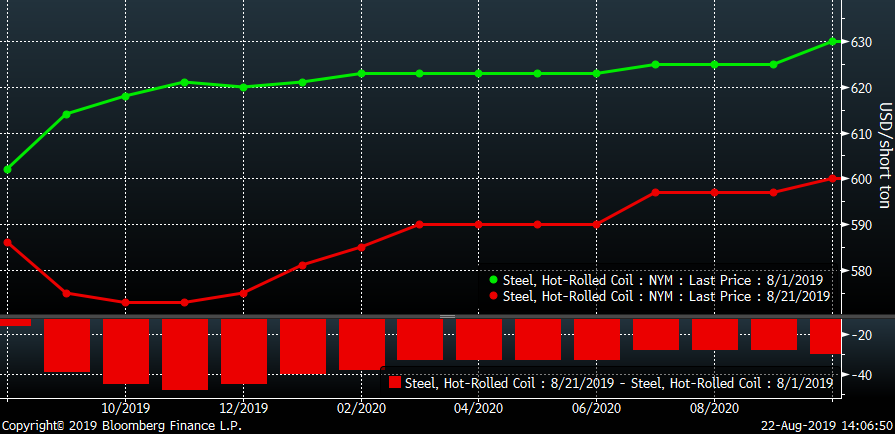
The chart below shows the settlement price of the CME HRC futures curve on Aug. 1 and Aug. 21. The months of October to January have dropped by at least $40/st since then.
CME Midwest HRC Futures Curve
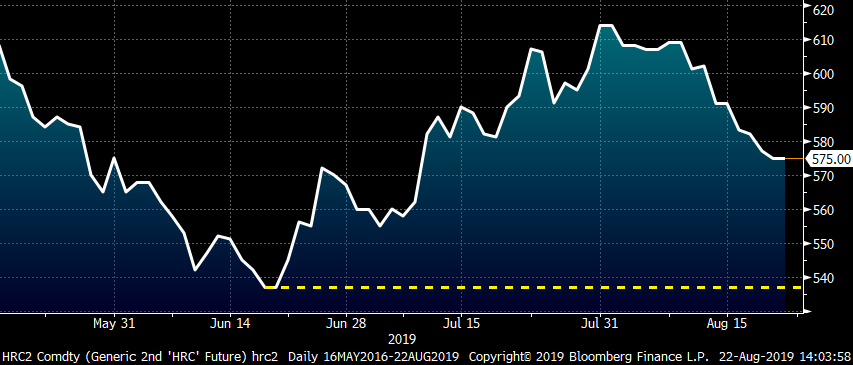
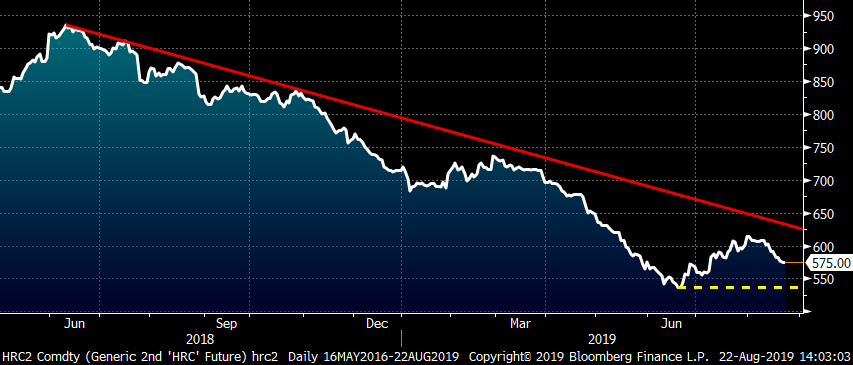
The bear market rally has rolled over and it looks like Midwest HRC is destined to retest the $535/st lows seen in June.
Rolling 2nd Month CME Midwest HRC Future
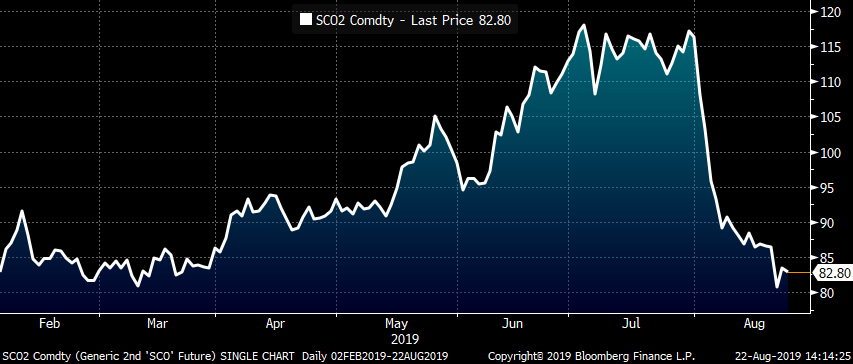
Developments in global prices, raw materials and financial markets continue to worsen, adding further downward pressure to pricing. Iron ore prices have crashed, falling almost 30 percent since the beginning of August.
Rolling 2nd Month SGX Iron Ore Future
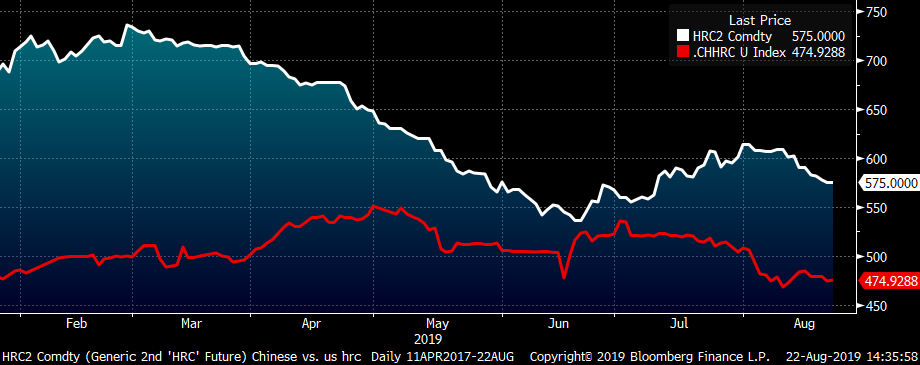
Chinese HRC prices have been falling for almost two months and both Midwest and Chinese prices are now falling in tandem.
Rolling 2nd Month CME Midwest HRC future $/st vs. SHFE Chinese HRC Future $/st
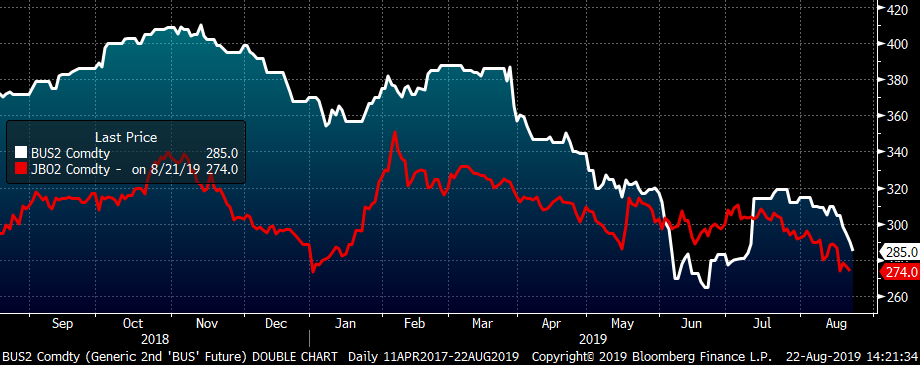
The 2nd month LME Turkish scrap future settled today at its lowest level of the year, while busheling has been falling sharply along with Midwest HRC.
2nd Month CME Busheling Futures (white) & 2nd Month LME Turkish Scrap (red)
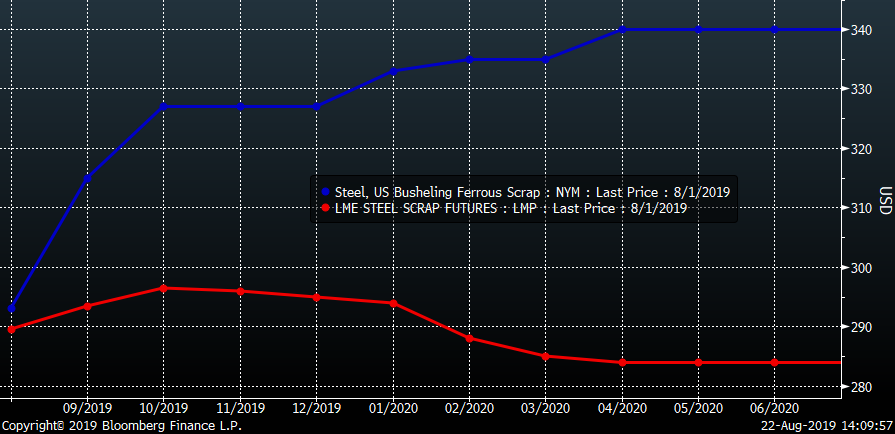
The differential between busheling and Turkish scrap futures has reverted to a more normal level. You can see both products’ futures curves out to June 2020.
CME Busheling Futures (blue) & 2nd Month LME Turkish Scrap (red) Futures Curves
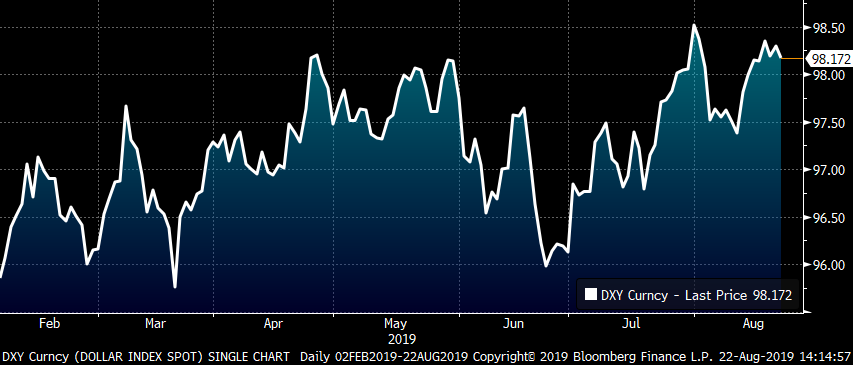
At 98, the dollar index remains near multi-year highs, adding pricing pressure to commodities in general.
U.S. Dollar Index
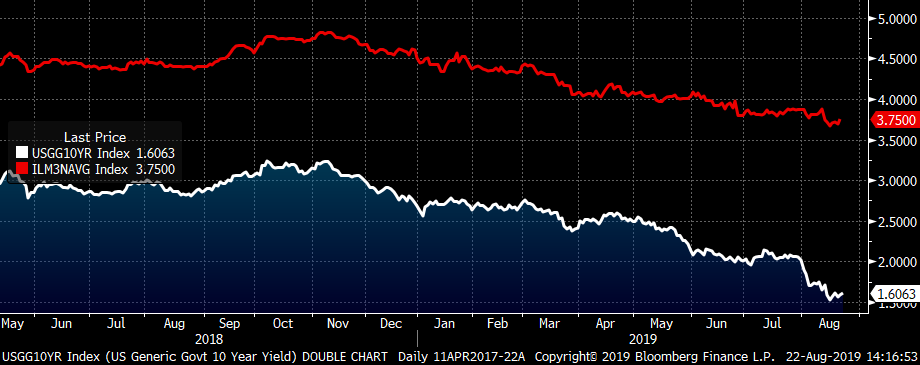
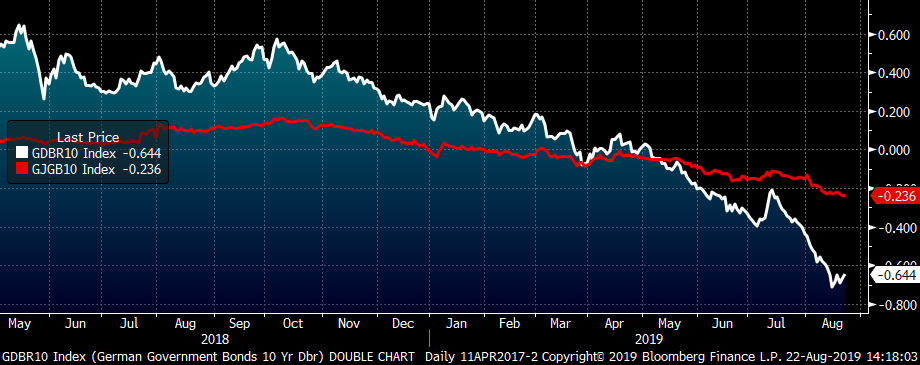
Then there is the issue of interest rates. The German and Japanese 10-year government treasury rates are negative, while the U.S rate has fallen to 1.6 percent, near all-time lows. This is an extremely deflationary global development on the one hand. On the other hand, the 30-year mortgage rate has fallen over 100 basis points, which will spur demand for residential housing, a sector that slowed dramatically after mortgage rates rallied sharply to above 4.8 percent. Moreover, the sharp drop in rates allows consumer and commercial refinancing, a material decrease in interest expense and decreases the costs of long-term fixed investment and other financial transactions. Hopefully, there is a silver lining in all of this chaos.
U.S. Ten Year Treasury Rate & Bankrate.com Avg. 30 Year Mortgage Rate
German (white) and Japanese (red) Ten Year Treasury Rate
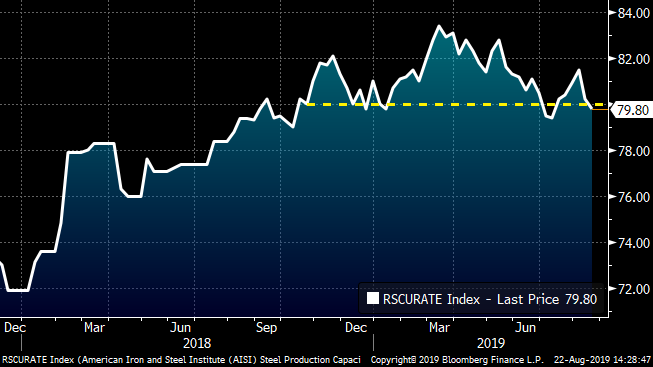
Last week’s AISI steel capacity utilization rate fell below 80 percent. However, you can see the rate remained above 80 percent for almost every week going back to September of last year.
AISI U.S. Steel Capacity Utilization Rate
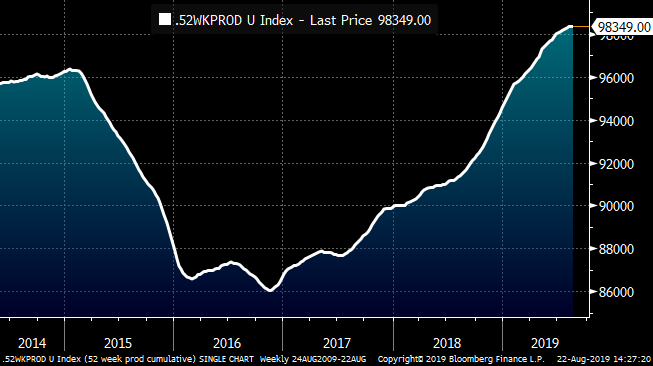
The chart below shows a moving sum of 52 weeks’ crude steel production data to illustrate that the overproduction and oversupply of steel in the Midwest and U.S. is a chronic problem. In other words, there likely isn’t a quick and easy resolution to the issue. It will take a serious and sustained shift lower in production and/or a sharp sustained spike in demand to work through all this accumulated supply and its effect on the industry.
AISI U.S. Crude Steel Production 52-Week Moving Sum
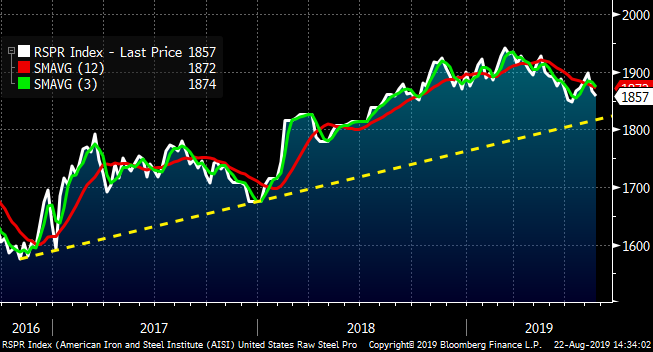
Let’s get technical: Looking at AISI production, the three-week moving average remains above the 12-week, but it looks like it will move back below it in coming weeks. A material move lower in production is necessary for any rally to sustain itself. I am looking for production to break below the yellow uptrend, but remain skeptical considering all of the capacity set to come online.
AISI U.S. Crude Steel Production
Last week, Steel Market Update reached out to me to comment on U.S. Steel’s pricing announcement and how it would affect CME HRC futures. Some of my initial comments were included in the Final Thoughts section of the Aug. 12 issue. However, after marinating on it a bit, a couple of questions and ideas came to mind.
Perhaps U.S. Steel’s customers have been requesting fixed deals to better manage their business following the insane pricing volatility in flat rolled prices since January 2018. Perhaps U.S. Steel surveyed a cross section of customers or garnered support for this type of pricing mechanism from a group of customers prior to choosing to make this change and the announcement. In other words, maybe this is more complex than it seems.
Regardless, there is no doubt that there is growing demand in the industry for fixed deals and there are more firms that have executed a fixed deal via the futures markets today than ever before. Firms across the industry are looking for answers to the problems caused by the volatility of 2018 and this goes for producers, distributors, OEMs, financiers and service providers (like credit insurers). Considering the answer to the volatility of 2018 was fixed pricing and this combined with the increased awareness, education, experience and acceptance of fixed deals bolsters this assumption. My hope is that the network effect (the more people that use a product leads to exponential growth in the use of that product i.e. telephone, Microsoft) has taken hold in physical fixed priced deals and this will translate into significant growth in transactions, volume, open interest and liquidity in ferrous futures markets.
U.S. Steel’s announcement could be a watershed moment for HRC futures because it not only indicates growing interest by the industry to shift more transactions to a fixed price from a floating price (index), but also creates an arbitrage between the fixed price deal offered by the mill versus the fixed price deal offered by the futures markets.
Editor’s note: David Feldstein’s comments on fixed price contracts are his own opinions and do not represent the views of Steel Market Update or the CRU Group.


