

Market Data

February 20, 2020
SMU Price Momentum Indicator - An Explanation
Written by John Packard
Writen by: John Packard, President & CEO, Steel Market Update
On Tuesday I received a question about the SMU Price Momentum Indicator, which is currently pointing toward Neutral pricing over the next 30 days.
Yesterday (Wednesday) I received the following note from one of our readers after reading Tuesday evening’s issue of Steel Market Update:
“I was just reading today’s addition of Steel Market Update. I generally feel that I get a great deal of value from your publication and the work you and your team do. The information derived from SMU helps in our steel buying decisions. Today, however, one thing struck me as I was reading the section on HARDI. In it was noted that “SMU has moved its Price Momentum Indicator to Neutral until the market establishes a clear direction.” I know that the Neutral position has been in place for a couple of weeks, but the point that struck me is the waiting to see the market establish a clear direction. It seems that knowing which way the market has moved makes it a lot easier to predict what the direction is. It is sort of like forecasting the weather by looking out the window. My thought is that your Price Momentum Indicator used to be more forecast and less reactive. Just my two cents worth. That aside I think you bring great content to your subscribers and the market.”
I have also had conversations about our Price Momentum Indicator with the steel mills over the past few months.
So, there is clear interest in this product. There is also a need to explain in more detail my thoughts as to how I make price direction determinations, and at what point in time I make a move – especially to an indicator reading of “Higher” or “Lower,” which impacts a large number of buyers and sellers of steel.
As the reader suggested in his comments on Wednesday, the steel buyers are paying attention to the Price Momentum Indicator. Everyone wants to be on the “cutting edge” of price movements, or at least not swimming against the tide.
In the early days of the Indicator, I would move it abruptly when I “felt” prices beginning to move away from where they had been the previous week (or days). My readership was smaller. The Indicator was still new, so its impact on the market was minimal.
As SMU grew and my influence on the market became more pronounced, I had to make a decision about the SMU influence on the market and market prices. I began to demand more data points, and clear data points that the market was indeed moving away from where I had the indicator. I began to understand that if SMU said prices were moving lower, just about all of the steel buyers who read our newsletters would demand concessions from the mills.
At the same time, one of the large flat rolled mills told me when we move our indicator to “Higher,” their order book is affected almost immediately.
I made the determination that it is not my function to “push” market prices in one direction or another.
OK, so how do I appease the steel buyer who is looking for cutting edge guidance regarding the direction of steel prices?
This is where you need to read the newsletter in finer detail – especially our Tuesday evening price ranges and averages – and study the steel prices section of our website for clues as to what we see happening in real time. For example, our galvanized high, low and average movement over the past three months looks like this:
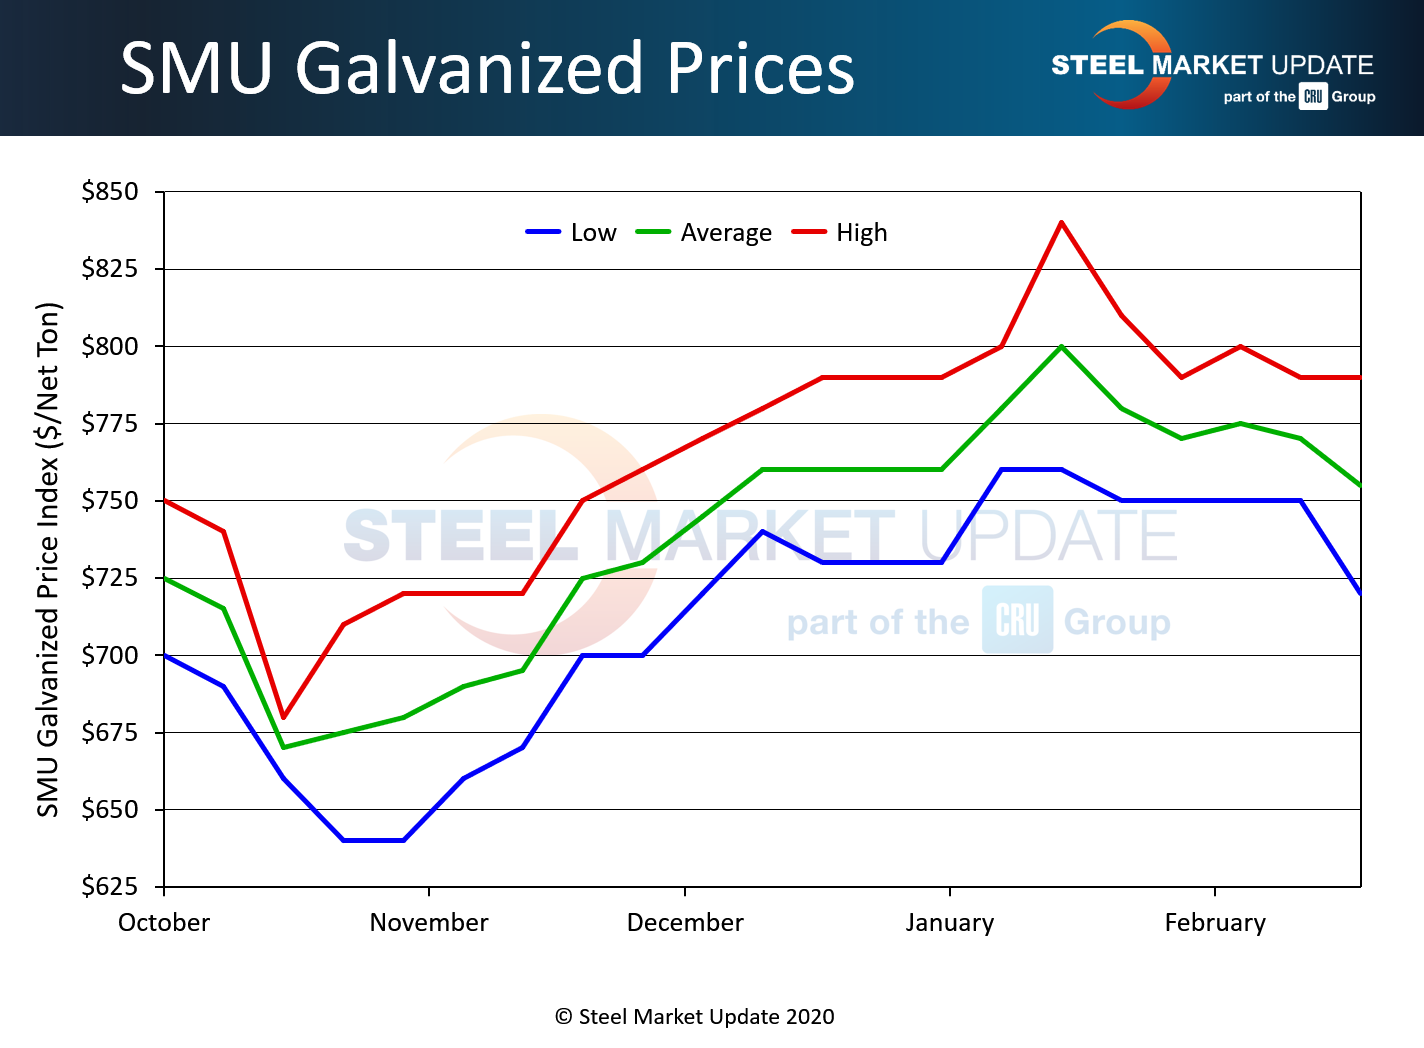
When markets start to change, we get a widening of the spread. The spread widens because not every spot buyer is in the market at all times, different mills react to weakness (or strength) in their order books differently and for many other reasons. Based on the SMU galvanized index, the market peaked the week of Jan. 14 (which is a Tuesday, the day we publish our pricing) at an $800 per ton average and a range of $760 to $840.
If you take that two-week blip out of the galvanized numbers (Dec. 31 through Jan. 14), then you will see GI numbers have been pretty flat.
There is a move on the lower end as it is now at $720 per ton ($36.00/cwt), which leads me to believe GI is experiencing some stress, and we may well need to move our Momentum Indicator on GI to Lower.
I don’t want to push the market. I would rather wait to see what happens next week.
If you are a steel buyer, having watched our Indicator as well as our steel pricing graphs on our website, you are already probing your suppliers asking for lower prices.
On the flip side, in early October, the steel mills saw a strong move up (which they followed with price increase announcements).
SMU Note: When the domestic steel mills announce a price increase, we automatically go to Neutral (unless we are already pointing to Higher prices, in which case we would remain there). I don’t push prices on the way up, nor do I encourage prices to move lower before their time.
Also note, a reading of Neutral means the market is seen to be “in transition.” I am going to have the verbiage changed in our articles as it does not mean prices will move sideways. Steel prices are always moving up and down, rarely do they move sideways. Buyers should assume when we move to Neutral that there is a bigger picture and more study is needed.
I spoke with a large hot rolled buyer who told me they were not sure where price momentum is right now on HRC. They expect the market to stay in a $500 to $600 per ton range over the next few months (if not the entire year). Today he pegged the market as being $550-$600 ($575 average), which is close to the $580 we have been reporting for the past few weeks. When asked if spot prices have gone below those numbers, this buyer confided in me they were trying to buy steel right now; quotes are in the $550-$600 range; they are not yet a buyer at those numbers… Stay tuned.
Every product we cover has its own life, its own Momentum.
Look for SMU to make Price Momentum Indicator changes over the next five working days (assuming a pattern is evolving).


