

Market Data

August 15, 2015
Oil Glut Continues
Written by Peter Wright
Figure 1 shows historical gas and oil prices since January 2000. The daily spot price of West Texas Intermediate closed at $44.94 on August 10th after recovering to $59.53 on June 15th.
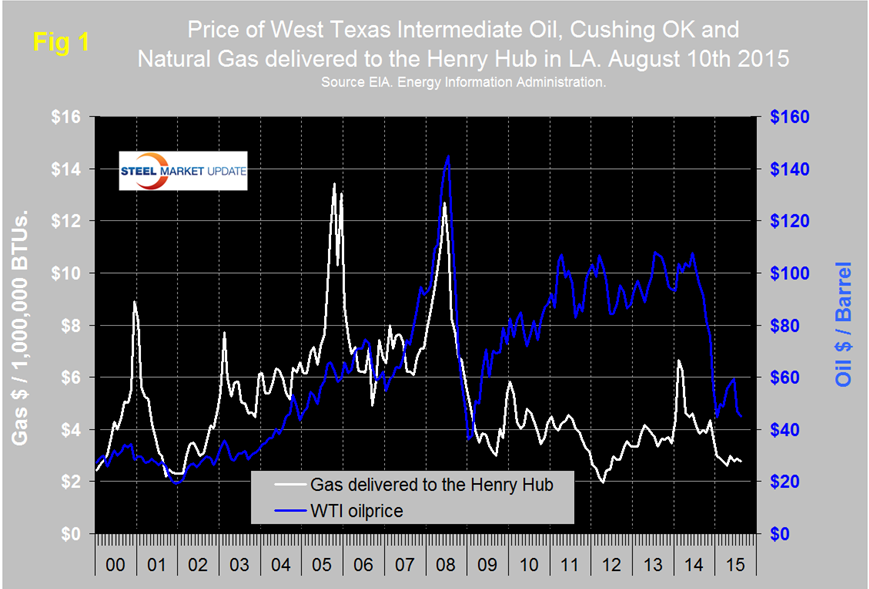
In the last two weeks WTI has declined by $2.23 according to the latest daily figure available from the Energy Information Administration, (EIA). Brent closed at $48.30 on the same day.
If sanctions on Iran are lifted as a result of a nuclear deal then there will be continued downward pressure on oil prices, to some extent this is being factored into the current market price. Iran has the world’s fourth-largest oil reserves and second-largest gas reserves. Lifting the sanctions opens up a well-supplied market to even more resources.
Timothy Lane, Deputy Governor of the Bank of Canada stated this month, “The recent movements in oil prices have been dramatic, but they are not random. Once we sort through the different economic forces at play, we see that underlying the recent drop in oil prices is a surge in unconventional oil supply against the backdrop of slower growth of global demand. Over time, higher-cost oil is still likely to be needed to satisfy growing global demand, but prices could go lower, or remain low, for a significant period before those medium-term forces do their work.”
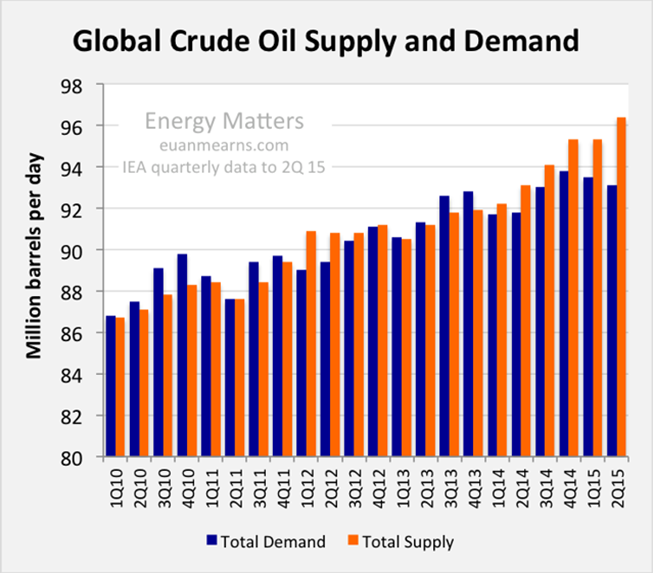
Figure 2 shows global supply and demand. Supply has risen for the last nine quarters as demand has fallen in the first half of 2015.
Natural gas delivered to the Henry Hub in Louisiana declined from November through April, recovered by 38 cents to $2.99 in May and has been hovering in a 20 cent range since then to close at $2.79 on August 7th. U.S. power stations are now reported to be generating more power from natural gas than from coal for the first time ever.
The price of natural gas has never recovered from the collapse that occurred during the recession and was followed in late 2008 by a rapid decline in the gas rig count. After a partial recovery in 2011 and 2012 the decline in the gas rig count continued and on August 14th at 211 was the lowest it has been since our data begins in January 1990.
The collapse in the oil rig count didn’t begin until October 10th last year following the oil price decline that began in June last year. Figure 3 shows the Baker Hughes US Rotary Rig Count which is a weekly census of the number of drilling rigs actively exploring for or developing oil or natural gas in the United States. Rigs are considered active from the time they break ground until the time they reach their target depth and may be establishing a new well or sidetracking an existing one.
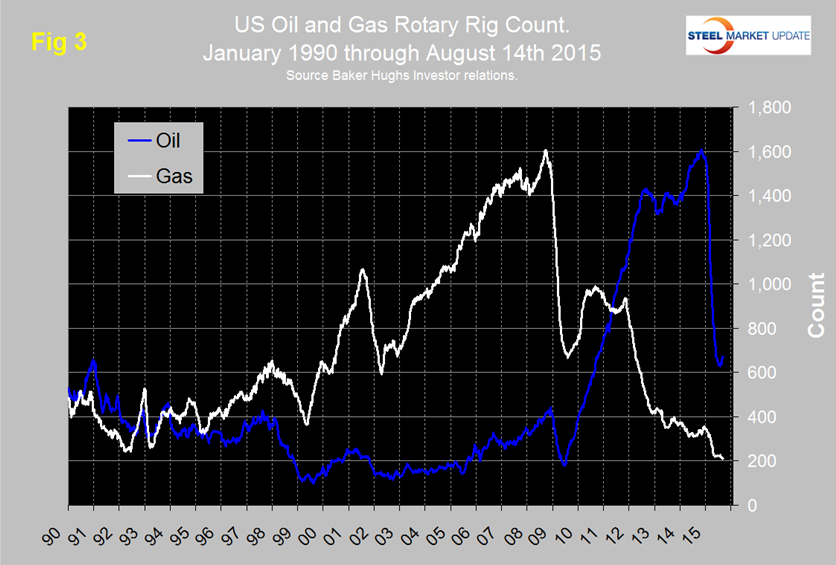
The Baker Hughes Rotary Rig count includes only those rigs that are significant consumers of oilfield services and supplies. The oil rig count bottomed out at 628 on June 26th and has since steadily recovered to 672. Year over year the oil rig count was down by 57.7 percent on August 14th. The gas rig count was down by 23.9 percent in the same comparison. Canadian rig counts on August 14th were as follows, oil 100 operating rigs, down by 55.4 percent y / y and gas 111 rigs down by 37.3 percent y / y. Canadian oil and gas rig utilization is extremely seasonal, peaking in the first quarter of each year then collapsing in the 2nd quarter and recovering into the 1st quarter of the following year.
The total number of operating rigs in the US and Canada is now 1094 an increase of 141 since the low point on May 22nd this year but down by 52.7 percent y / y.
On a regional basis in the US the big three states for operating rigs are Texas, Oklahoma and North Dakota. Texas at 388 on August 14th was up by 27 since June 26th but down by 56.6 percent since the peak on September 26th last year. The number of rigs operating in Oklahoma on August 14th was 103, the same as on May 15th and down from 213 on September 26th last year. North Dakota at 69, has had no improvement in the last month down from 189 on September 26th last year.
John Mauldin made some interesting points in his “Thoughts from the front line,” today which we have summarized here;
Shale oil and gas producers who have aggressively implemented new technologies and staked out prime deposits should perform very well, even at today’s low prices. The US chemical industry, which uses huge quantities of fuel, is already starting to build new facilities near the shale production zones. This will give them a leg up on foreign competitors whose fuel supply is more expensive.
Fracking technology is moving forward very fast. Newer techniques promise to reduce the side effects, at even lower operating costs. Furthermore, fracking is only the beginning of this revolution.
The Manhattan Institute recently published an excellent report by Mark P. Mills who outlines the way the new technologies are turning this industry on its head. Shale production or “unconventional” production is really a completely new industry. Here is a short quote:
The price and availability of oil (and natural gas) are determined by three interlocking variables: politics, money, and technology. Hydrocarbons have existed in enormous quantities for millennia across the planet. Governments control land access and business freedoms. Access to capital and the nature of fiscal policy are also critical determinants of commerce, especially for capital-intensive industries. But were it not for technology, oil and natural gas would not flow, and the associated growth that these resources fuel would not materialize.
While the conventional and so-called unconventional (i.e., shale) oil industries display clear similarities in basic mechanics and operations – drills, pipes, and pumps – most of the conventional equipment, methods, and materials were not designed or optimized for the new techniques and challenges needed in shale production. By innovatively applying old and new technologies, shale operators propelled a stunningly fast gain in the productivity of shale rigs with costs per rig stable or declining.
Shale companies now produce more oil with two rigs than they did just a few years ago with three, sometimes even spending less overall. At $55 per barrel, at least one of the big players in the Texas Eagle Ford shale reports a 70 percent financial rate of return. If world prices rise slightly, to $65 per barrel, some of the more efficient shale oil operators today would enjoy a higher rate of return than when oil stood at $95 per barrel in 2012.
Last year, while Americans celebrated Thanksgiving, the OPEC oil cartel, led by Saudi Arabia, decided not to reduce oil production. Their apparent goal was to drive prices lower and keep them low long enough to decapitate those annoying American shale producers. For a while, it looked like the gamble was working. Energy stocks plummeted as crude oil sank into the $40s. Producers slashed their capital expenditures, forcing layoffs at some top energy-service firms. The number of oil rigs in production plunged.
Now, in hindsight, it looks as though the Saudis miscalculated badly according to Ambrose Evans-Pritchard. The Saudis took a huge gamble when they stopped supporting prices and opted instead to flood the market and drive out rivals, boosting their own output to 10.6m barrels a day (b/d) into the teeth of the downturn. Bank of America says OPEC is now “effectively dissolved”. The cartel might as well shut down its offices in Vienna to save money. “It is becoming apparent that non-OPEC producers are not as responsive to low oil prices as had been thought, at least in the short-run,” said the Saudi central bank in its latest stability report. One Saudi expert was blunt and to the point. “The policy hasn’t worked and it will never work,” he said.
The new production technologies are reducing US production costs faster than the Saudi plan is reducing oil prices. OPEC’s pumping is mainly hurting its own members. Saudi Arabia is trapped. If prices go up, US shale producers will uncap some wells and produce more. And if it isn’t the US, it will be Australia, Canada, or even China’s growing shale industry. Argentina has potentially massive shale oil plays. Ditto Mexico. There is oil and natural gas all over Eastern Europe.
For the time being, the US is now the “swing producer” for both oil and gas. Production costs in the Bakken and Eagle Ford will be a lot lower than most OPEC members currently need to sustain their governments. Over time this is going to mean a significant readjustment in the spending of most Middle Eastern governments.
We should note that not all oil rigs are equal, so you cannot simply equate the number of rigs in use with oil production. There are multiple generations of oil rigs, and the ones that are going idle are older-generation rigs that cost more to operate. (One can see the same dynamic happening in the shipping business as the big cargo carriers built before the middle of the last decade are being priced out of the market. New-technology ships rule.)
SMU’s view has previously been that the oil glut could change overnight if Saudi Arabia is drawn into an active conflict with Iran over the situation in Yemen, or if OPEC reverses its position on production levels. If John Mauldin’s analysis is correct, and it seems credible, then low oil prices could be with us for a while. The industry will settle into a new norm and continued high levels of US oil production will mitigate the current reduction in energy related demand for steel products.
SMU will have Sachin Shavaram, Project Manager Rig Services for Tenaris speaking at this year’s Steel Summit Conference. Sachin, who was formerly with Severstal NA, will be able to shed some light on what has been happening in the oil patch and what we should look forward to over the next couple of years.


