

Market Data

April 8, 2021
SMU Energy Analysis for April: Oil Demand Strengthens
Written by Brett Linton
The Energy Information Administration’s April Short-Term Energy Outlook remains subject to heightened levels of uncertainty as responses to COVID-19 continue to evolve. Reduced economic activity from the pandemic caused a decline in 2020 energy demand and supply. As of April 6, the EIA expects oil demand to strengthen, as COVID-19 vaccination rates and global economic activity increase. Gasoline consumption is therefore expected to rise as more vehicles return to the roadways. Natural gas prices have declined, EIA reports, as the market disruptions that drove prices high in February have substantually lessened. EIA forecasts a mostly balanced global oil market for the remainder of 2021.
Spot Prices
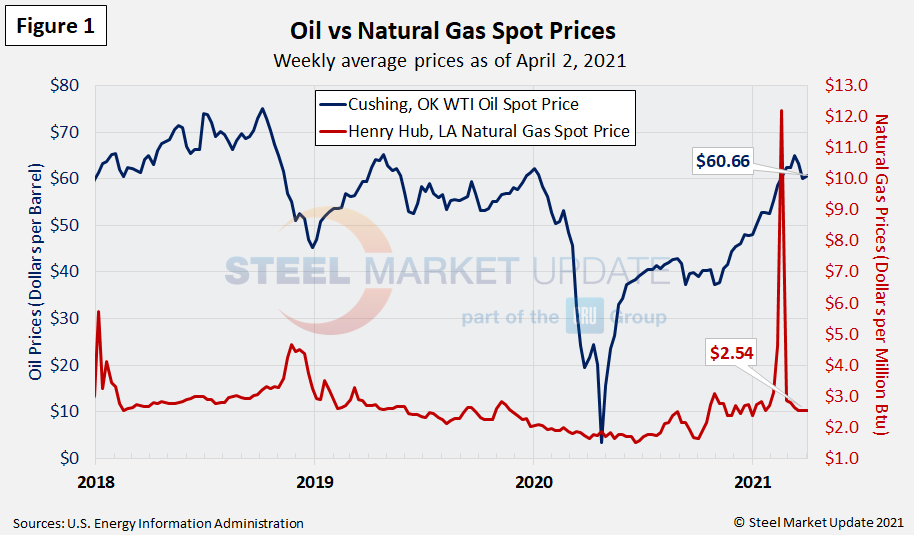
The spot market price for West Texas Intermediate (WTI) has declined since our last energy update, now at $60.66 per barrel as of April 2. Natural gas prices at the Henry Hub in Oklahoma have returned to normal levels, now at $2.54 MMBTU (million British Thermal Units) as of April 2. The market has adjusted from the mid-February spike when winter storms impacted much of the nation and the scarcity of natural gas and rising demand drove spot prices through the roof. Figure 1 shows the weekly average spot prices for each product through last week.
Rig Counts
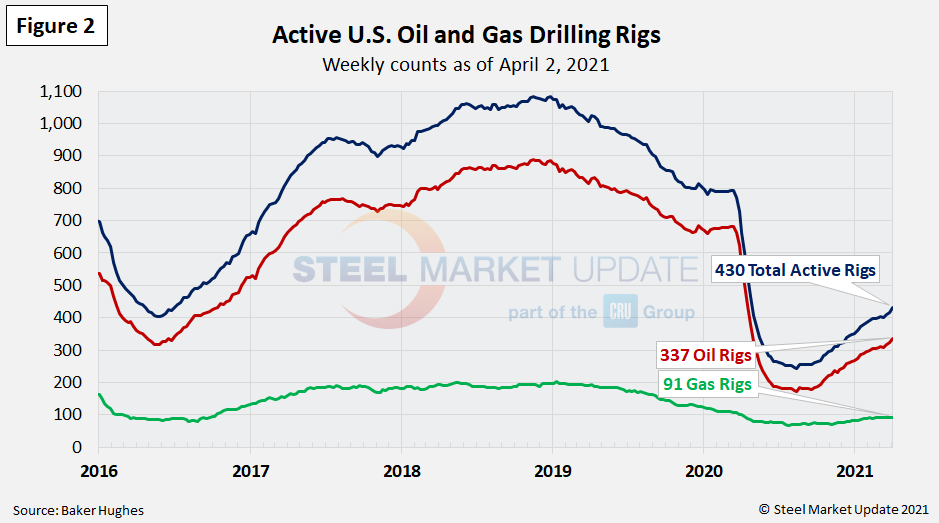
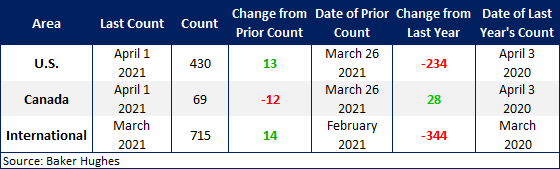
The number of active U.S. oil and gas drill rigs has continued to recover since mid-2020, up to 430 active drill rigs as of last Friday. That total is comprised of 337 oil rigs, 91 gas rigs and 2 miscellaneous rigs, according to the latest data from Baker Hughes (Figure 2). While up over recent months, active drill rigs are still down 46 percent from the March 2020 level of 793 rigs, just prior to the coronavirus shutdowns. The table below compares the current U.S., Canada and International rig counts to historical levels.
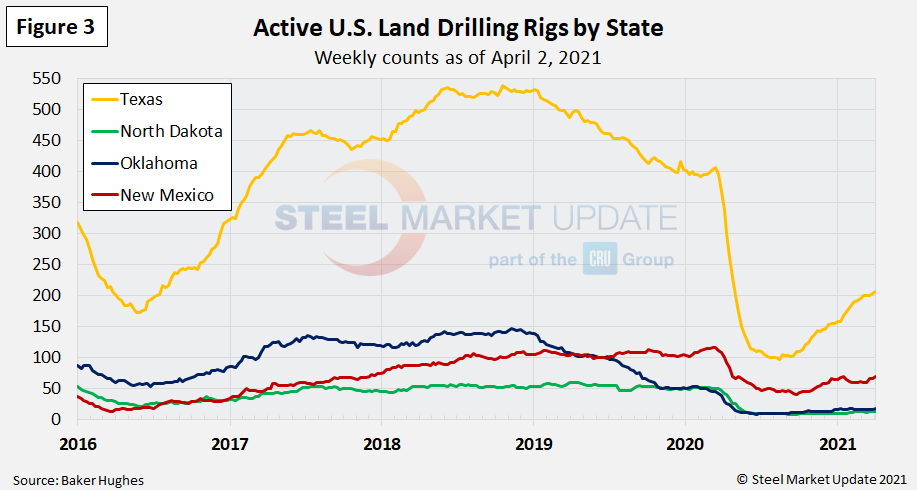
U.S. oil and gas production are heavily concentrated in Texas, Oklahoma, North Dakota and New Mexico, which have all seen declines of 40-73 percent since March of last year. The most active state, Texas, now has 207 active rigs in operation, the highest level seen since April 24, 2020. Texas rigs had plummeted from 407 in March 2020 to 97 rigs in August 2020 (Figure 3).
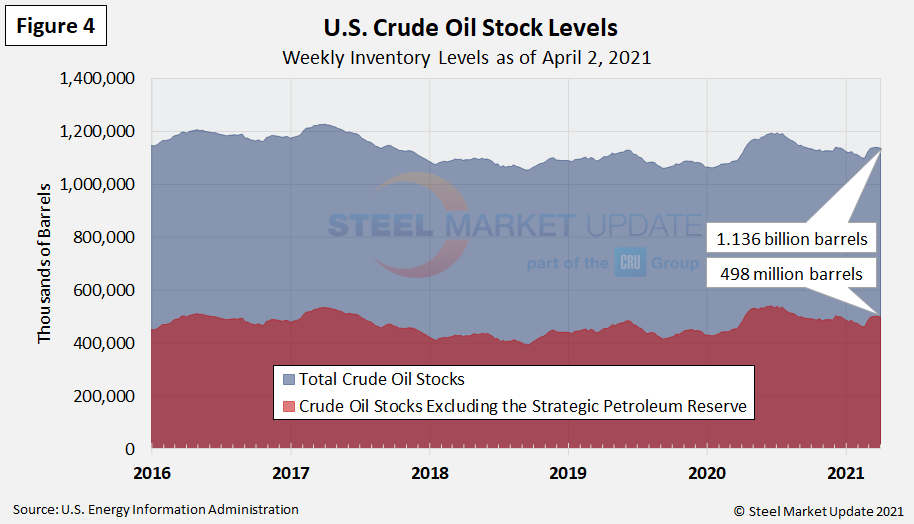
Stock Levels
U.S. total crude oil stocks in 2020 had surged from mid-March through July, but have steadily declined since then. The latest level is up slightly over our last update to 1.136 billion barrels as of April 2, and up from 1.119 billion barrels the same time last year (Figure 4).
Trends in energy prices and rig counts are a predictor of demand for oil country tubular products (OCTG), line pipe and other steel products.
By Brett Linton, Brett@SteelMarketUpdate.com


