

Market Data

January 17, 2022
Energy Market Analysis through January
Written by Brett Linton
The Energy Information Administration’s January Short-Term Energy Outlook (STEO) continues to reflect high levels of uncertainty for future global energy consumption due to the ongoing pandemic recovery, impact of the Omicron variant, and unpredictable winter weather. EIA forecasts oil prices to remain near current levels throughout 2022, while natural gas prices could experience volatility as winter temperatures drive demand and prices.
Spot Prices
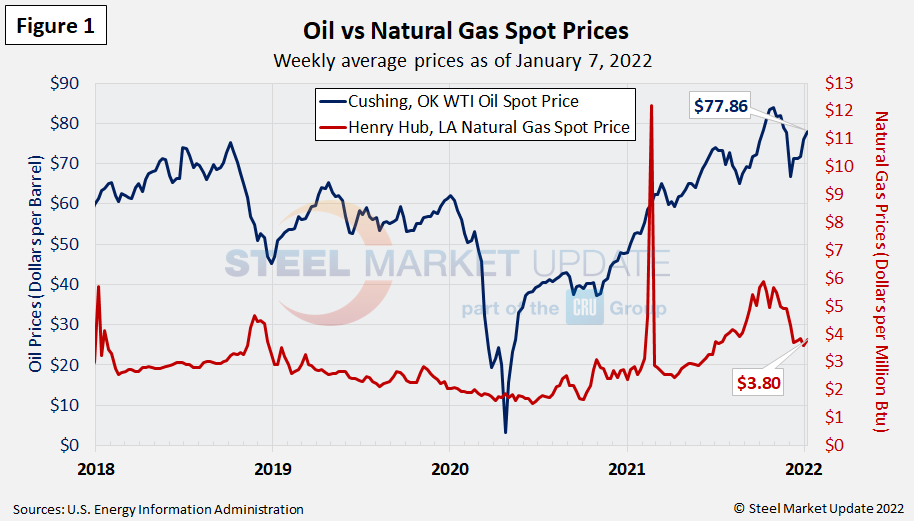
The spot market price for West Texas Intermediate (WTI) was at $77.86 per barrel as of Jan. 7. Recall that 10 weeks prior, the spot price reached $83.84 per barrel, the highest weekly price since October 2014 when it hit $87.63. Natural gas prices continue to decline from recent highs, now at $3.80 per MMBTU (million British Thermal Units) as of Jan. 7. In early October, natural gas spot prices reached a 7.5-year high, peaking at $5.87 per MMBTU (we are excluding the high spot-prices seen in February 2021 due to winter storms and supply scarcity). Figure 1 shows the weekly average spot prices for each product. The EIA now expects crude oil spot prices to average $75 per barrel for 2022 and $68 per barrel in 2023. Natural gas spot prices are expected to average $3.79 per MMBtu for 2022 and $3.63 per MMBtu for 2023.
Rig Counts
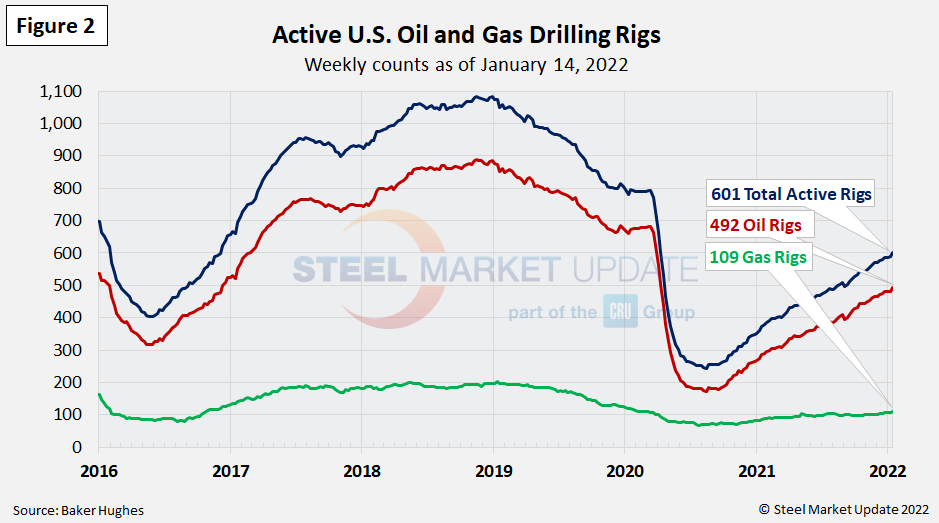
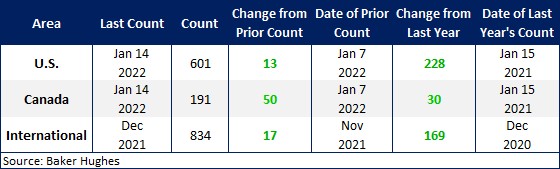
The number of active U.S. oil and gas drill rigs continues to slowly recover from the mid-2020 low. The latest count was 601 active drill rigs as of the end of last week, comprised of 492 oil rigs and 109 gas rigs, according to Baker Hughes (Figure 2). While up over recent months, active drill rigs are still down 30% from the 793 count in March 2020, just prior to the coronavirus shutdowns. EIA expects rig counts to increase into 2022 as oil production rises in the U.S. The table below compares the current U.S., Canadian and international rig counts to historical levels.
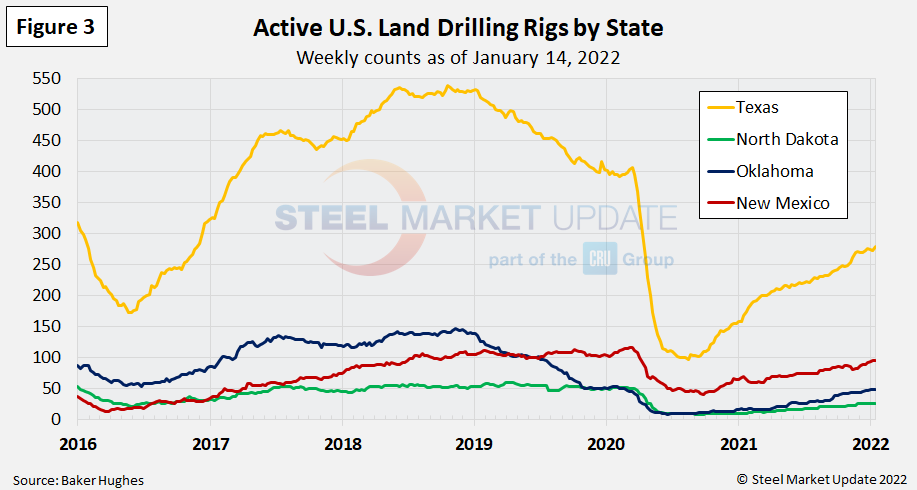
U.S. oil and gas production are heavily concentrated in Texas, Oklahoma, North Dakota and New Mexico. As of Jan. 14, production is steadily increasing, but still down as much as 48% compared to pre-COVID levels. The most active state, Texas, now has 280 rigs in operation, the highest level seen since April 9, 2020. Recall that Texas rigs had plummeted 76% back in 2020, falling from 407 in March to 97 rigs in August (Figure 3).
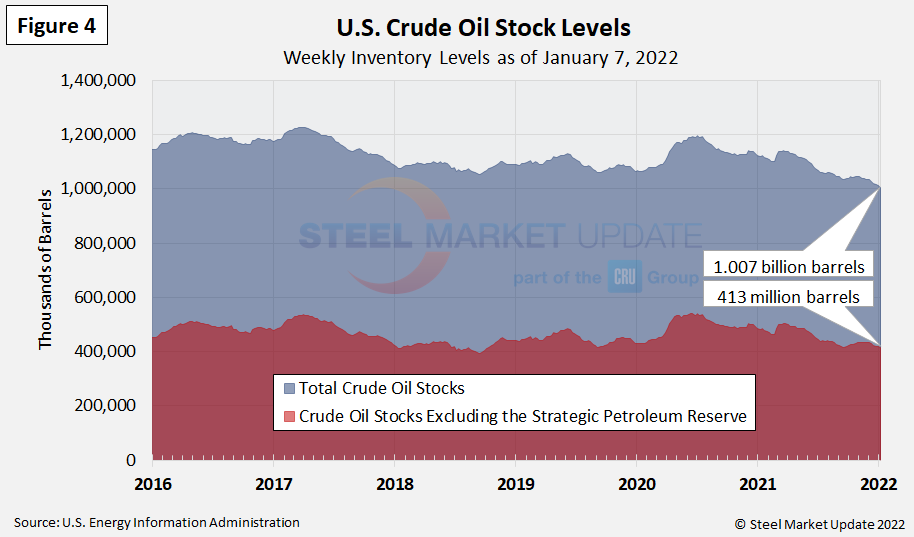
Stock Levels
U.S. total crude oil stocks continued to fall from the July 2020 high, reaching a new multi-year low of 1.007 billion barrels as of Jan. 7. This time last year stocks were at 1.120 billion barrels (Figure 4).
Trends in energy prices and rig counts are a predictor of demand for oil country tubular goods (OCTG), line pipe and other steel products.
By Brett Linton, Brett@SteelMarketUpdate.com


