

Product
August 22, 2013
Other Metallic Imports by Port & Country
Written by Peter Wright
Other metallic coated (mainly Galvalume) imports June 2013 and YTD by source and port of entry.
This is the fourth of an expanded series of analyses, exclusive to the Steel Market Update that is designed to provide a much more comprehensive view of actual volume by product. This will enable a steel buyer or manager to see exactly what came into his immediate vicinity and where it came from. This series of reports includes hot rolled, cold rolled, hot dipped galvanized (HDG) and other metallic coated. We will publish these in the same format in four consecutive issues of the Steel Market Update. This will be a Premium product in the new website. All volumes are in short tons.
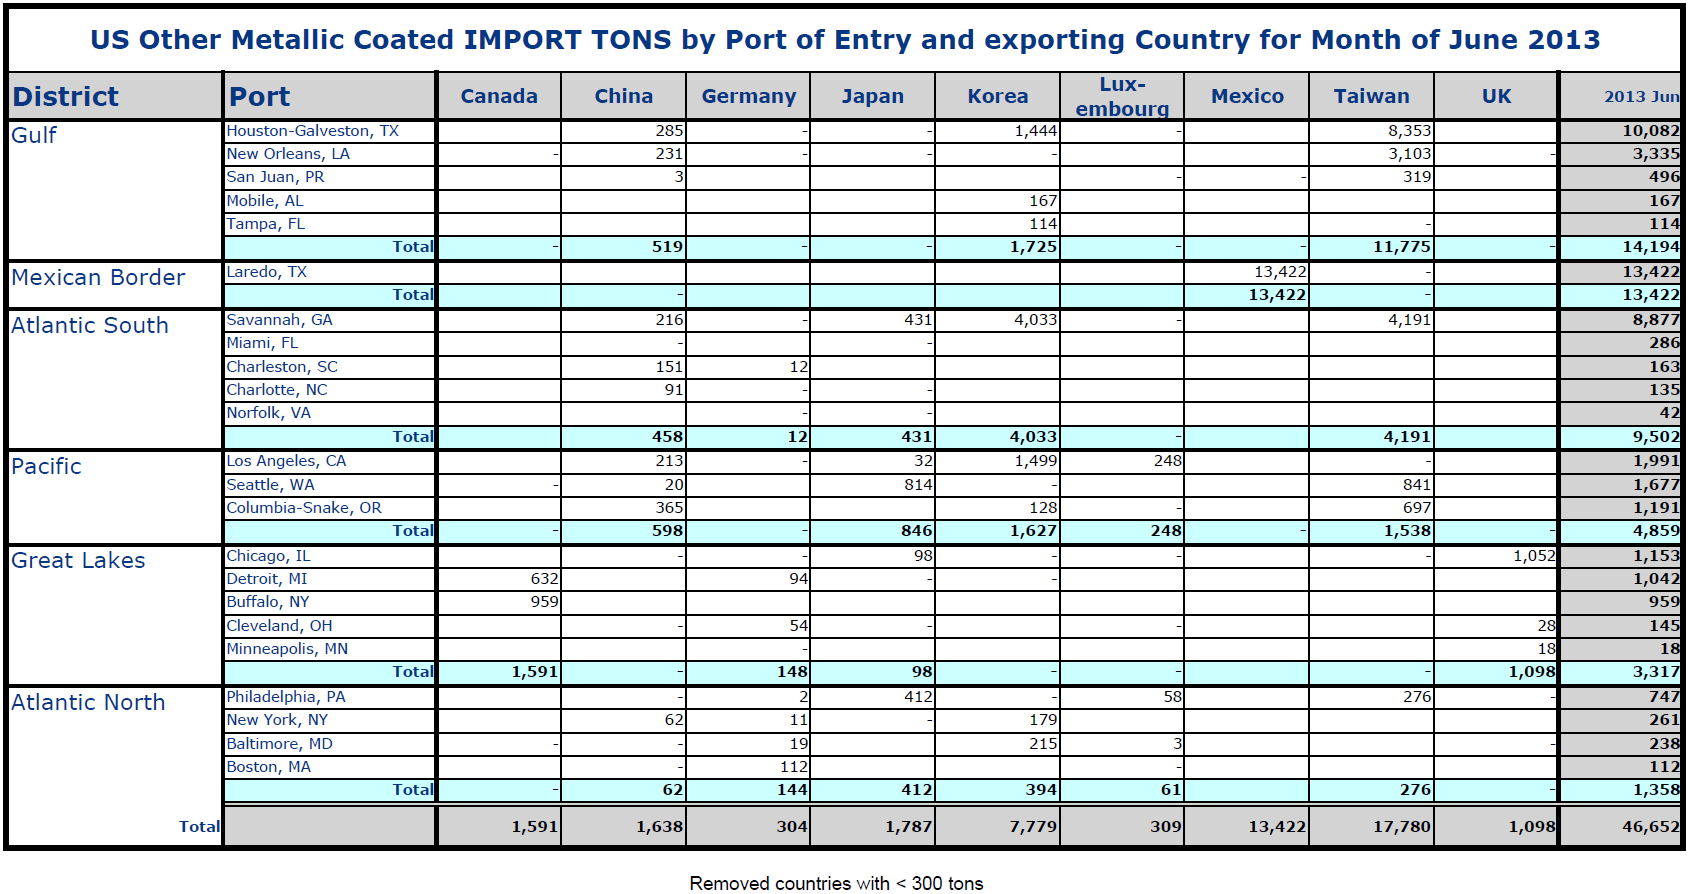
In tables 1 and 2 the smaller volume sources and ports of entry have been removed to make the tables more readable but the totals are correct.
Total OMC sheet tonnage in June was 46,652. Table 1 shows the detail by port of entry and country of origin. The Gulf ports received the most tonnage at 14,194 tons of which 8,353 tons entered Houston from Taiwan. 13,422 Mexican tons crossed the border at Laredo.
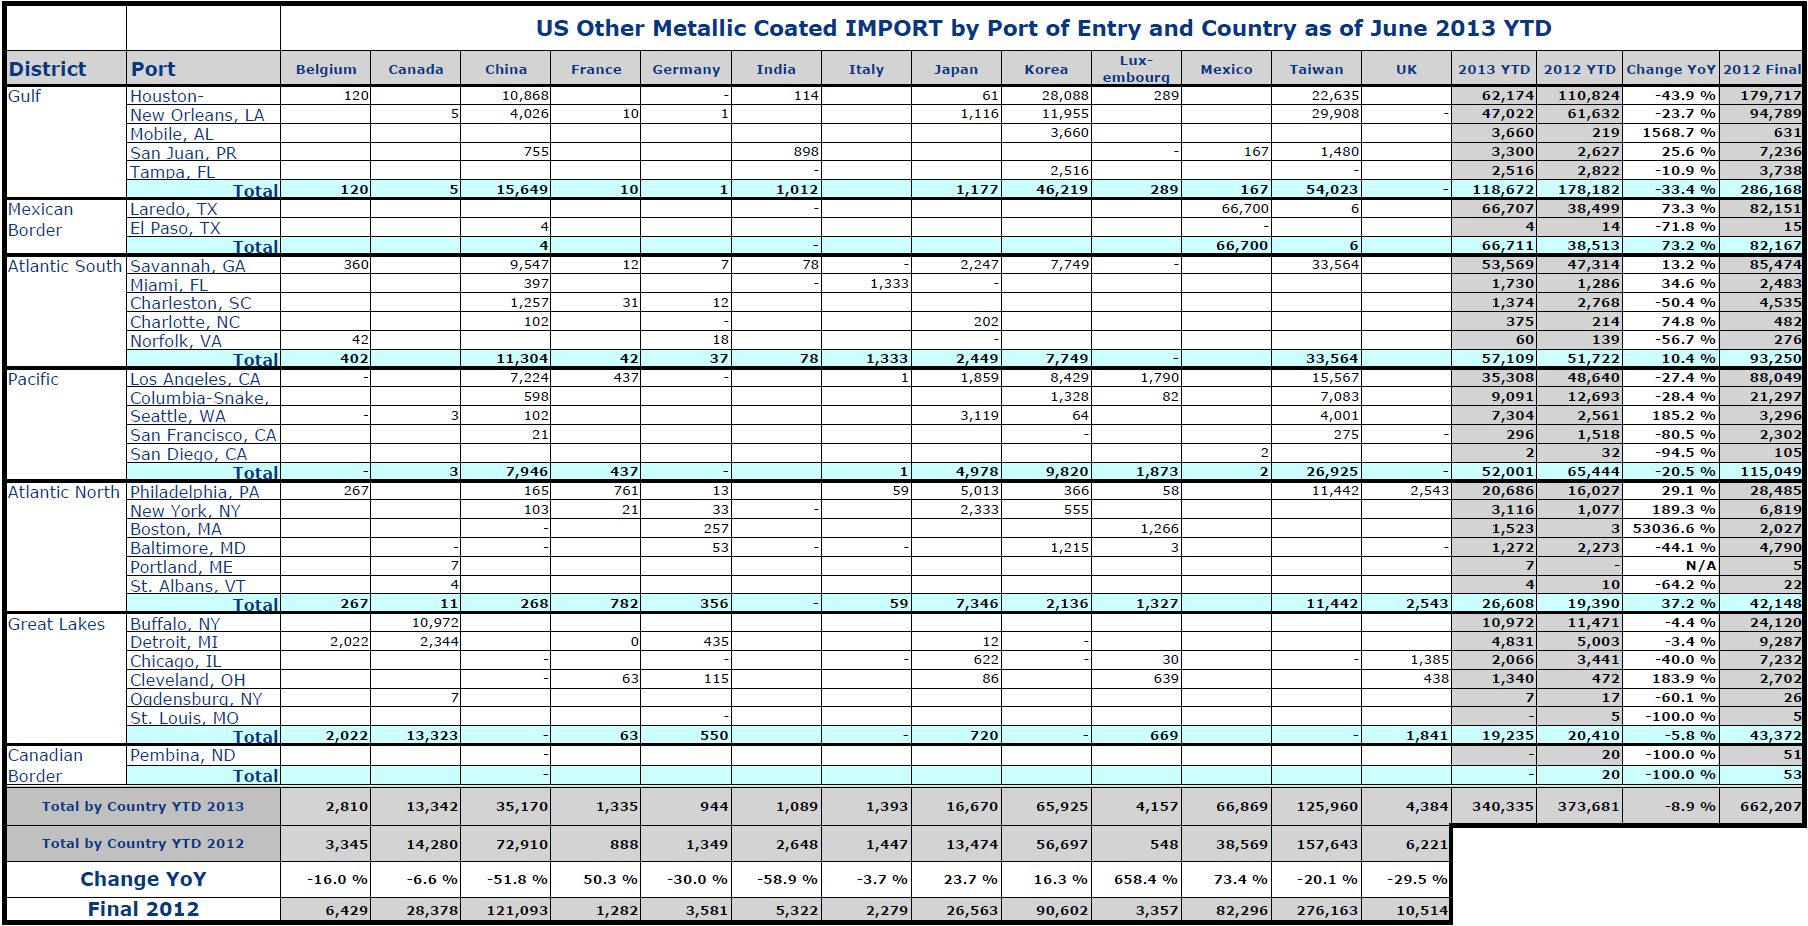
In 2013 YTD through June, 340,335 tons entered the U.S., down by 8.9 percent from 2012 through June. The Gulf ports received the highest tonnage at 118,672 tons, down by 33.4 percent from last year. Taiwan was the most prolific supplier in 2013 through June with 125,960 tons, down by 20.1 percent from last year. Most of the Taiwanese tonnage came in through Houston, New Orleans and Savannah. Tonnage from Chine YTD is down by 51.8 percent year over year. Table 2 gives detail of tons by port of entry for 2013 through June.
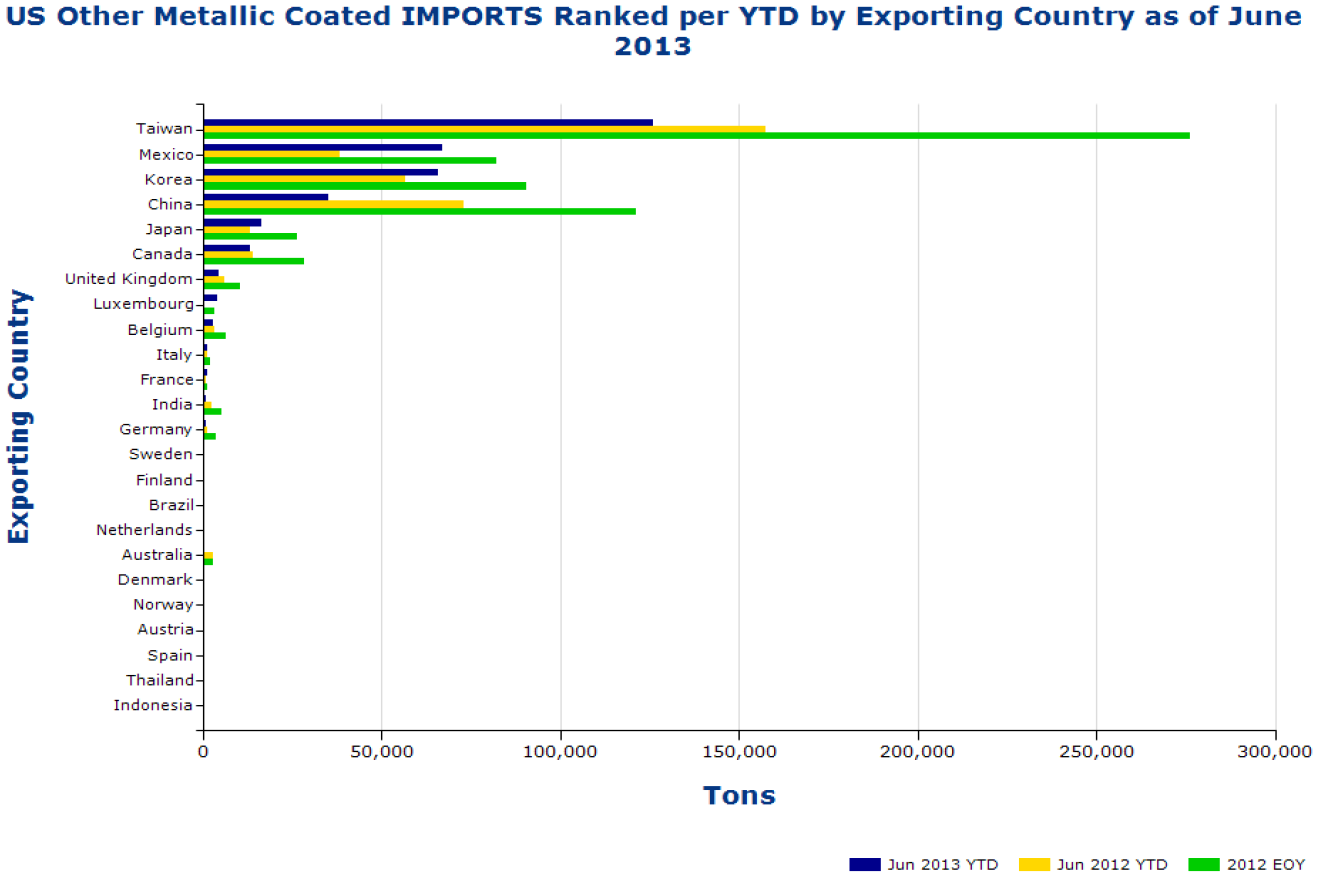
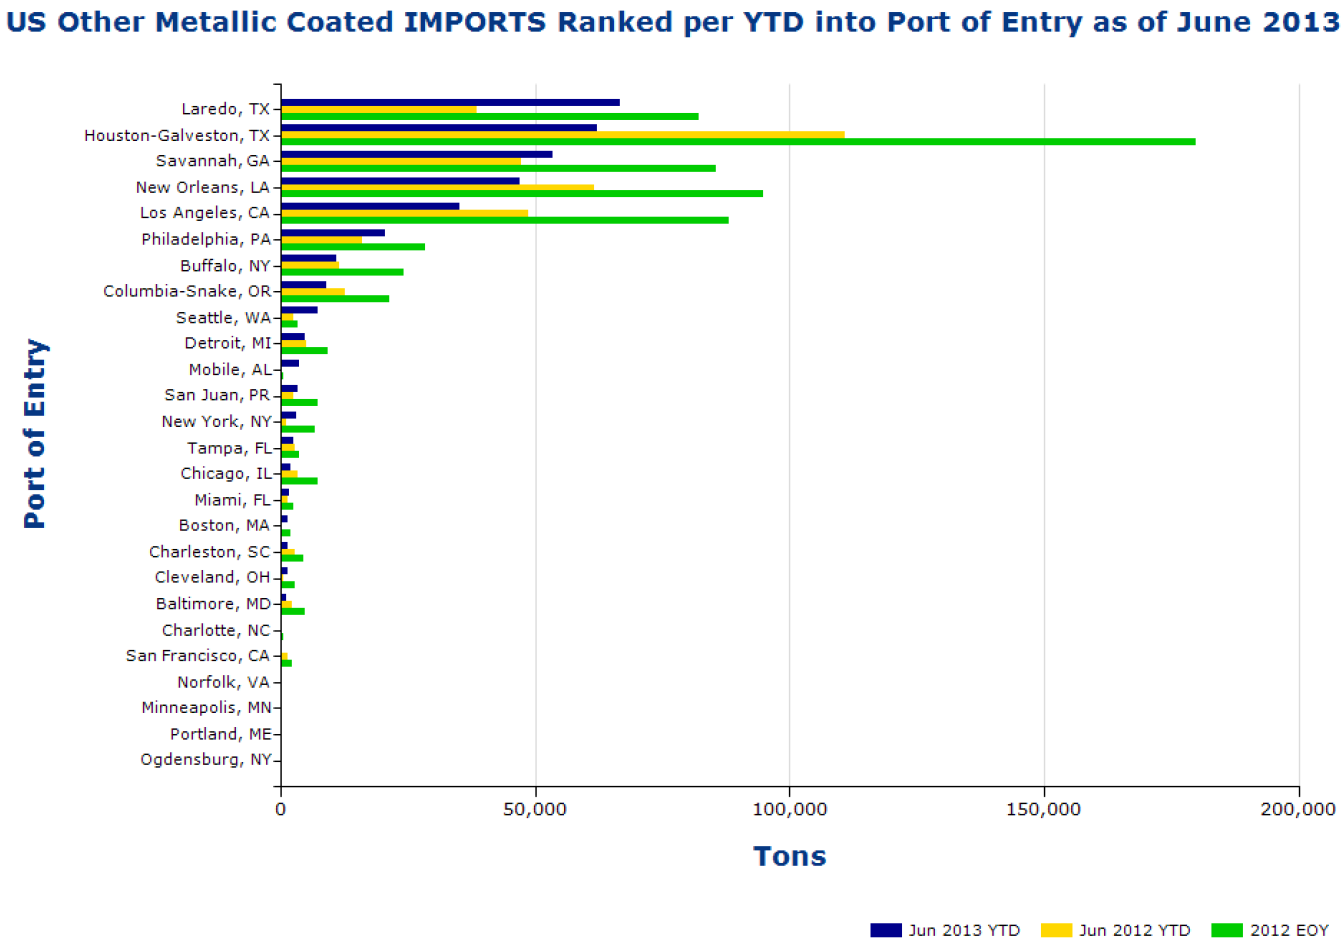
Volume YTD by source and by district of entry are shown graphically in Figures 1 and 2. The green bars indicate the final 2012 tonnage in each case. Countries and ports are ranked by the 2013 YTD tonnage. Figure 1 shows that tonnage from Taiwan and China is down this year as tonnage from Mexico, Korea and Japan has increased. Canada is about even. Figure 2 shows the tonnage by port. Houston, New Orleans and Los Angeles are down this year. Tonnage into Laredo, Savannah and Philadelphia has increased.


