

Prices

October 11, 2013
Analysis of Imports by Groups, Regions and Importing Countries
Written by Brett Linton
SMU has received a number of questions about the overall level of imports into the U.S. For example, 33.5 million tons in 2012 sounds like a lot. We don’t see this magnitude on the flat rolled side. Could someone please explain what product forms the imports are coming in and where they are coming from? This article addresses those questions.
The following table shows imports by major product category. The data is in millions of short tons (MT).
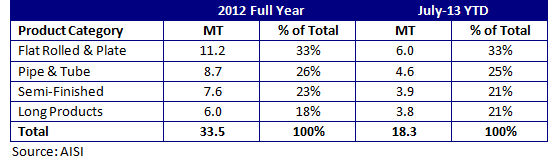
As shown in the table, flat rolled & plate imports are one-third of total imports. In other words, two-thirds of total imports are in product forms other than flat rolled.
Pipe & tube requires some special analysis. In 2012, pipe & tube imports were 5.6 MT welded and 3.1 MT seamless. One could argue that welded products should be allocated to flat rolled and seamless products should be allocated to long products. If you make this adjustment, flat rolled imports would increase to 16.8 MT (50% of the total) and long products would increase to 9.1 MT (27% of the total).
Another interesting analysis is to see where the imports are coming from. The following table summarizes imports by major world region.
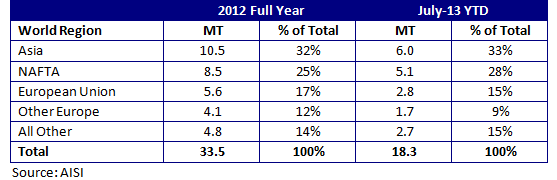
About 60% of total imports com from Asia and NAFTA. Three quarters of the Asian imports come from (in descending order) South Korea, Japan, and China. NAFTA imports are split two-thirds from Canada and one-third from Mexico.
Finally, the following table summarizes the top five importing countries.
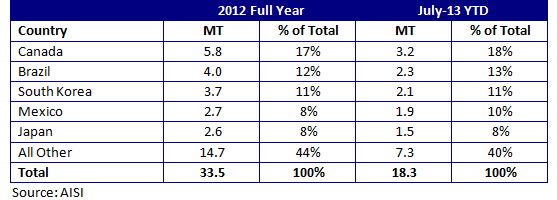
As shown, five countries are 55% – 60% of total imports. Although Brazil is second on the list, a significant portion of Brazilian imports are slabs for the ThyssenKrupp facility in Alabama. China is noticeably absent from the list. In 2012, China imported 1.7 MT to the U.S. representing 5% of total imports. (By Paul Lowrey – Managing Director of Steel Research Associates, LLC)


