Prices

October 21, 2014
Global Steel Production and Capacity Utilization in September 2014
Written by Peter Wright
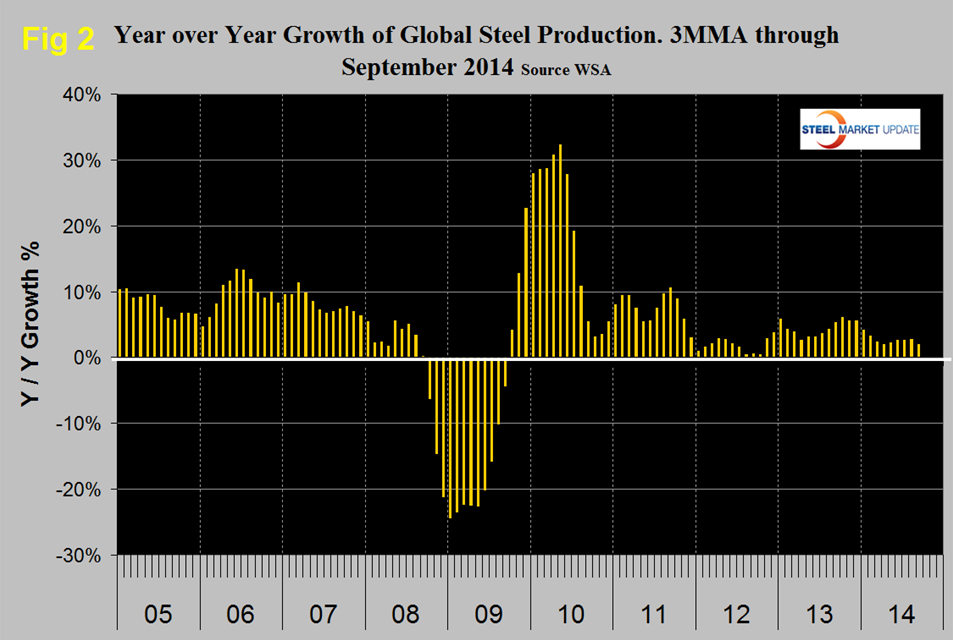
Production in September on a tons per day basis was 4.481 million tonnes, up from 4.342 in August. This was the third month since February when production was <4.5 million tons per day. For the month of September production was 134.421 million tonnes down from 135.167 in August. This was a seasonal effect, due to one less day in the month. Since January 2008 on average, September monthly production has declined by 0.37 percent from August. This year September declined 0.55 percent from August. The three month moving average (3MMA) of production in September on an annualized basis was 1.625 billion tonnes and a capacity utilization of 75.0 percent, (Figure 1).
Capacity is now 2.123 billion tonnes. Table 1 shows regional production in the single month of September with regional share of the global total, also three months production through September and YTD production. Regions are shown in white font and individual nations in beige.
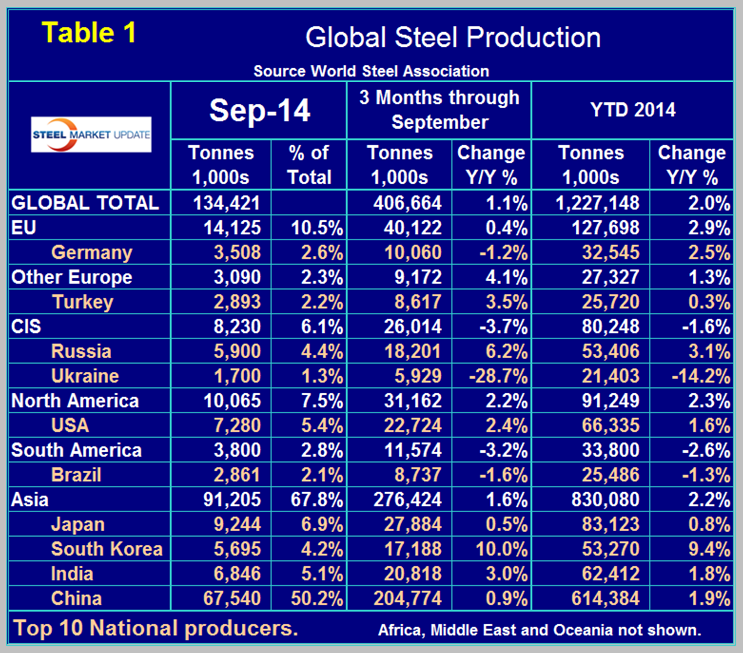
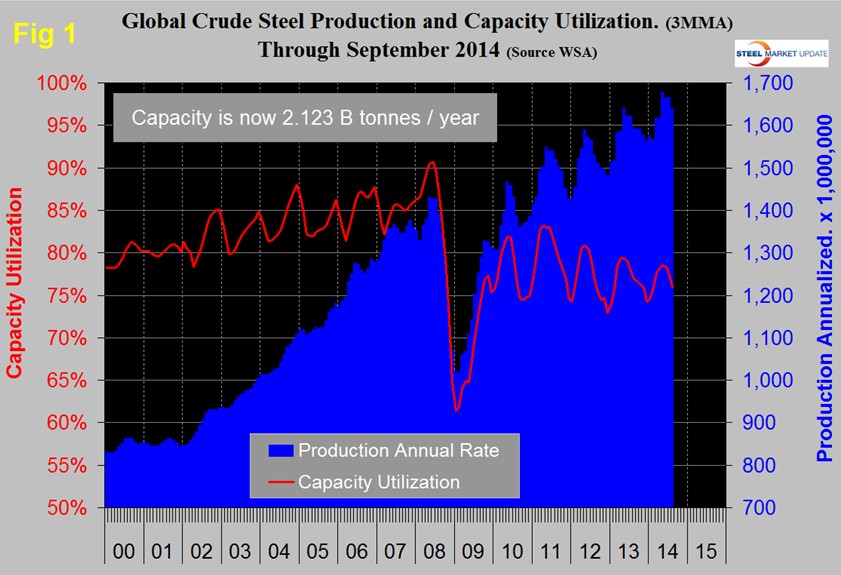
In three months through September, y/y global growth was 1.1 percent, down from 2.8 percent in three months through August. Year to date growth through September was 2.0 percent down from 2.4 percent in YTD through August. All regions except the CIS and South America had positive y/y growth in three months through September. The effect of the war in Ukraine is clear in the contraction of that country’s steel production. The European Union which had the fastest growth rate in early 2014 continued to slow and achieved only 0.4 percent in three months through September. Year over year growth of output in the NAFTA was 2.2 percent in three months through September with the US at 2.4 percent. Canada achieved 7.0 percent and Mexico contracted by 0.8 percent. South America had negative 3.2 percent growth through September with its largest producer, Brazil down by 1.6 percent. Growth in Asian production was 1.6 percent once again led by South Korea at 10.0 percent. In the single month of September, China’s production was exactly the same as September last year, in three months through September China’s production grew by 0.9 percent y/y and YTD was up by 1.9 percent y/y. This may be evidence of the much anticipated slowing in the growth of China’s production. In September China’s share of total global production was 50.2 percent and North America’s was 7.5 percent. Figure 2 shows that the 3MMA of the y/y growth of global production which steadily increased from 2.0 percent in April to 2.8 percent in August, returned to 2.0 percent in September. (Source: World Steel Association.)