• Skip to main content

    Analysis

    Active Gas & Oil Rigs Continue to Decline

    Written by Brett Linton


    According to Baker Hughes data from January 30th, 2015, the U.S rig count for this week is 1,543 rigs exploring for or developing oil or natural gas. This count is a decrease of 90 rigs when compared to last week, with oil rigs down 94 to 1,223 rigs, gas rigs up 3 to 319 rigs, and miscellaneous rigs up from zero to 1 rig. Compared to last year the 1,543 count is a decrease of 242 rigs, with oil rigs down by 199, gas rigs down by 39, and miscellaneous rigs down by 4.

    The Canadian rig count decreased by 38 to 394 rigs this week, with oil rigs down 23 to 200 rigs and gas rigs down 15 to 194 rigs. Compared to last year the 394 count is a decrease of 214 rigs, with oil rigs down by 204 and gas rigs down by 10. International rigs decreased by 11 to 1,313 rigs for the month of December, a decrease of 22 rigs from the same month one year ago. For a history of both the US and Canadian rig count click here.

    Brett Linton

    Read more from Brett Linton

    Latest in Analysis

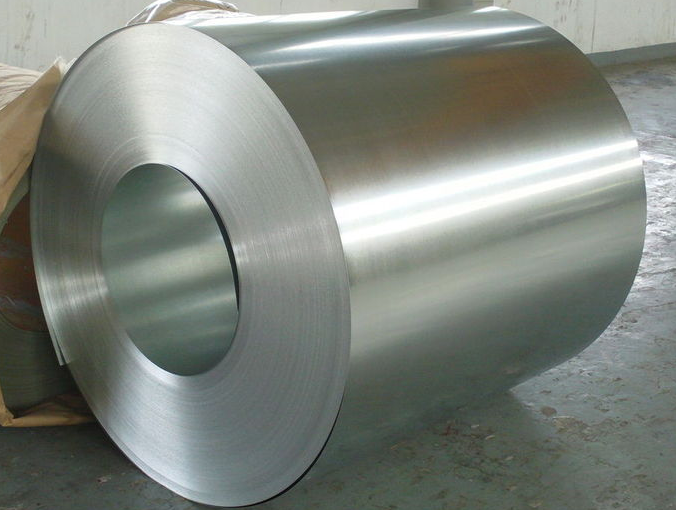
    galvalume steel coil

    SMU Survey: Mill willingness to negotiate price at lowest levels since 2021

    The majority of steel buyers responding to our latest market survey reported that mills continue to hold a firm grip on prices. The share of buyers reporting that mills were negotiable fell this week to the lowest rate seen in over five years. Every two weeks, SMU surveys service center and manufacturer buyers asking if mills are negotiable on new spot sheet and plate orders. In this week’s survey, just 3% of respondents said mills were willing to talk price to secure an order (Figure 1). This is down 11 percentage points from our mid-October survey.

    HR Futures: Basic story remains, but curve shifts

    In my last column, the HRC futures curve was pricing a sizable premium on near-term tightness while still pointing toward eventual normalization. Since then, that basic story has remained intact, but the shape of the curve has shifted meaningfully. Rather than simply moving higher and pushing the peak out by another month, as has largely been the pattern throughout this rally, the curve is now pricing a more pronounced and prolonged period of tightness, while the long end has remained relatively anchored, which previously had also been lifted with the rest of the curve.

    SMU flat-rolled market survey results now available

    The results of the latest Steel Market Update (SMU) flat-rolled market survey are now available on our website to all premium members. After logging in, look under the Data tab for Market Reports, and there you will find the Flat-Rolled Survey Results section. Previous survey results are also available on that page. If you need help accessing these results, or if your company would like to have your voice heard in our future surveys, contact smu@crugroup.com.

    Mill lead times climb to new highs, buyers expect little relief

    Lead times for sheet and plate products continued to lengthen amid historically tight supply, according to the latest SMU steel market survey data. Average lead times now extend into January 2027, with some mills quoting availability well into February. Lead times for all sheet products except Galvalume stand at their highest point since the post-Covid demand snapback in 2021. Plate lead times exceed their 2021 peak, setting a record in our data series, which dates to 2018. (We started collecting sheet lead times earlier, in 2011.)