Analysis

October 22, 2015
Housing Starts, Permits and Builder Confidence
Written by Peter Wright
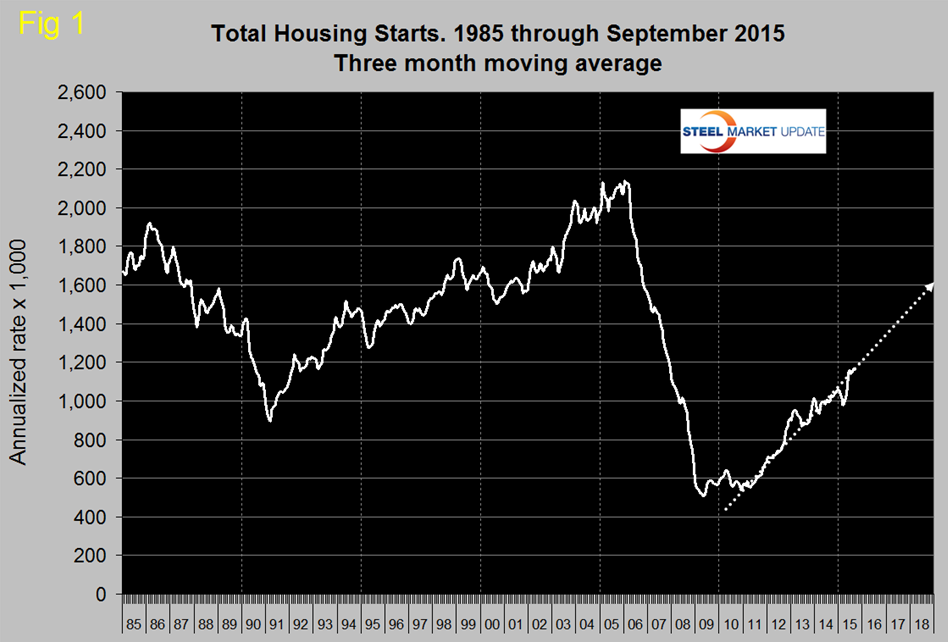
Total housing starts in September were at an annual rate of 1,206,000 which was only the second time to break 1,200,000 since the recession. The first was in June. In September the three month moving average (3MMA) was 1,163,000 which was also the second best month since the recession. The best month was last month, August. Total starts are still on track to reach 1.6 million units annualized by the end of 2018 (Figure 1).
Single family starts in September were at an annual rate of 740,000. The 3MMA was 746,000 and was up by 14.1 percent year over year but is still 59.4 percent below the peak of late 2005. August and September had the best y/y growth rate of single family since May 2013.
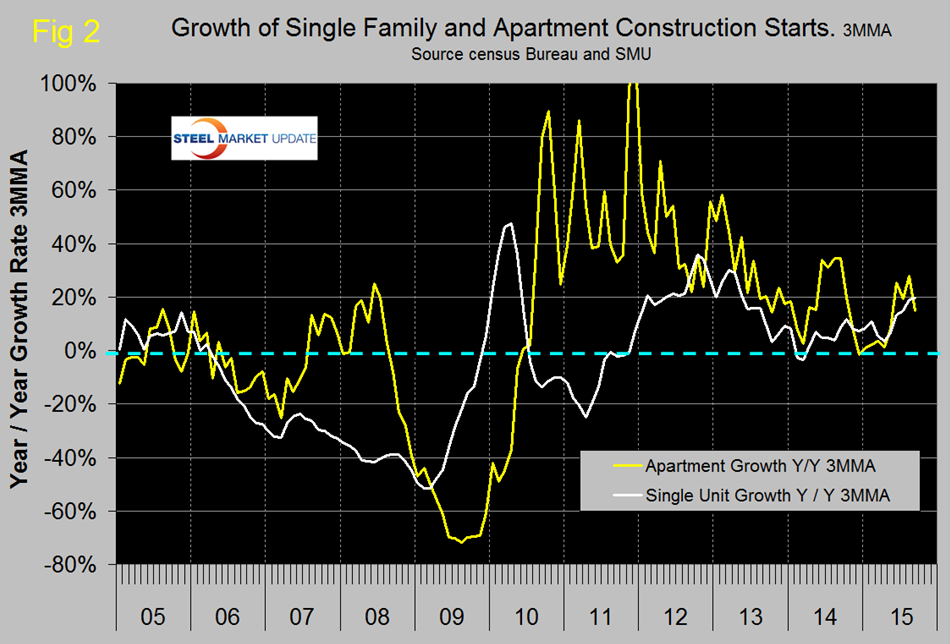
Multifamily (apartments/condominiums) starts in September were at an annual rate of 466,000 with a 3MMA of 418,000. The 3MMA was driven strongly by a freak result in June of 524,000 and as we expected dropped significantly in September (Figure 2).
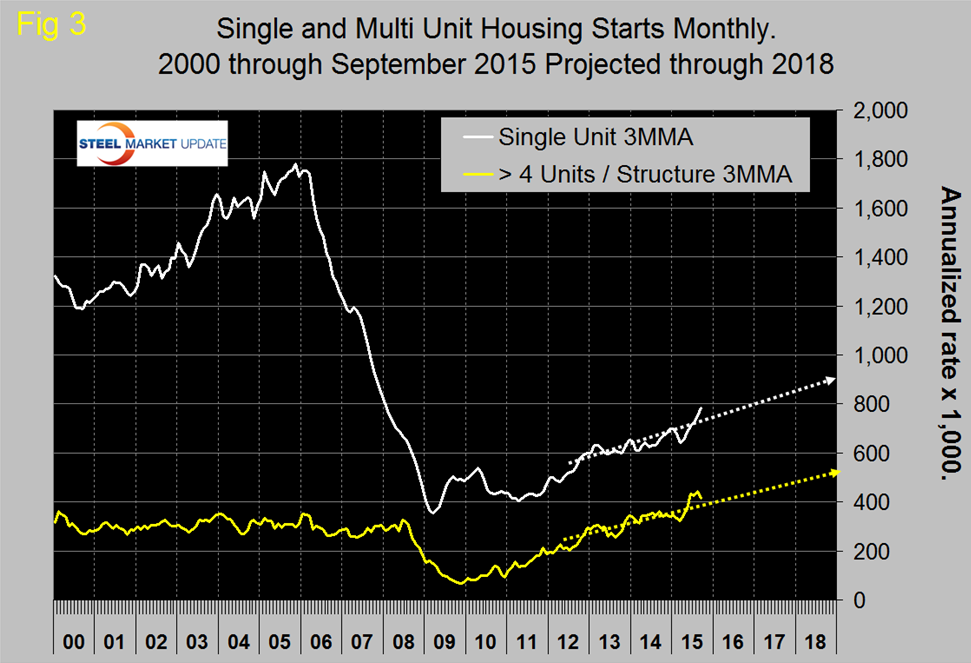
The Census Department results are seasonally adjusted and the monthly numbers are annualized. Multifamily starts had lack-luster growth for seven months prior to June and, after a three month surge, are now heading down again. The trajectory of single family and apartments greater than 4 units are tracking to reach 900,000 and 500,000 by the end of 2018 respectively (Figure 3).
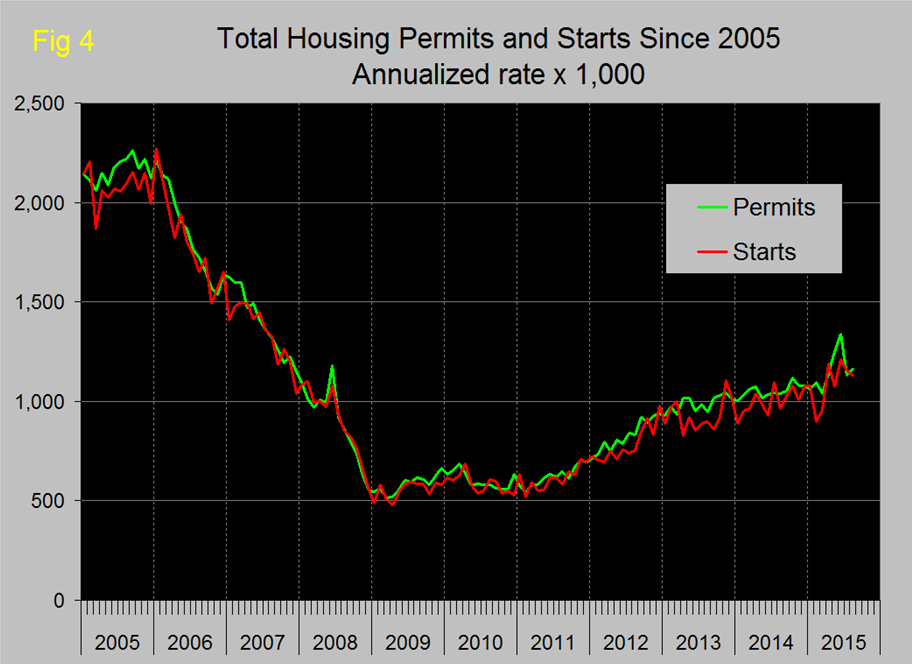
Permit data is useful as a forward look at starts. If permits exceed starts then we anticipate an acceleration in construction and vice versa. Total permits in September were at an annual rate of 1,103,000 with a 3MMA of 1,131,000. Permits are back on track with starts after a major divergence in June (Figure 4), however it looks as though permits don’t always lead to ground breaking and sometimes, as in 2013 there can be quite a wide divergence.
On a 3MMA basis total permits were up by 8.3 percent y/y. Single family were up by 7.2 percent and multifamily by 10.0 percent. Multifamily permit growth peaked at 41.4 percent y/y in July. Most economists have been expecting a decline driven by the end of a tax subsidy in New York State and this can be seen in the data; permits in the North East fell from 241,000 in May to a total of 178,000 in 3 months through September.
Table 1 shows total permits and starts nationally and regionally.
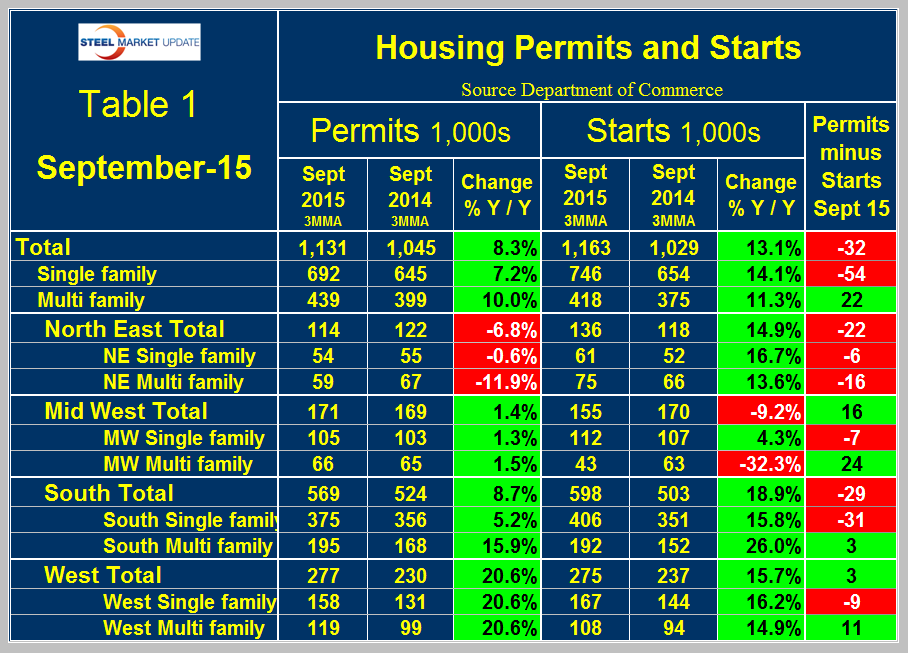
At the national level the differential between permits and starts for single and multi-family units is suggesting that the shift in consumer’s preference towards apartments is ongoing. In September on a 3MMA basis, permits of multi-family exceeded starts by 22,000 in contrast to the negative 54,000 for single family. In total permits were 32,000 less than starts. The differential between permits and starts for multi and single family units was the same across all regions except the North East with permits for multifamily exceeding starts and permits for single family being less than starts. The implication is that apartment construction is poised to surge strongly and that single family construction will slow slightly. The ratio of the two sectors is shown in Figure 5 and demonstrates that single family homes continue to be less desirable than at any time since March 1974. Based on permit data the ratio will not change any time soon.
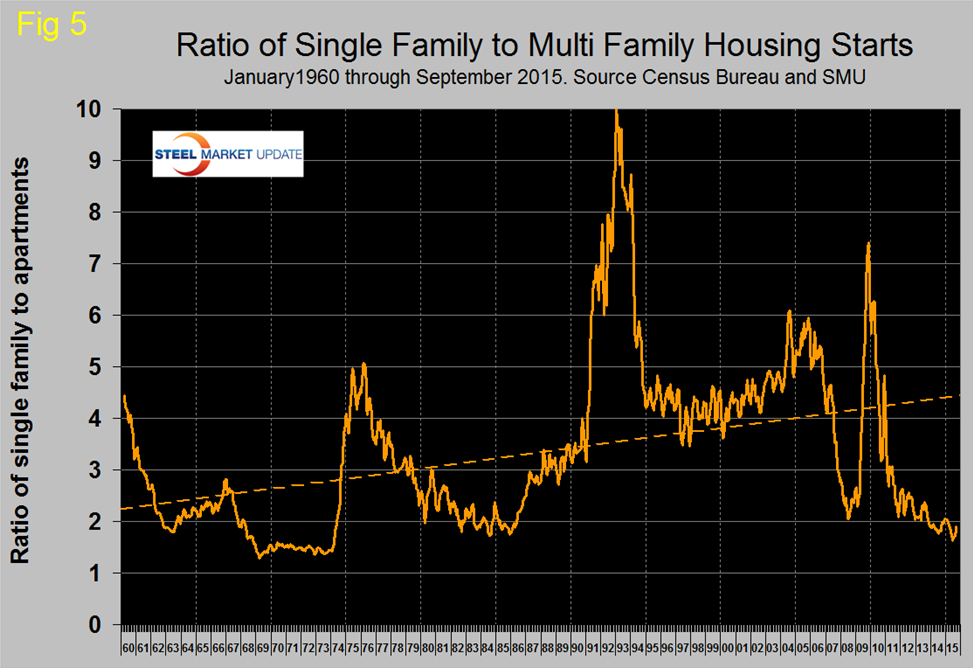
Figure 6 shows the regional situation for the 3MMA of total residential starts since February 2000.
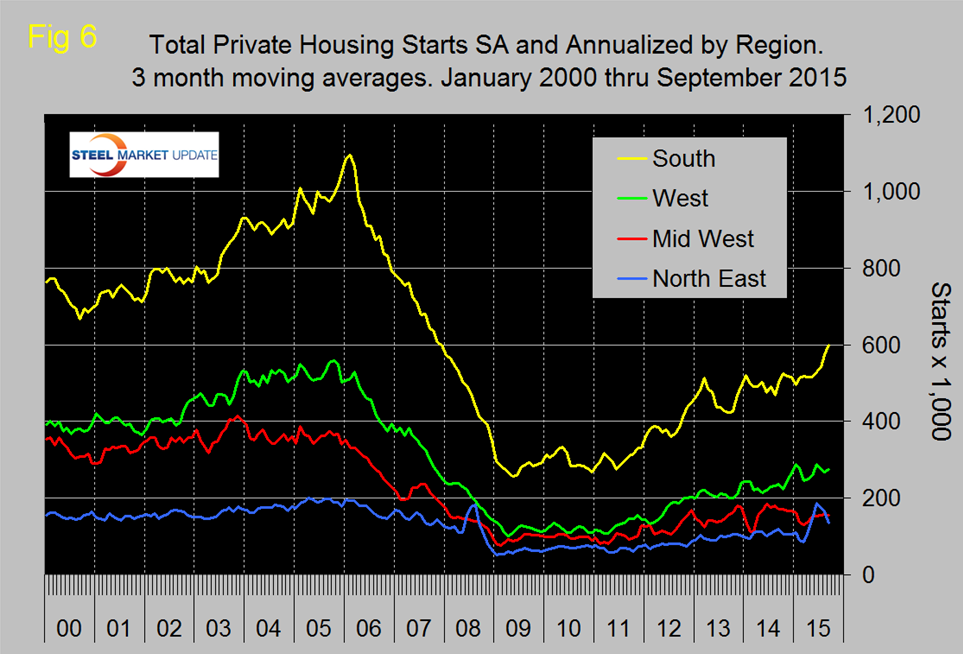
In the first half of 2015 the North East had the highest growth rate driven as mentioned above by apartment construction in New York state but now that has cooled. The South is growing the fastest at present.
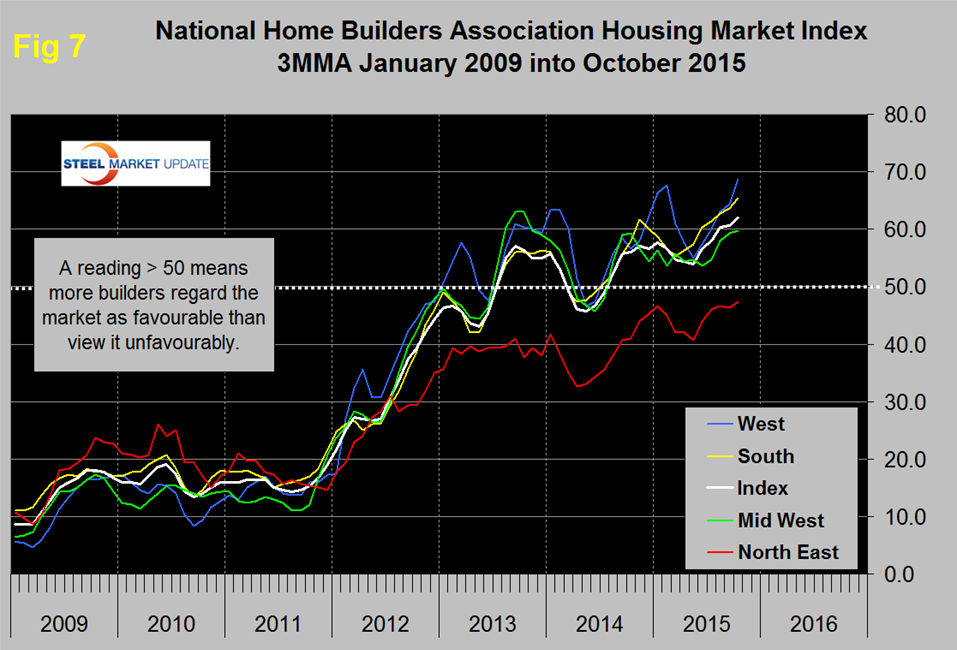
The National Association of Home Builders (NAHB) confidence report was released on Monday. Any value above 50 indicates an overall positive business confidence. The national average gained three point to 64 with a 3MMA of 62 which is the highest value since our data stream began in January 2009. All regions enjoyed an increase in confidence on a three month moving average in October (Figure 7). The South and west continue to be the strongest regions.
The official release from the NAHB was as follows:
Builder Confidence Rises Three Points in October
Builder confidence in the market for newly constructed single-family homes rose three points in October to a level of 64 on the National Association of Home Builders/Wells Fargo Housing Market Index (HMI). This month’s reading is a return to HMI levels seen at the end of the housing boom in late 2005.
“The fact that builder confidence has held in the 60s since June is proof that the single-family housing market is making lasting gains as more serious buyers come forward,” said NAHB Chairman Tom Woods, a home builder from Blue Springs, Mo. “However, our members continue to tell us there are still pockets of softness in some markets across the nation, and that they face challenges regarding the availability of lots and labor.”
“With October’s three-point uptick, builder confidence has been holding steady or increasing for five straight months. This upward momentum shows that our industry is strengthening at a gradual but consistent pace,” said NAHB Chief Economist David Crowe. “With firm job creation, economic growth and the release of pent-up demand, we expect housing to keep moving forward as we start to close out 2015.”
Derived from a monthly survey that NAHB has been conducting for 30 years, the NAHB/Wells Fargo Housing Market Index gauges builder perceptions of current single-family home sales and sales expectations for the next six months as “good,” “fair” or “poor.” The survey also asks builders to rate traffic of prospective buyers as “high to very high,” “average” or “low to very low.” Scores for each component are then used to calculate a seasonally adjusted index where any number over 50 indicates that more builders view conditions as good than poor.
Two of the three HMI components posted gains in October. The index measuring sales expectations in the next six months rose seven points to 75, and the component gauging current sales conditions increased three points to 70. Meanwhile, the index charting buyer traffic held steady at 47.
Looking at the three-month moving averages for regional HMI scores, all four regions posted gains. The West registered a five-point uptick to 69 while the Northeast, Midwest and South each rose one point to 47, 60 and 65, respectively.
SMU Comment: Housing starts were one of the most indicative indicators of impending recession in 2007. Actually the most indicative of any indicator that we track. At the present time the housing market recovery as measured by total starts is showing no sign of hesitation.