Market Data
June 23, 2016
May ABI at Highest Score of 2016
Written by Sandy Williams
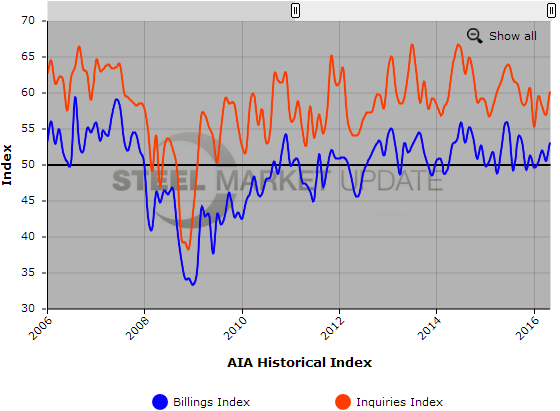
The Architectural Billings Index recorded its highest score in 2016 at 53.1, according to the latest report by the American Institute of Architects. The ABI rose from 50.6 in April for its fourth consecutive month of increase in design activity.
“Business conditions at design firms have hovered around the break-even rate for the better part of this year,” said AIA Chief Economist, Kermit Baker, Hon. AIA, PhD in a press release. “Demand levels are solid across the board for all project types at the moment. Of particular note, the recent surge in design activity for institutional projects could be a harbinger of a new round of growth in the broader construction industry in the months ahead.”
Key May ABI highlights:
Regional averages: West (53.8), South (53.7), Northeast (51.2), Midwest (49.9)
Sector index breakdown: multi-family residential (53.7), institutional (53.0), commercial / industrial (51.0), mixed practice (51.0),
Project inquiries index: 60.1
Design contracts index: 52.8
About the AIA Architecture Billings Index
The Architecture Billings Index (ABI) is considered a leading economic indicator of construction activity, and reflects the approximate nine to twelve month lead time between architecture billings and construction spending. The regional and sector categories are calculated as a 3-month moving average, whereas the national index, design contracts and inquiries are monthly numbers. The monthly ABI index scores are centered around the neutral mark of 50, with scores above 50 indicating growth in billings and scores below 50 indicating a decline.
Below is a graph showing the history of the Architectural Billings Index and Inquiries Index. You will need to view the graph on our website to use it’s interactive features, you can do so by clicking here. If you need assistance with either logging in or navigating the website, please contact our office at 800-432-3475 or info@SteelMarketUpdate.com.