

Market Data

April 11, 2018
Import Market Share Shows Declines
Written by Peter Wright
Steel Market Update’s new analysis of sheet, plate, long and tubular product imports and their 18 subcategories is still a work in progress, but it offers a timely means to examine the effects of the Section 232 legislation on the market.
Table 1 shows total supply to the market in three months through February and in 12 months through February for the four product groups and the 18 subcategories. Supply to the market is the total of domestic mill shipments to domestic locations plus imports. It shows imports on the same three- and twelve-month basis and then calculates import market share for the two periods for 18 products. Finally, it subtracts the 12-month share from the three-month share and color codes the result green or red. If the result of the subtraction is positive, it means that the import share is increasing, and the code is red. The big picture is that in most cases the import share is declining. Exceptions are HR sheet, HR bars, standard pipe, line pipe and OCTG.
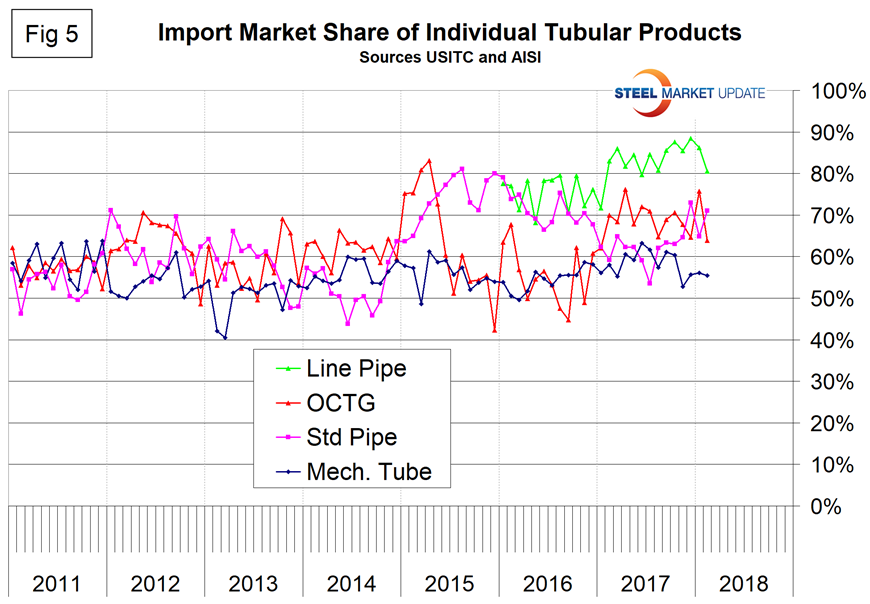
There is a huge difference in import market share between products, with tubular goods being by far the worst case. In the tubular section of Table 1, the import share of structural tubing is blank because the AISI data prior to March 2017 made no sense and we have not included it.
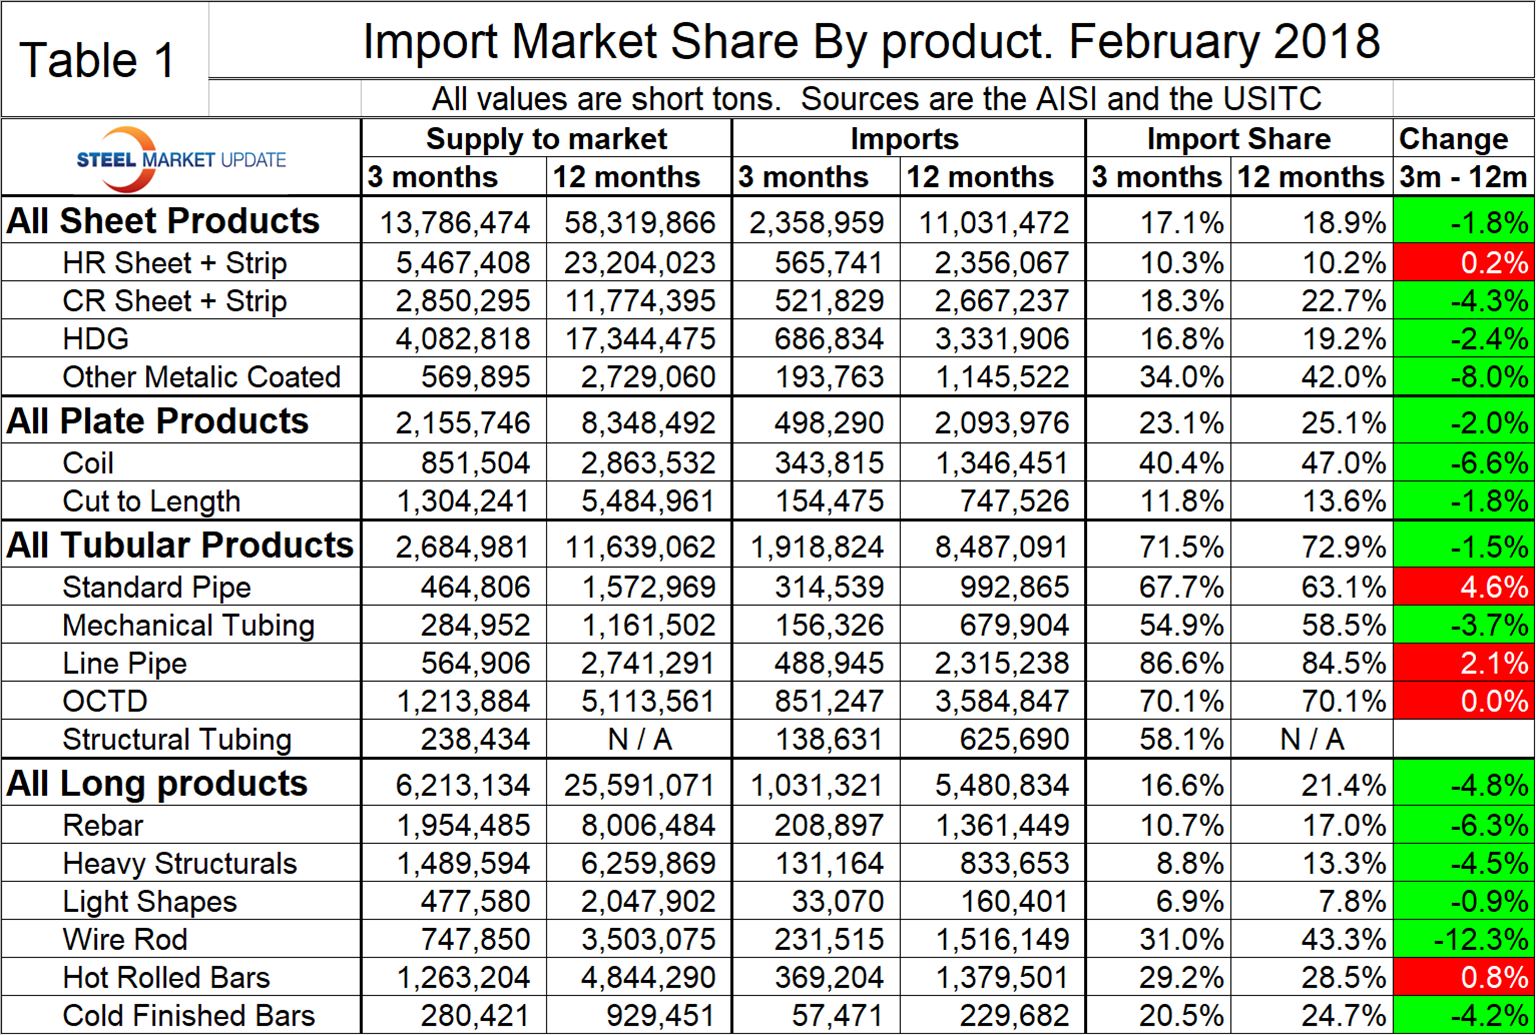
Figure 1 shows the historical import market share of plate and total sheet products. The import share of both has been decreasing for three years, though more so for plate which started at a higher level.
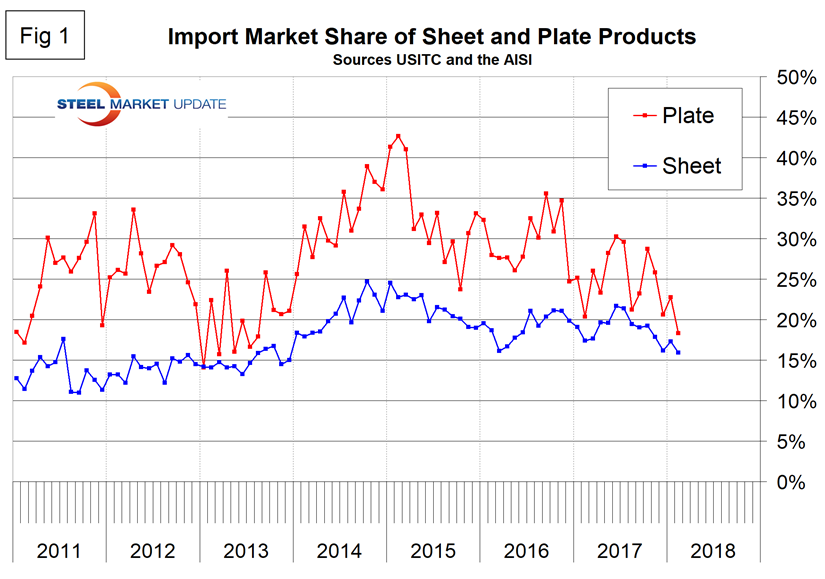
Figure 2 shows the import market share of the four major sheet products. Other metallic coated, (mainly Galvalume) has by far the highest import market share and hot rolled has the lowest.
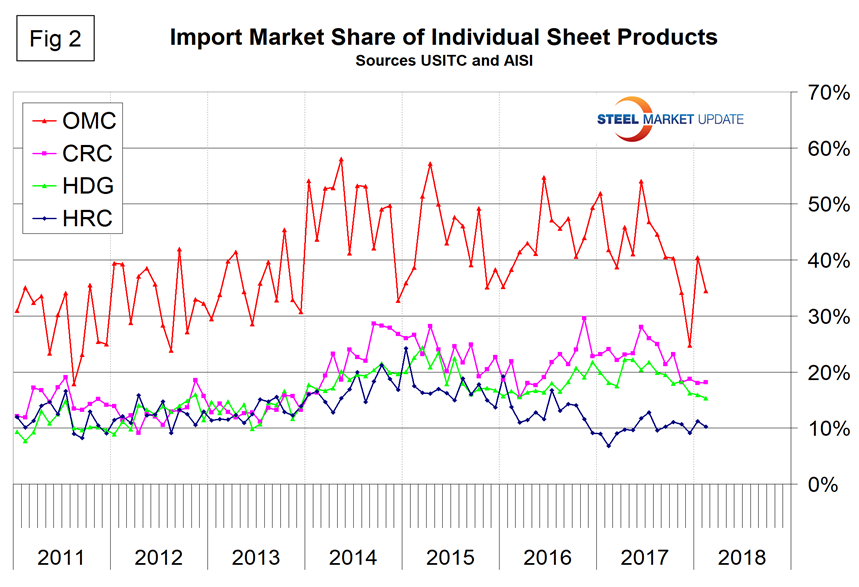
Figure 3 breaks out coiled and CTL plate from the total and shows that coil imports currently have three times the market share of CTL imports.
Figure 4 describes the total import share of tubular goods and long products. Imports of tubular goods have by far the highest market share of any product group. We are not impressed with the quality of the AISI data for tubular goods, probably because this is a more fragmented supply chain and the independent tubers aren’t reporting to the extent that the steel mills do for other products. Therefore, we don’t include structural tubing in Figure 5 and line pipe only starts in 2016. It does appear that this data is improving with time and that the numbers post March 2017 are believable. The import share of long products has decreased by almost 50 percent since June last year.
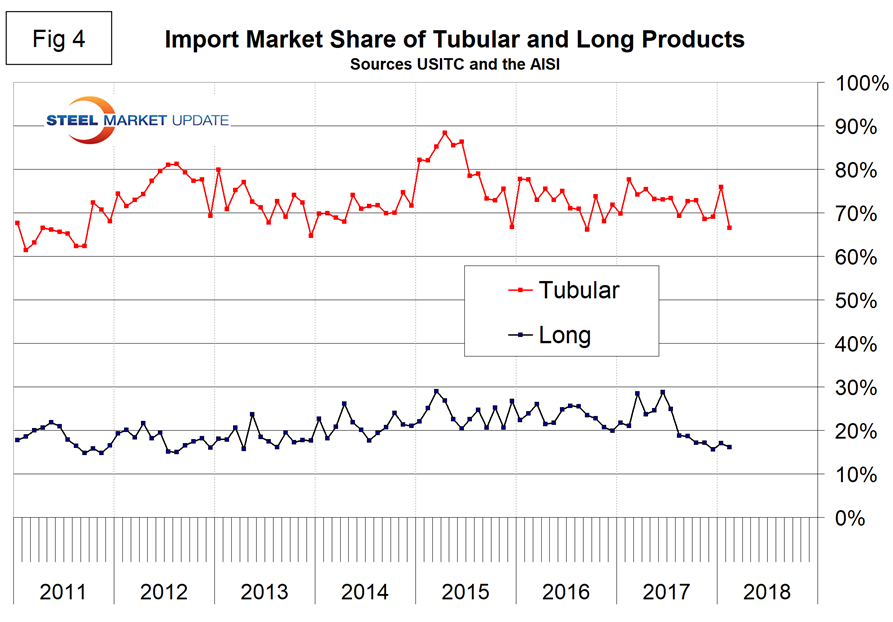
Figure 5 shows the import market share of the individual tubular products. All are very high compared to other steel product groups and line pipe is the worst.
This month we have drilled down into the subcategories of plate and tubular products. Next month we will complete the analysis by examining the import market share of individual long products.


