Prices

May 1, 2019
SMU Analysis: Regional Hot Rolled Coil Imports
Written by Peter Wright
The Great Lakes continues to be the highest volume district of entry for hot rolled coil, and the Pacific South had the highest rate of increase year to date through February, according to Steel Market Update’s latest analysis of government data.
![]()
SMU now offers a comprehensive series of import reports ranging from the first look at license data to the very detailed look at volume by district of entry and source nation. The report you are reading now is designed to plug the gap between these two. Our intention is to report regional imports for two of six flat rolled products each month. This month (April), we are reporting on hot and cold rolled sheet through February. Next month, we will report on coiled and cut-to-length plate, and in June we will report on coated products.
National level import reports do a good job of measuring the overall market pressure caused by the imports of individual products. The downside is that there are huge regional differences. Figure 1 shows the year-to-date tonnage into each region and the dominance of the Great Lakes region.
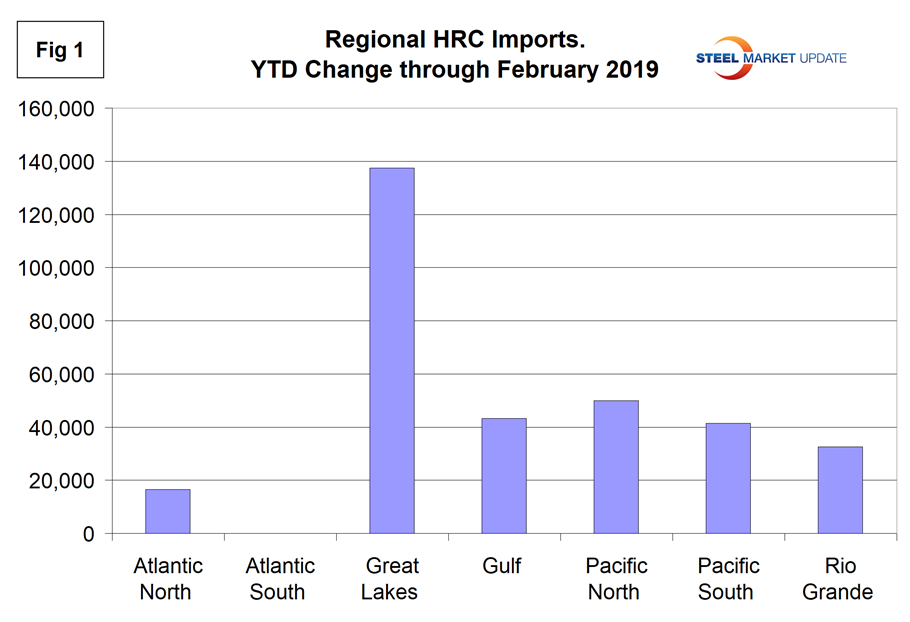
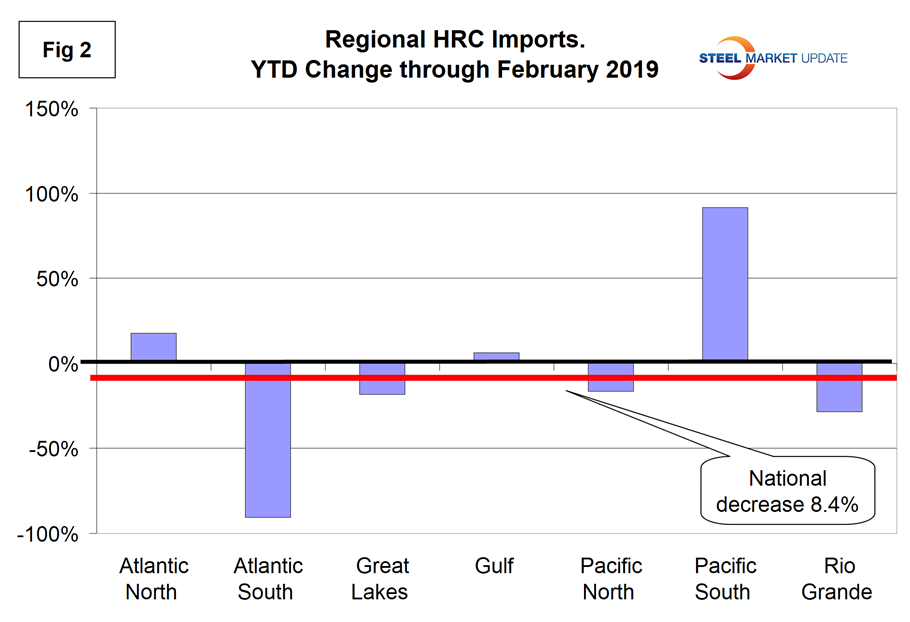
Figure 2 shows the year-to-date change for each of seven regions and the change at the national level. The large decrease in the Atlantic South region is not relevant because volume is very low. Volume declined at the national level by 8.4 percent, but increased by 91.5 percent in the Pacific South.
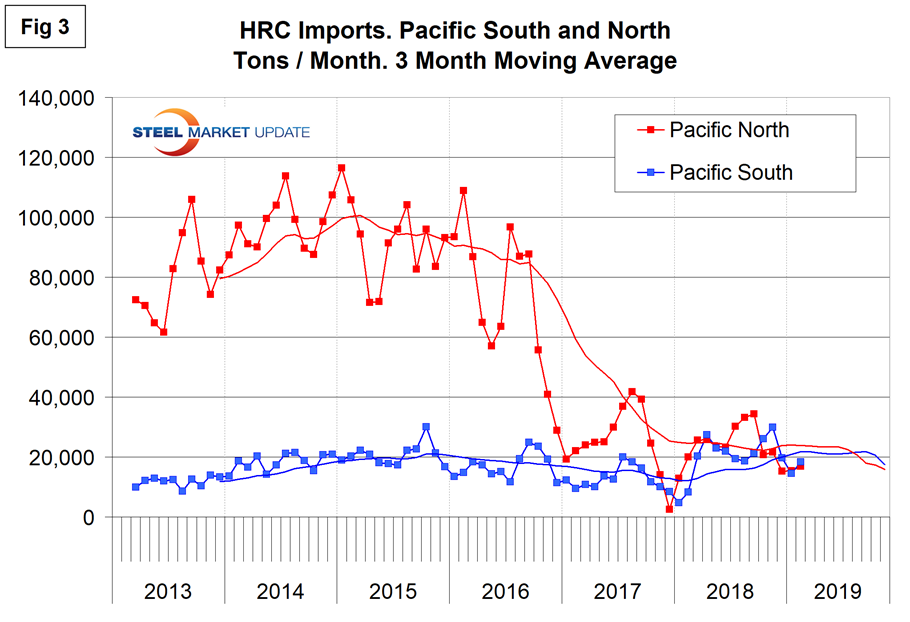
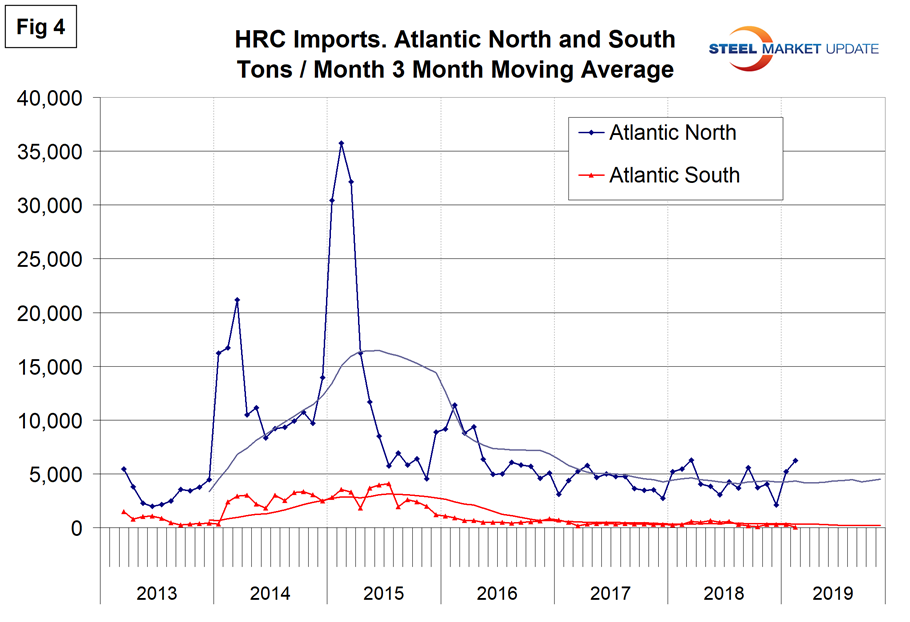
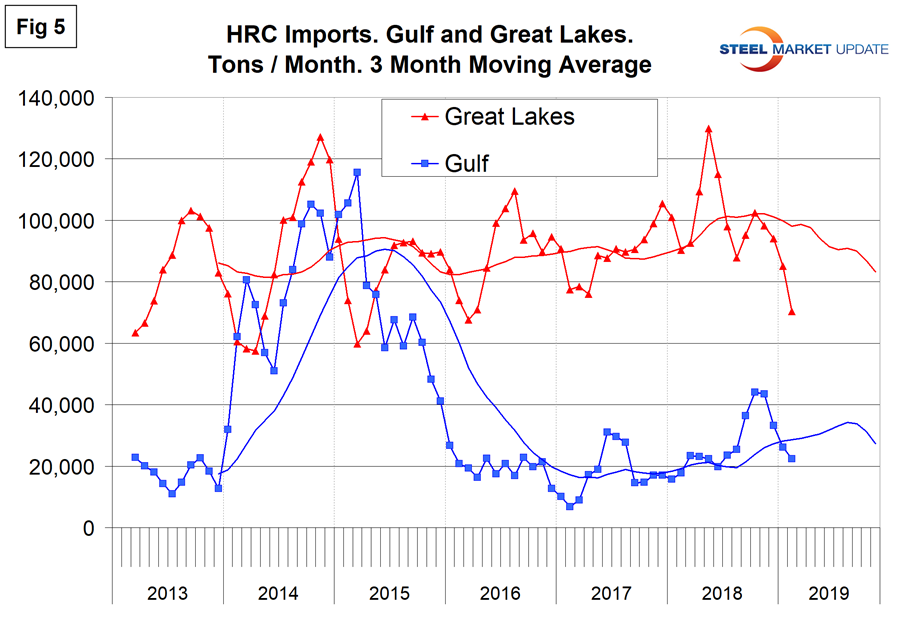
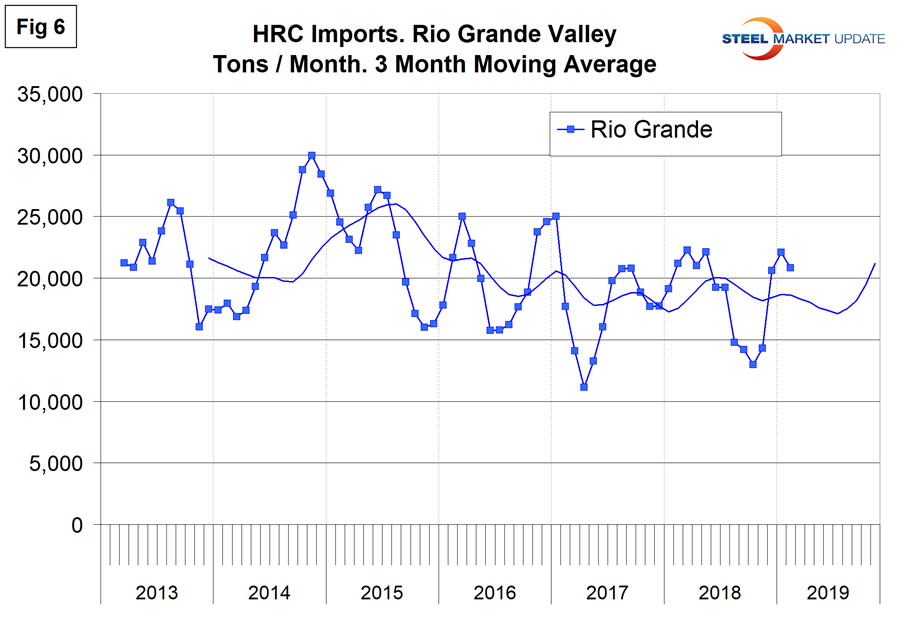
Figures 3, 4, 5 and 6 show the history of HRC coil imports by region since March 2013 on a three-month moving average basis.
Imports into the Pacific North have declined by 80 percent from the levels experienced in 2014 and 2015. Volume into the Pacific South has been fairly consistent since 2014.
Imports into the Atlantic South have been almost nonexistent since 2016, and into the Atlantic North have been quite consistent and of low volume in the same time frame.
Hot rolled coil imports into the Gulf declined drastically in 2015 and have been consistently around 20,000 tons per month since then. Volume into the Great Lakes has declined every month since last October.
Tonnage out of Mexico, almost all through Laredo, has been drifting down for over four years and through February year to date was down by 28.4 percent.
This data comes from the USITC, which has still not recovered from the government shutdown. February data should have been released by April 8 but was not released until April 22. Hopefully they will be caught up next month and premium subscribers will have access to detailed reports by district and source nation on our website.
Regions are compiled from the following districts:
Atlantic North: Baltimore, Boston, New York, Ogdensburg, Philadelphia, Portland ME, St. Albans and Washington, DC.
Atlantic South: Charleston, Charlotte, Miami, Norfolk and Savannah.
Great Lakes: Buffalo, Chicago, Cleveland, Detroit, Duluth. Great Falls, Milwaukee, Minneapolis and Pembina.
Gulf: Houston, New Orleans, Mobile, San Juan, St. Louis and Tampa.
Pacific North: Anchorage, Columbia Snake, San Francisco and Seattle.
Pacific South: Los Angeles and San Diego.
Rio Grande Valley: Laredo and El Paso.