Market Data

October 1, 2019
Global Scrap Market: U.S. Share on the Increase
Written by Peter Wright
The global market share of U.S. scrap exports continues to increase, according to this quarterly analysis of data from the Iron and Steel Statistics Bureau (ISSB) in the UK. We believe that to improve our understanding of the gyrations of the domestic scrap market, we should be aware of where the U.S. stands as a global player. Some nations are slow to report, which results in our analysis being a quarter in arrears, but we believe it gives a valuable perspective of global trends and is the foundation of where we are today. All tonnages in this report are metric.
In this analysis of global scrap trade, we have excluded movements within the EU from the global total. Figures 1 and 2 show the total tonnage of global trade since Q1 2000 and the volume of the top five suppliers. These five are the U.S., the EU, the UK, Japan and Russia and since 2002 they have accounted for over two-thirds of the total. Figure 2 is the same as Figure 1 with the total removed. Total global trade in ferrous scrap has been increasing erratically since Q1 2016, and the U.S. export tonnage has increased disproportionally in the same time frame.
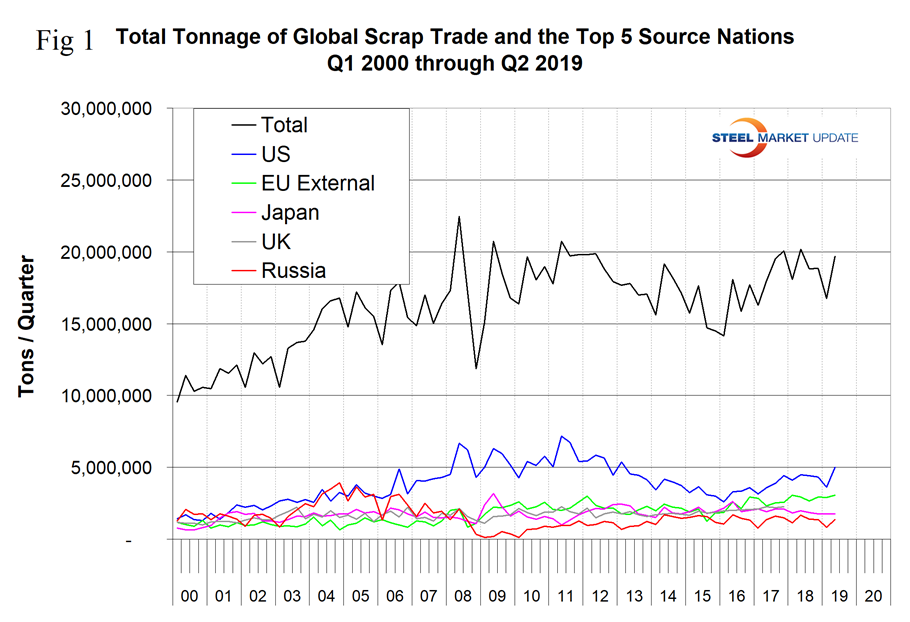
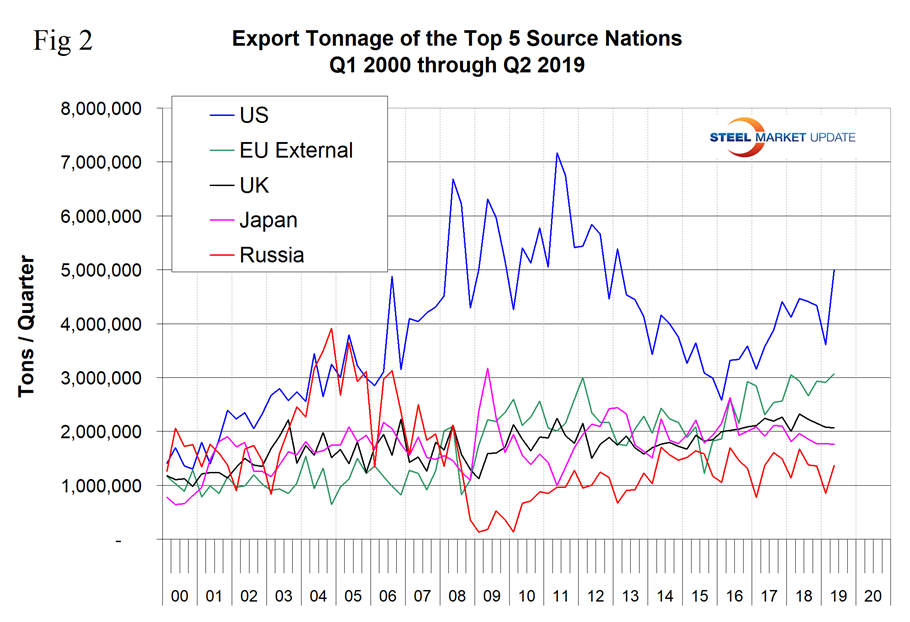
Figure 3 shows the global market share of the top five exporters. After declining for seven years from 2008 through 2015, the U.S. share increased in the three and a half years from 2016 through Q2 2019. The U.S. has been the highest volume exporter every quarter since Q4 2005.
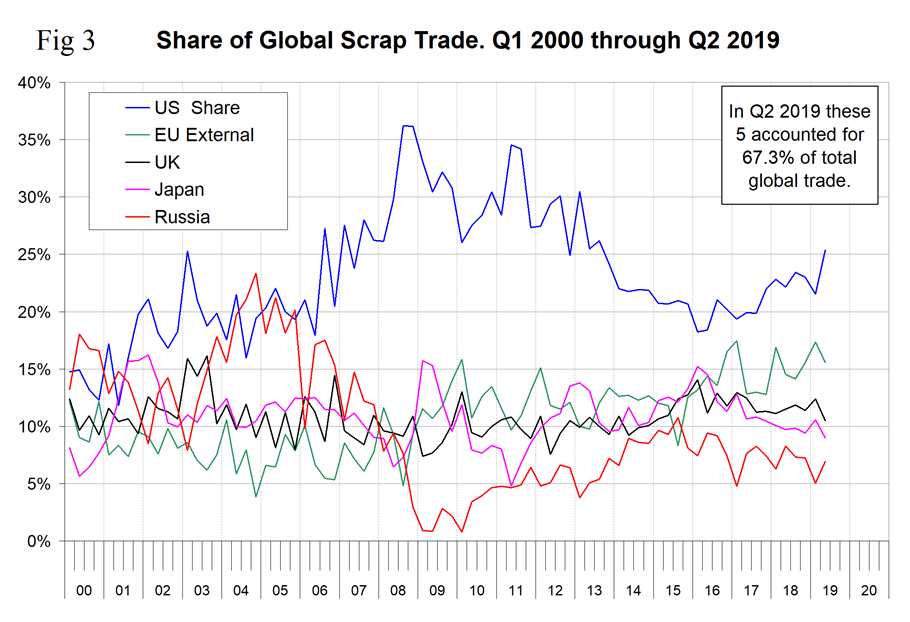
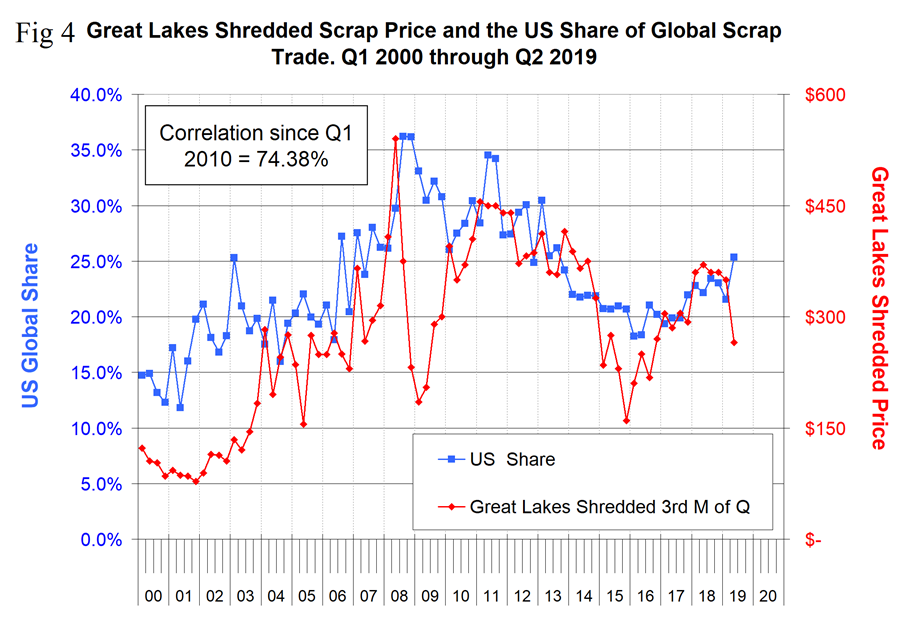
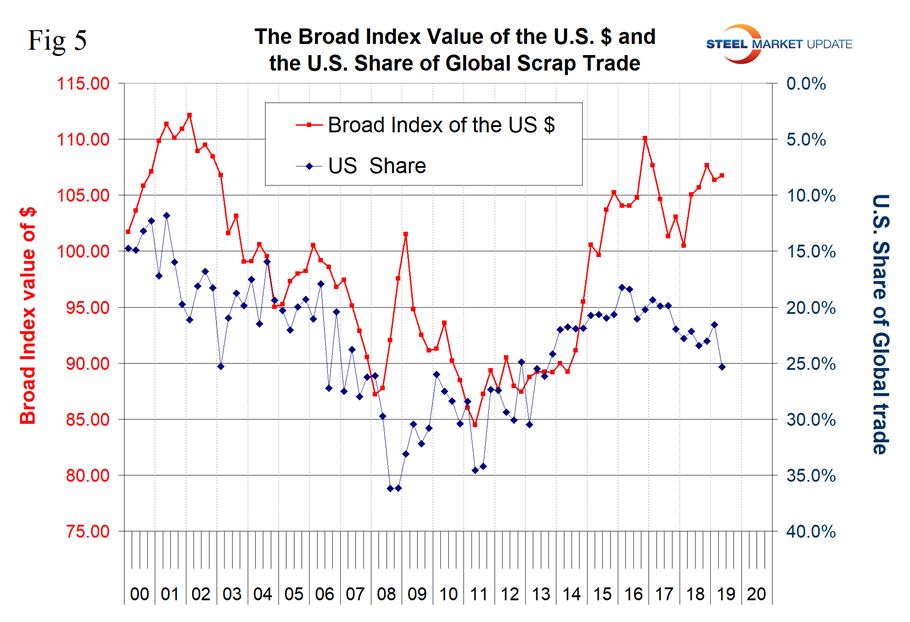
Figure 4 shows the correlation of 74.4 percent since 2010 between the U.S. share of global scrap trade and the domestic scrap price. This makes sense and tells us that export demand is a driver of the domestic scrap price. Figure 5 shows a negative correlation between the Broad Index value of the U.S. dollar and the U.S. share of global trade. This is a causal relationship—when the dollar strengthens, U.S. scrap on the global market becomes more expensive and the U.S. share should decline. Prior to Q4 2014 there was a negative 71 percent correlation between the U.S. dollar and U.S global share. Since then the two have decoupled, which we believe is due to a stronger U.S. economy that has boosted mill output and by extension domestic scrap demand and the distortive effects of Section 232 tariffs.
Digging deeper into the ISSB data this quarter to identify the top 10 importing nations revealed two surprises (see table). That the U.S. is the third highest volume importer and that Vietnam has become the fifth. Of the total 7.3 million metric tons imported by the U.S., 4.3 million came from Canada and 0.9 million from Mexico.
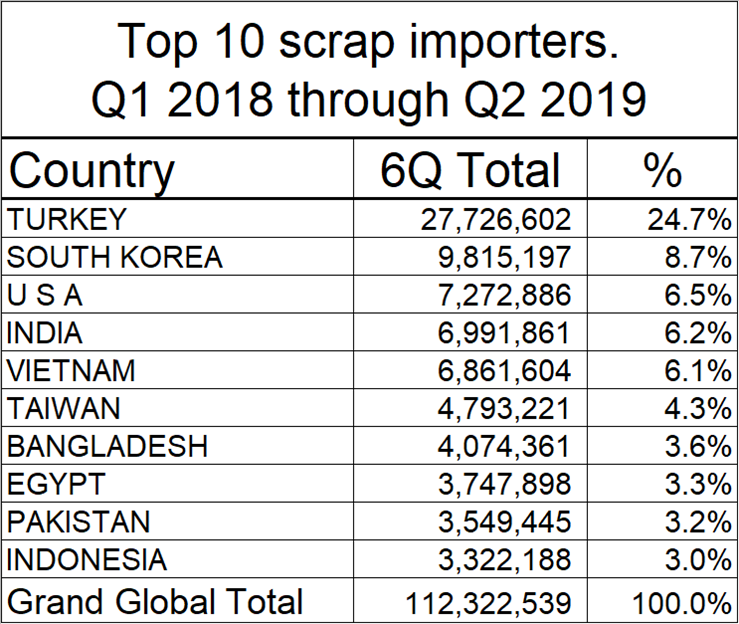
Figure 6 shows the tonnage received by the four major importing nations (excluding the U.S.). Turkey is by far the largest global scrap buyer, but imports into Turkey declined acutely in 2018 before recovering partially in the first half of 2019. The growth of Vietnam is clearly shown since Q4 2006 to the point that in Q2 2019, Vietnam accounted for 6.5 percent of total global scrap trade.
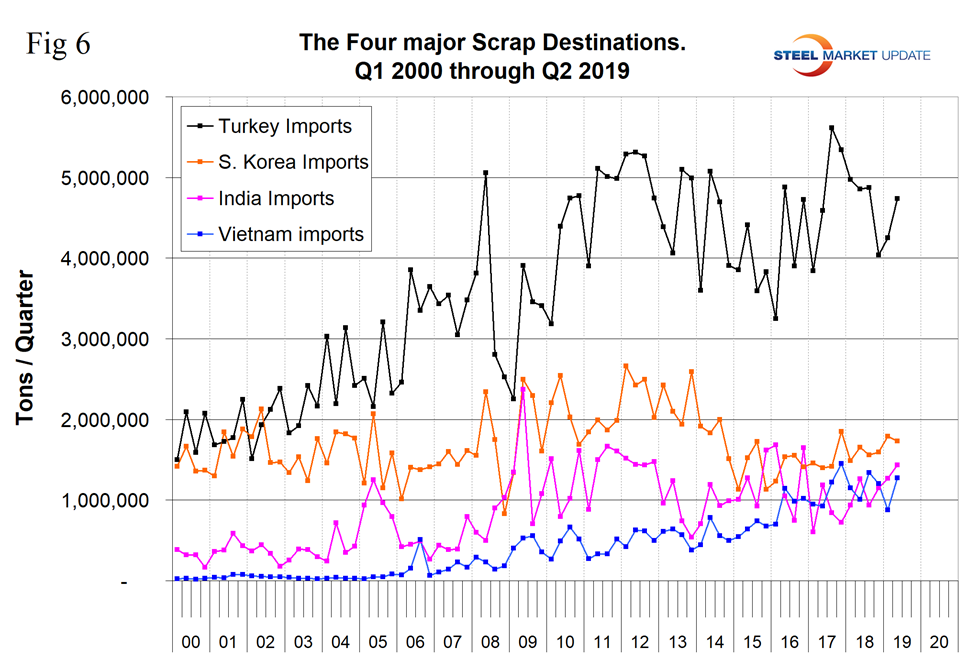
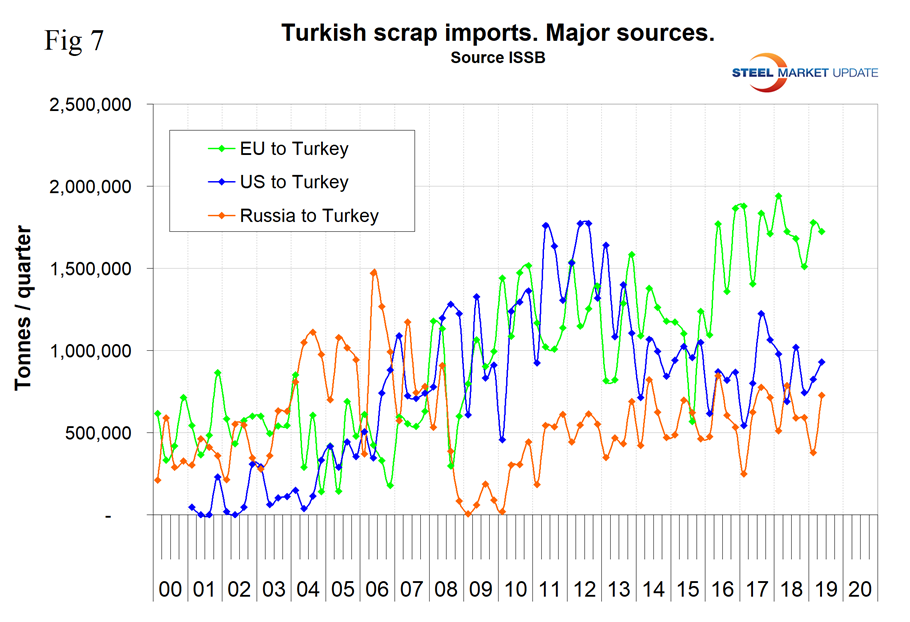
Figure 7 quantifies the volume of the three major scrap suppliers to Turkey since the year 2000. Since Q1 2016 the EU has strengthened its position as the U.S. and Russia have been erratically stable.
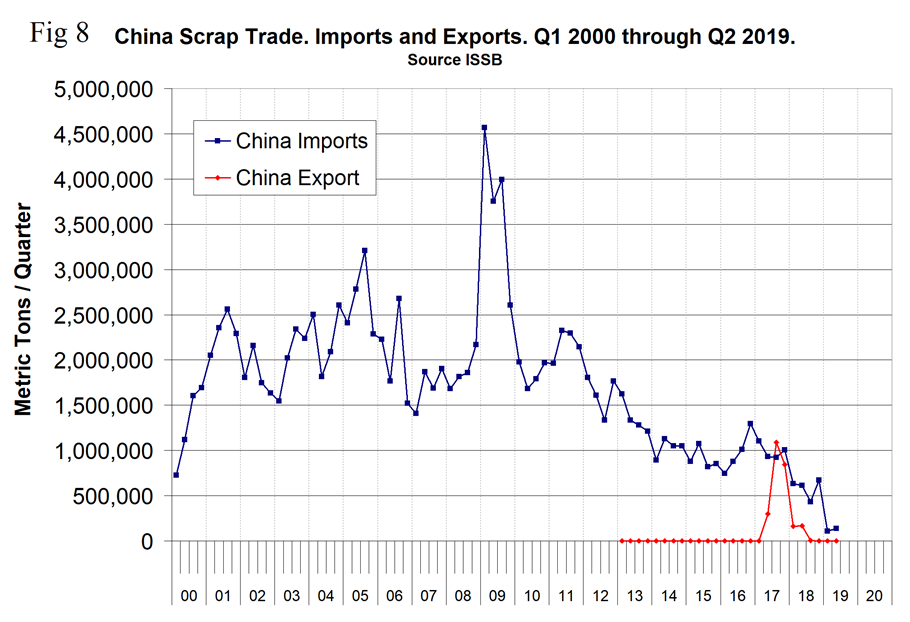
In the course of these analyses, we will keep our eye on what is going on in China. In the third quarter of 2017, China became a net scrap exporter, according to data published by their trade administration. Since then China’s exports have declined to almost zero as the government has restricted its scrap exports. In 2018 almost all scrap exporters were fined or jailed for violating the restrictions and evading taxes on the value of the material. Eventually this will change as the balance of BOF and EAF capacity in China will not be able to absorb the volume of obsolete scrap produced.