Prices

January 23, 2020
Hot Rolled Futures: Ferrous Notes
Written by Jack Marshall
The following article on the hot rolled coil (HRC) steel and financial futures markets was written by Jack Marshall of Crunch Risk LLC. Here is how Jack saw trading over the past week:
Steel
The HR futures curve, while higher in the near months, has shifted lower from Q2’20 through the end of 2020. Recent index prices for HR suggest physical has been trading around $600/ST, well short of the mill prices recently announced, which were indicated around $680/ST.
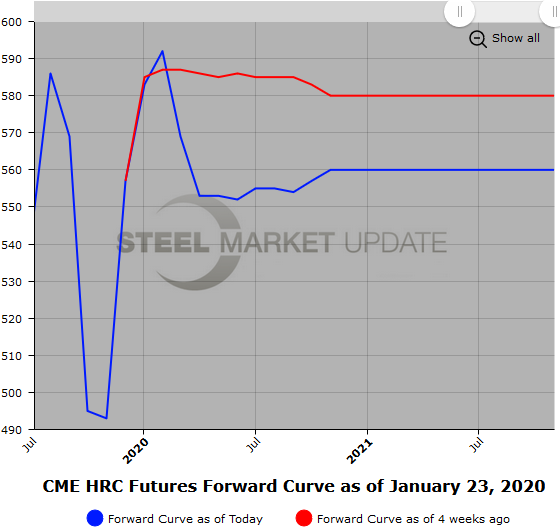
Thin buying interest for HR futures beyond the spot plus one month has been followed by active selling in Mar’20 HR through Q2’20 HR. This is perhaps due to delayed restocking on the back of multiple price increases. While Feb’20 HR is about $5-7/ST higher than year end, the Q2’20 HR through Q4’20 HR has been sold lower by roughly $25/ST. Backwardation from front month to Dec’20 has increased from 8 back to 20 back. However, the curve from Q2’20 to Dec’20 remains relatively flat, trading just shy of $560/ST, so all the spread difference falls in the front of the curve.
Recent negative analysts’ reports for HR have likely led to some of the selling, however recent strength in HDG should help the supply/demand balance in HR. It’s likely buyers’ perspective will improve due to continued HR import declines, and the market should expect some restocking to occur as downstream demand recovers enough for additional HR demand.
Scrap
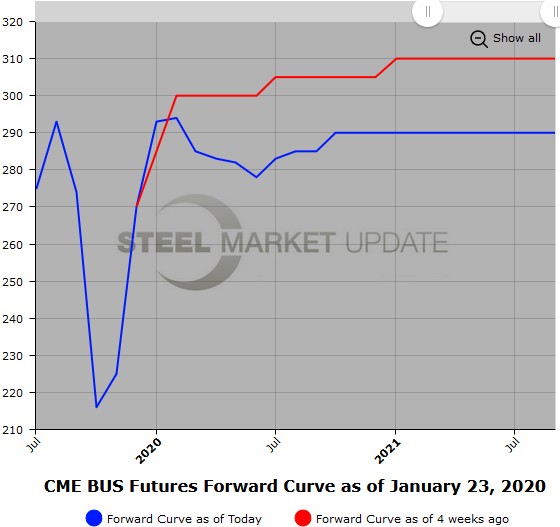
Early BUS chatter has the Feb’20 coming in around $10/GT down. The curve, which was basically $300-$305 for Feb’20 to Dec’20 at year end, has declined on average just under $20/GT. Feb’20 BUS futures have basically been $285/$295 per GT, and the following three months have been trading in the low to mid $280/GT level. The BUS curve is only slightly backwardated at roughly $5 to $10/GT. Some of the luster came off the BUS as export demand eased and some internal shortages were cleared up. However, increased capacity utilization rates at mills could be a sign that demand for BUS might be stronger than early discussions suggest.
Below is a graph showing the history of the CME Group hot rolled futures forward curve. You will need to view the graph on our website to use its interactive features; you can do so by clicking here. If you need assistance with either logging in or navigating the website, please contact us at info@SteelMarketUpdate.com.