Prices

December 3, 2020
HRC Futures: Rally Takes a Breather After Gaining $300 Since Memorial Day
Written by David Feldstein
Editor’s note: SMU Contributor David Feldstein is president of Rock Trading Advisors. David has over 20 years of trading experience in financial markets and has been active in the ferrous futures space for over eight years. You can learn more at www.thefeldstein.com or add him on twitter @TheFeldstein and on Instragram at #thefeldstein.
An aggressive buyer(s) emerged last Monday (June 29) in CME HR futures. The further loss of tons due to the accident at SDI’s Columbus mill and the longer-than-expected planned maintenance outage at Nucor Gallatin were just learned the week before, so perhaps there was follow-through buying or short covering in relation to the news. However, this buyer was a bit peculiar. This buyer wasn’t interested in the near-term months that would be most affected by these latest production issues, but rather Q2 and Q3 2022 and, as you can see below, the buying pushed some of those months up by twice as much as the closer months.
CME HRC Futures Curve
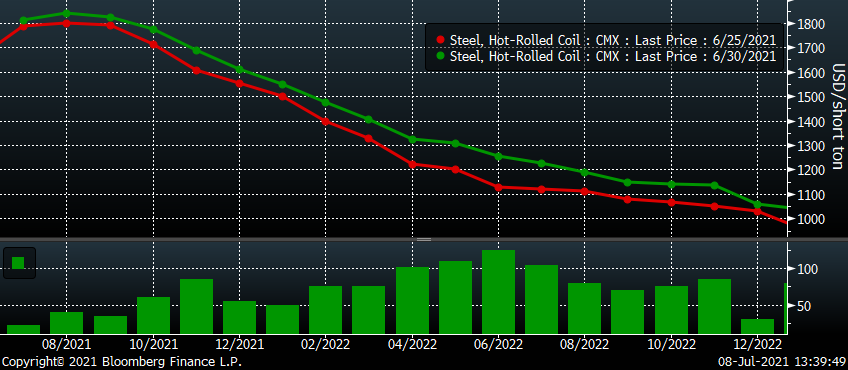
The open interest in those 2022 contracts was increasing, which refutes the idea that it was someone closing out positions ahead of the month or quarter’s end. Rather it looked like a market participant locking in pricing for 2022 probably related to their fiscal 2022 budget. It just so happened to be the end of the quarter and maybe there was a deadline involved. Since July started, there have been little to no trades in the second-half months of 2022. Moreover, futures prices peaked on June 30, slightly declining ever since. This despite further gains in all of the physical indices.
CME HRC Futures Curve
Last week, the ISM Manufacturing PMI once again printed above 60 for the fifth consecutive month. Roughly 50-100k tons were lost due to the production issues already described. May service center data remained extremely bullish. Contract season is getting closer and closer with the mills incentivized to keep prices elevated. The steel spot market remains dislocated with those most incentivized to keep prices up being the same ones in control of the few tons to be sold and used as the transactions with which to calculate the daily and weekly steel indices. Those indices which then price the significant volume of index-based contract tons.
These ultra-strong fundamentals pair well with the $300/t rally seen across the curve since Memorial day. It is hard to argue with the bull case, but have the futures gotten ahead of themselves?
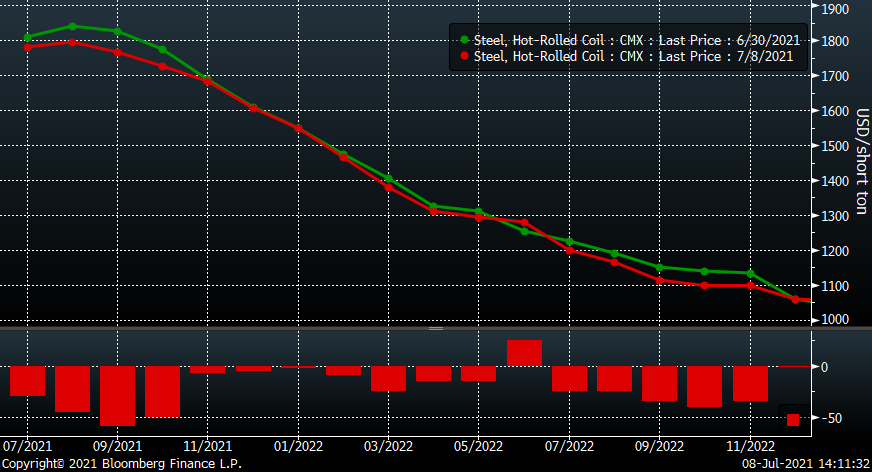
CME HRC Futures Curve
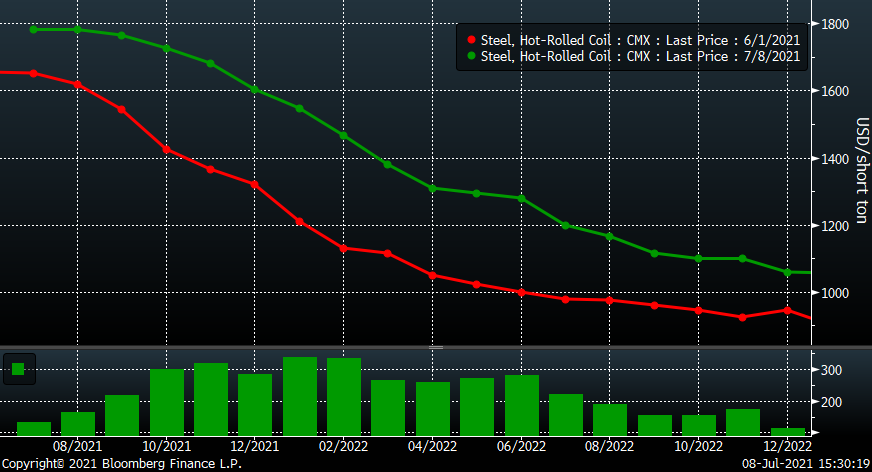
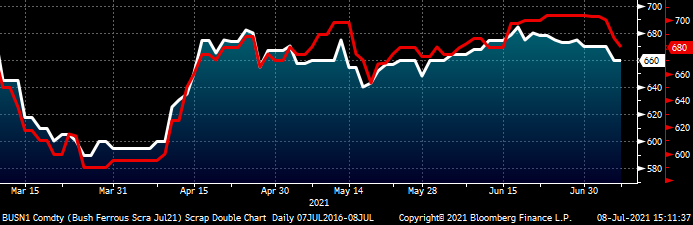
While it is hard to find weakness in the physical flat rolled market, the scrap market has been deflating. Initial expectations post June’s settlement have been lowered week after week. This chart shows the decline in the July and August future since mid-June.
CME July (white) and August (red) Busheling Futures
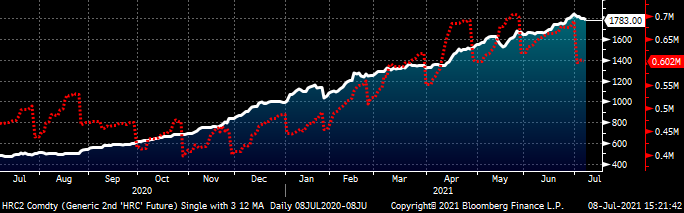
The rolling 2nd month CME future, now August, traded to a new all-time high of $1,878/st on June 30. Open interest in the HRC futures curve looks to be declining. Declining open interest in a rising market is defined to be a technically weak bull market. Prior to July, open interest had been increasing along with the rally in price, which is a technically strong bull market. Is this change meaningful? Declining price and declining open interest is considered to be a technically strong bear market. If the prices and open interest continue to decline, could that perhaps be the canary in the coal mine that this bull market is over?
Rolling 2nd Month CME Midwest HRC Future
Disclaimer: The content of this article is for informational purposes only. The views in this article do not represent financial services or advice. Any opinion expressed by Feldstein should not be treated as a specific inducement to make a particular investment or follow a particular strategy, but only as an expression of his opinion. Views and forecasts expressed are as of date indicated, are subject to change without notice, may not come to be and do not represent a recommendation or offer of any particular security, strategy or investment. Strategies mentioned may not be suitable for you. You must make an independent decision regarding investments or strategies mentioned in this article. It is recommended you consider your own particular circumstances and seek the advice from a financial professional before taking action in financial markets.