

Market Data

May 13, 2021
Shipments and Supply of Steel Products Head Up Again in March
Written by David Schollaert
Mill shipments of steel products improved by 18.3% in March compared to the month prior, while apparent supply increased by 18.1% during the same period. The double-digit gains are even more impressive considering their low performance in February, the first decline in both apparent supply and shipments of steel since the market reached bottom back in May 2020.
February’s poor performance was in part attributed to seasonal factors; however, the nearly 30-point swing for both shipments and supply month on month gives further evidence of rising demand despite soaring steel prices.
This analysis is based on steel mill shipment data from the American Iron and Steel Institute (AISI) and import-export data from the U.S. Department of Commerce (DOC). The analysis summarizes total steel supply by product from 2008 through March 2021 and year-on-year changes.
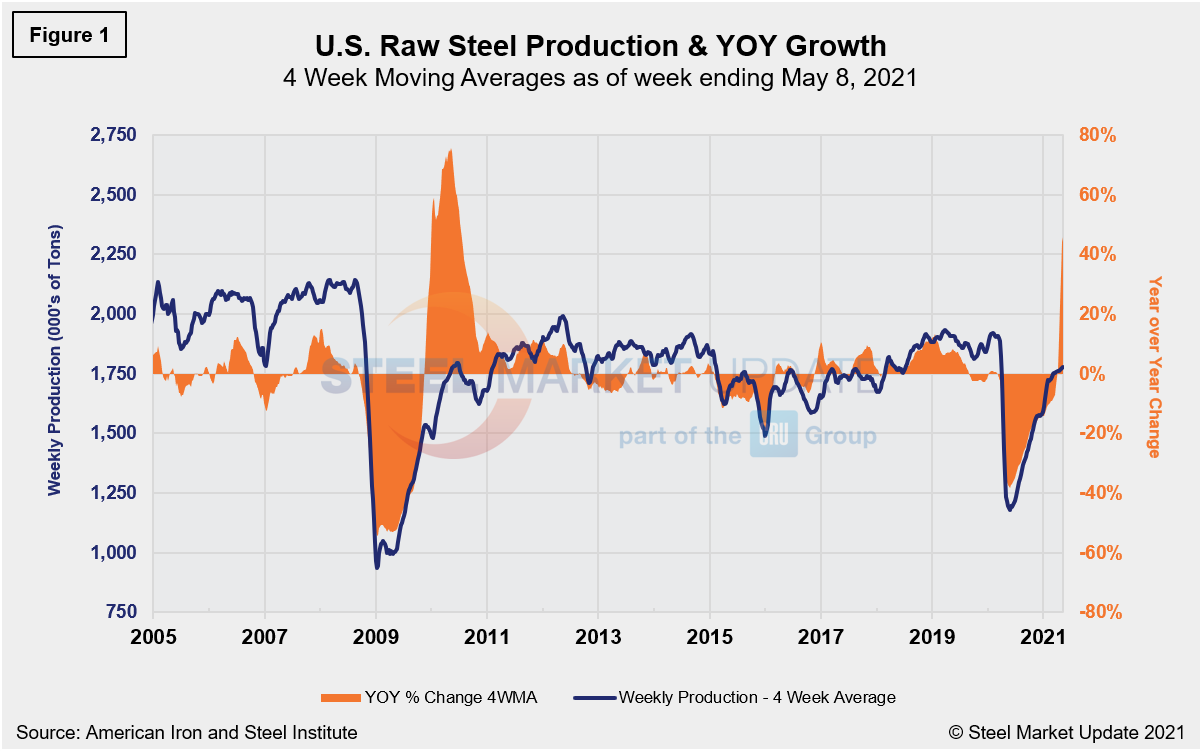
Pent-up demand continues to drive steel prices to unthinkable highs, pushing lead times out further as supply is unable to keep up. Since reaching bottom at $440 per ton in mid-August last year as the economy struggled with the pandemic, prices for HRC now average $1,540 per ton, topping the previous record high by nearly $500 and showing few signs of slowing. Despite strong efforts across the steel sector, shipments and supply of steel products have not yet returned to pre-pandemic levels. Since plummeting to a negative 37.3% in the week ending May 16, 2020, raw steel production continues to lag pre-COVID-19 output. Thus, contrasting production with year-ago levels can be misleading. If compared with the same period in 2019, however, production is down by 9.5%. These are four-week moving averages and are based on weekly data from the AISI in Figure 1 below.
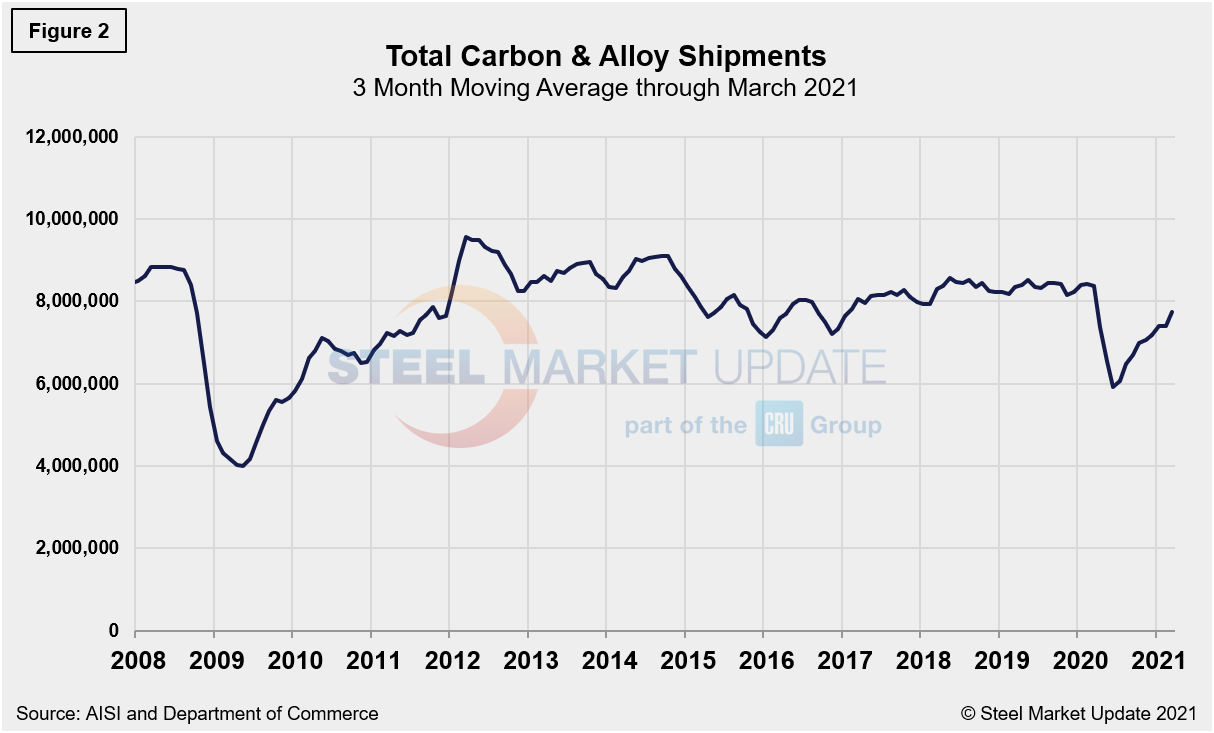
Monthly shipment data for all rolled steel products is noted in Figure 2. The trajectories of the rebounds since Q2 2020 are comparable in Figures 1 and 2. Measured as a three-month moving average (3MMA) of the monthly data, March’s total was 8.410 million tons, compared to 7.108 million tons in February, an 18.3% increase month on month. More importantly, shipments were above year-ago totals of 8.205 million tons by 2.5%.
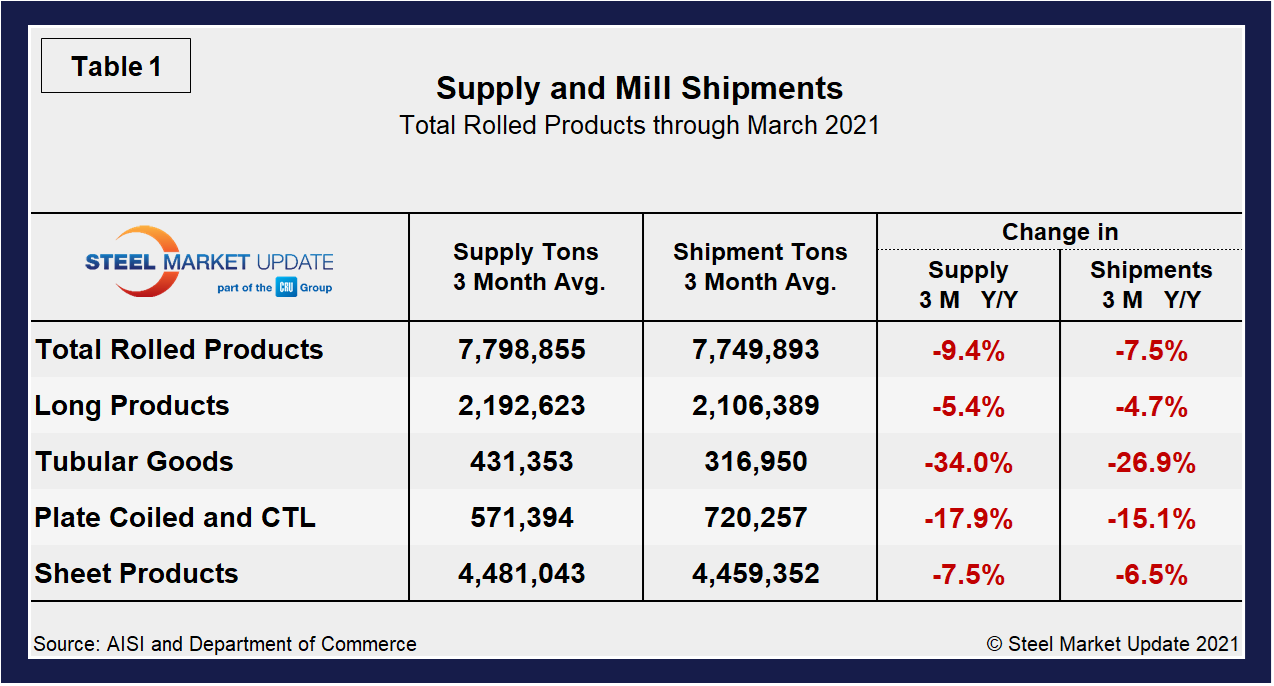
Shipment and supply details for all product groups are noted in Table 1, followed by individual sheet products in Table 2, and domestic supply (shipments and imports) in Table 3. Total supply (proxy for market demand) as a 3MMA was down by 9.4% year over year in March, but up from negative 14.1% in February and negative 28.1% last June when the market was at its lowest. Apparent supply is defined as domestic mill shipments to domestic locations plus imports. Mill shipments improved to a negative 7.5%, up from negative 12.2% in February, and substantially improved from negative 29.1% in June 2020. There is still a major variance between products. Even though a decline across all products was seen, tubular products continue to be the most affected at negative 34.0%, but a big improvement from negative 46.0% in January.
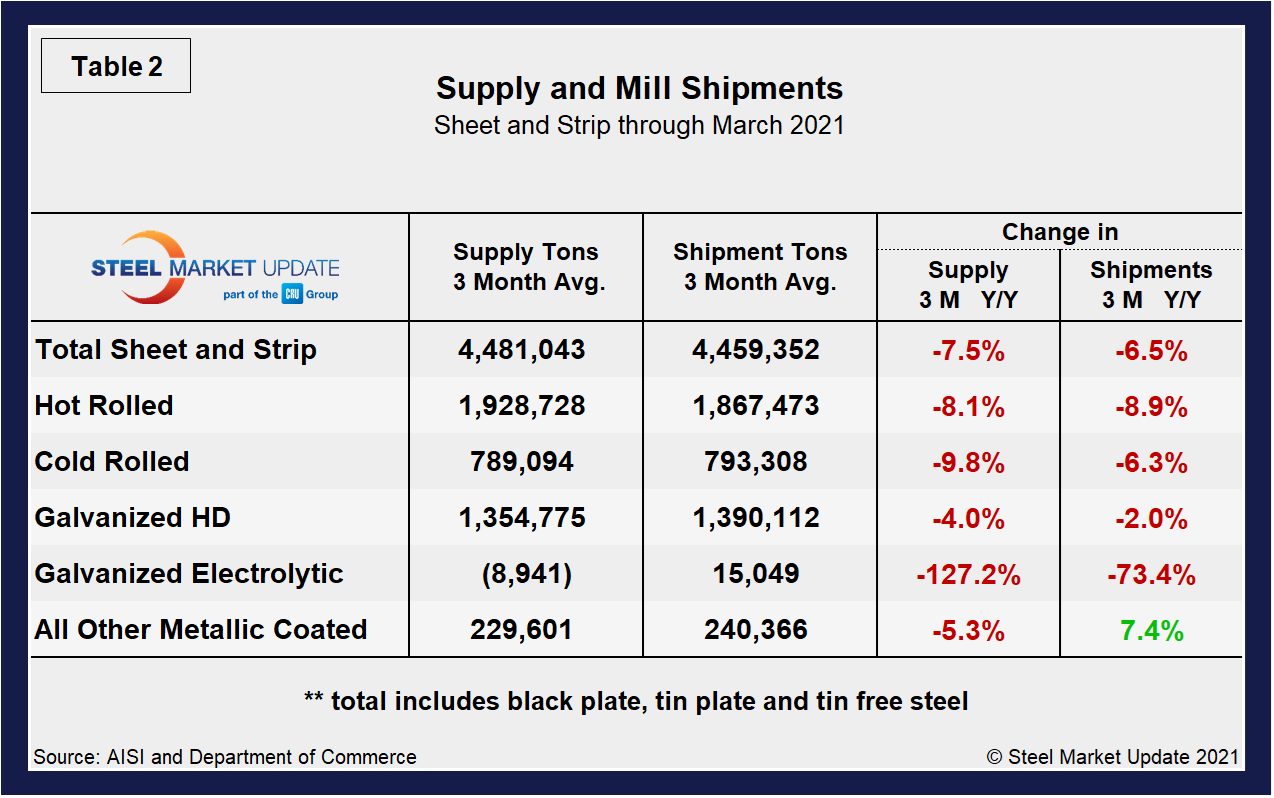
Overall sheet product shipments are down (Table 2), but so is supply. Despite posting a negative 8.1% in March, hot rolled has improved from negative 13.7% in February. In the three months through March 2021, the average monthly supply of sheet and strip was 4.481 million tons, down from 4.842 million tons or 7.5% from the year prior. Note that year-over-year comparisons have seasonality removed. Total sheet and strip product shipments were down by 7.5% year to date (Table 3) compared to 2020. As a 3MMA, however, it’s important to note that all products have continued to turn, in some cases, markedly.
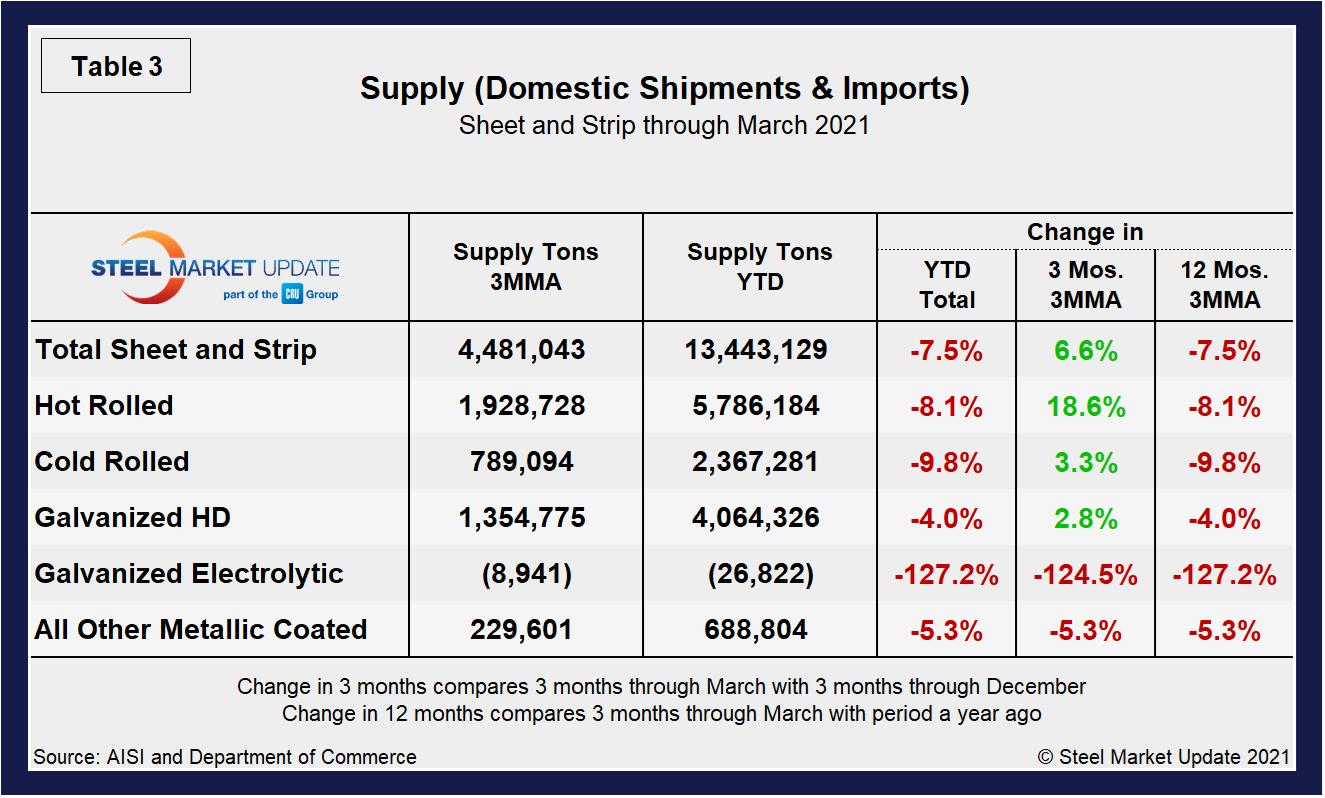
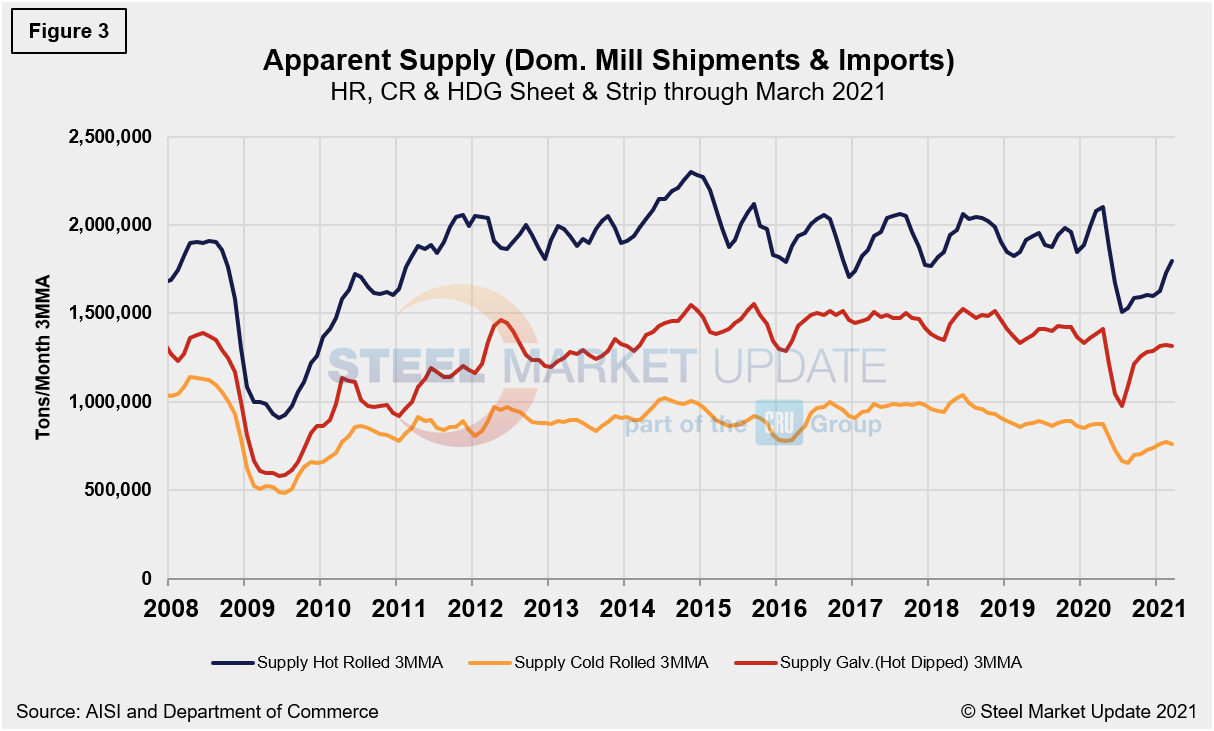
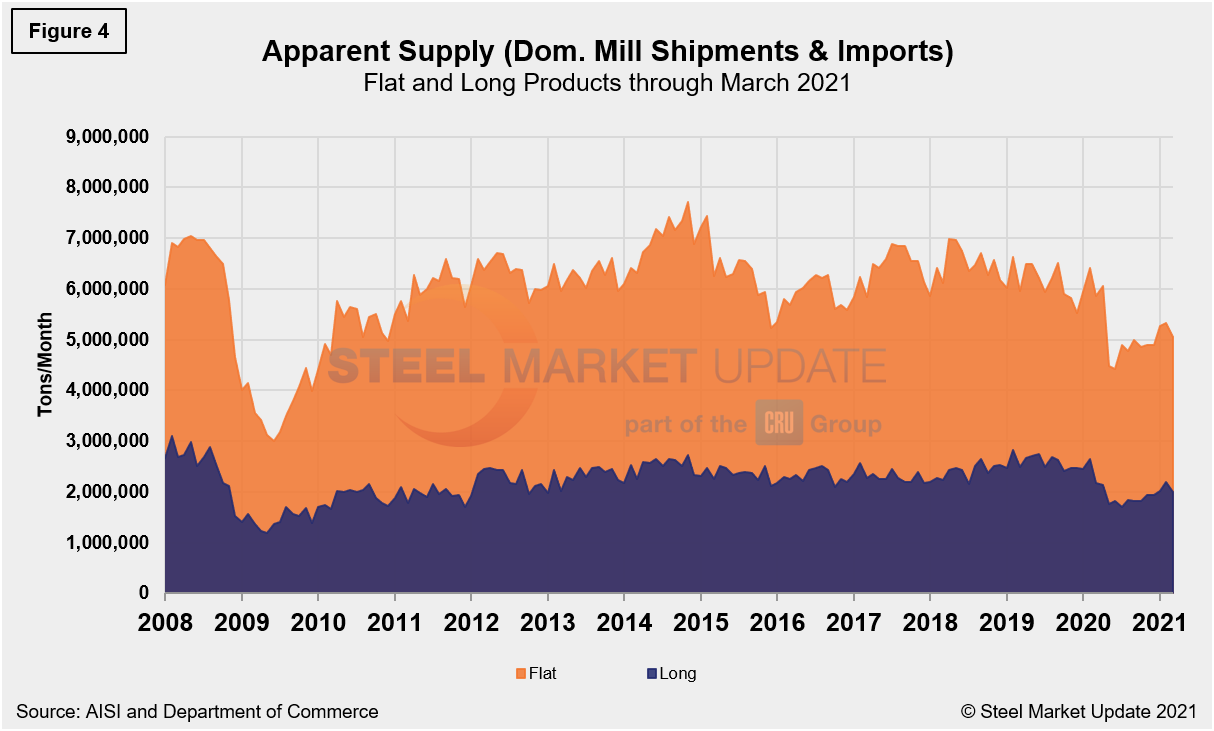
The supply picture for HRC, CRC and HDG since August 2008 as three-month moving averages in Figure 3 and Figure 4 show the long-term comparison between flat and long products. All three sheet products have experienced some improvement since mid-2020, but hot-dipped galvanized had seen a 38.5% jump since reaching bottom this past June, and rose 3.1% month on month in March after dipping by 0.8% the month prior. In Figure 4, note that these are monthly numbers (not 3MMAs), and clearly show the trend difference between longs and flat products including plate.
By David Schollaert, David@SteelMarketUpdate.com


