

Market Data

September 1, 2021
U.S. GDP Expands at Strong 6.6% Rate in Second Quarter
Written by David Schollaert
U.S. gross domestic product (GDP) grew by an estimated 6.6% in the second quarter of 2021, slightly faster than the 6.5% annual rate previously forecast, marking the fourth consecutive quarter of growth for the U.S. economy since the pandemic downturn, according to the Bureau of Economic Analysis (BEA).
The second estimate was adjusted higher thanks to upward revisions to personal consumption expenditures, nonresidential fixed investment, exports, and state and local government spending. Those were partially offset by decreases in private inventory investment, residential fixed investment and federal government spending, the BEA said.
The strong second-quarter growth came despite supply-chain disruptions and labor shortages that held the economy back. Thanks to government aid and businesses reopening, economic output eclipsed its pre-pandemic high, but it may come as a cautionary tale. Although the economy is still expanding at a robust pace, the coronavirus Delta variant flareup comes as government stimulus has mostly evaporated, potentially curbing third-quarter growth. Economists note that widespread shortages of labor and materials have caused inflation to soar – at a 6.5% annual clip in the second quarter – and threaten to slow the recovery.
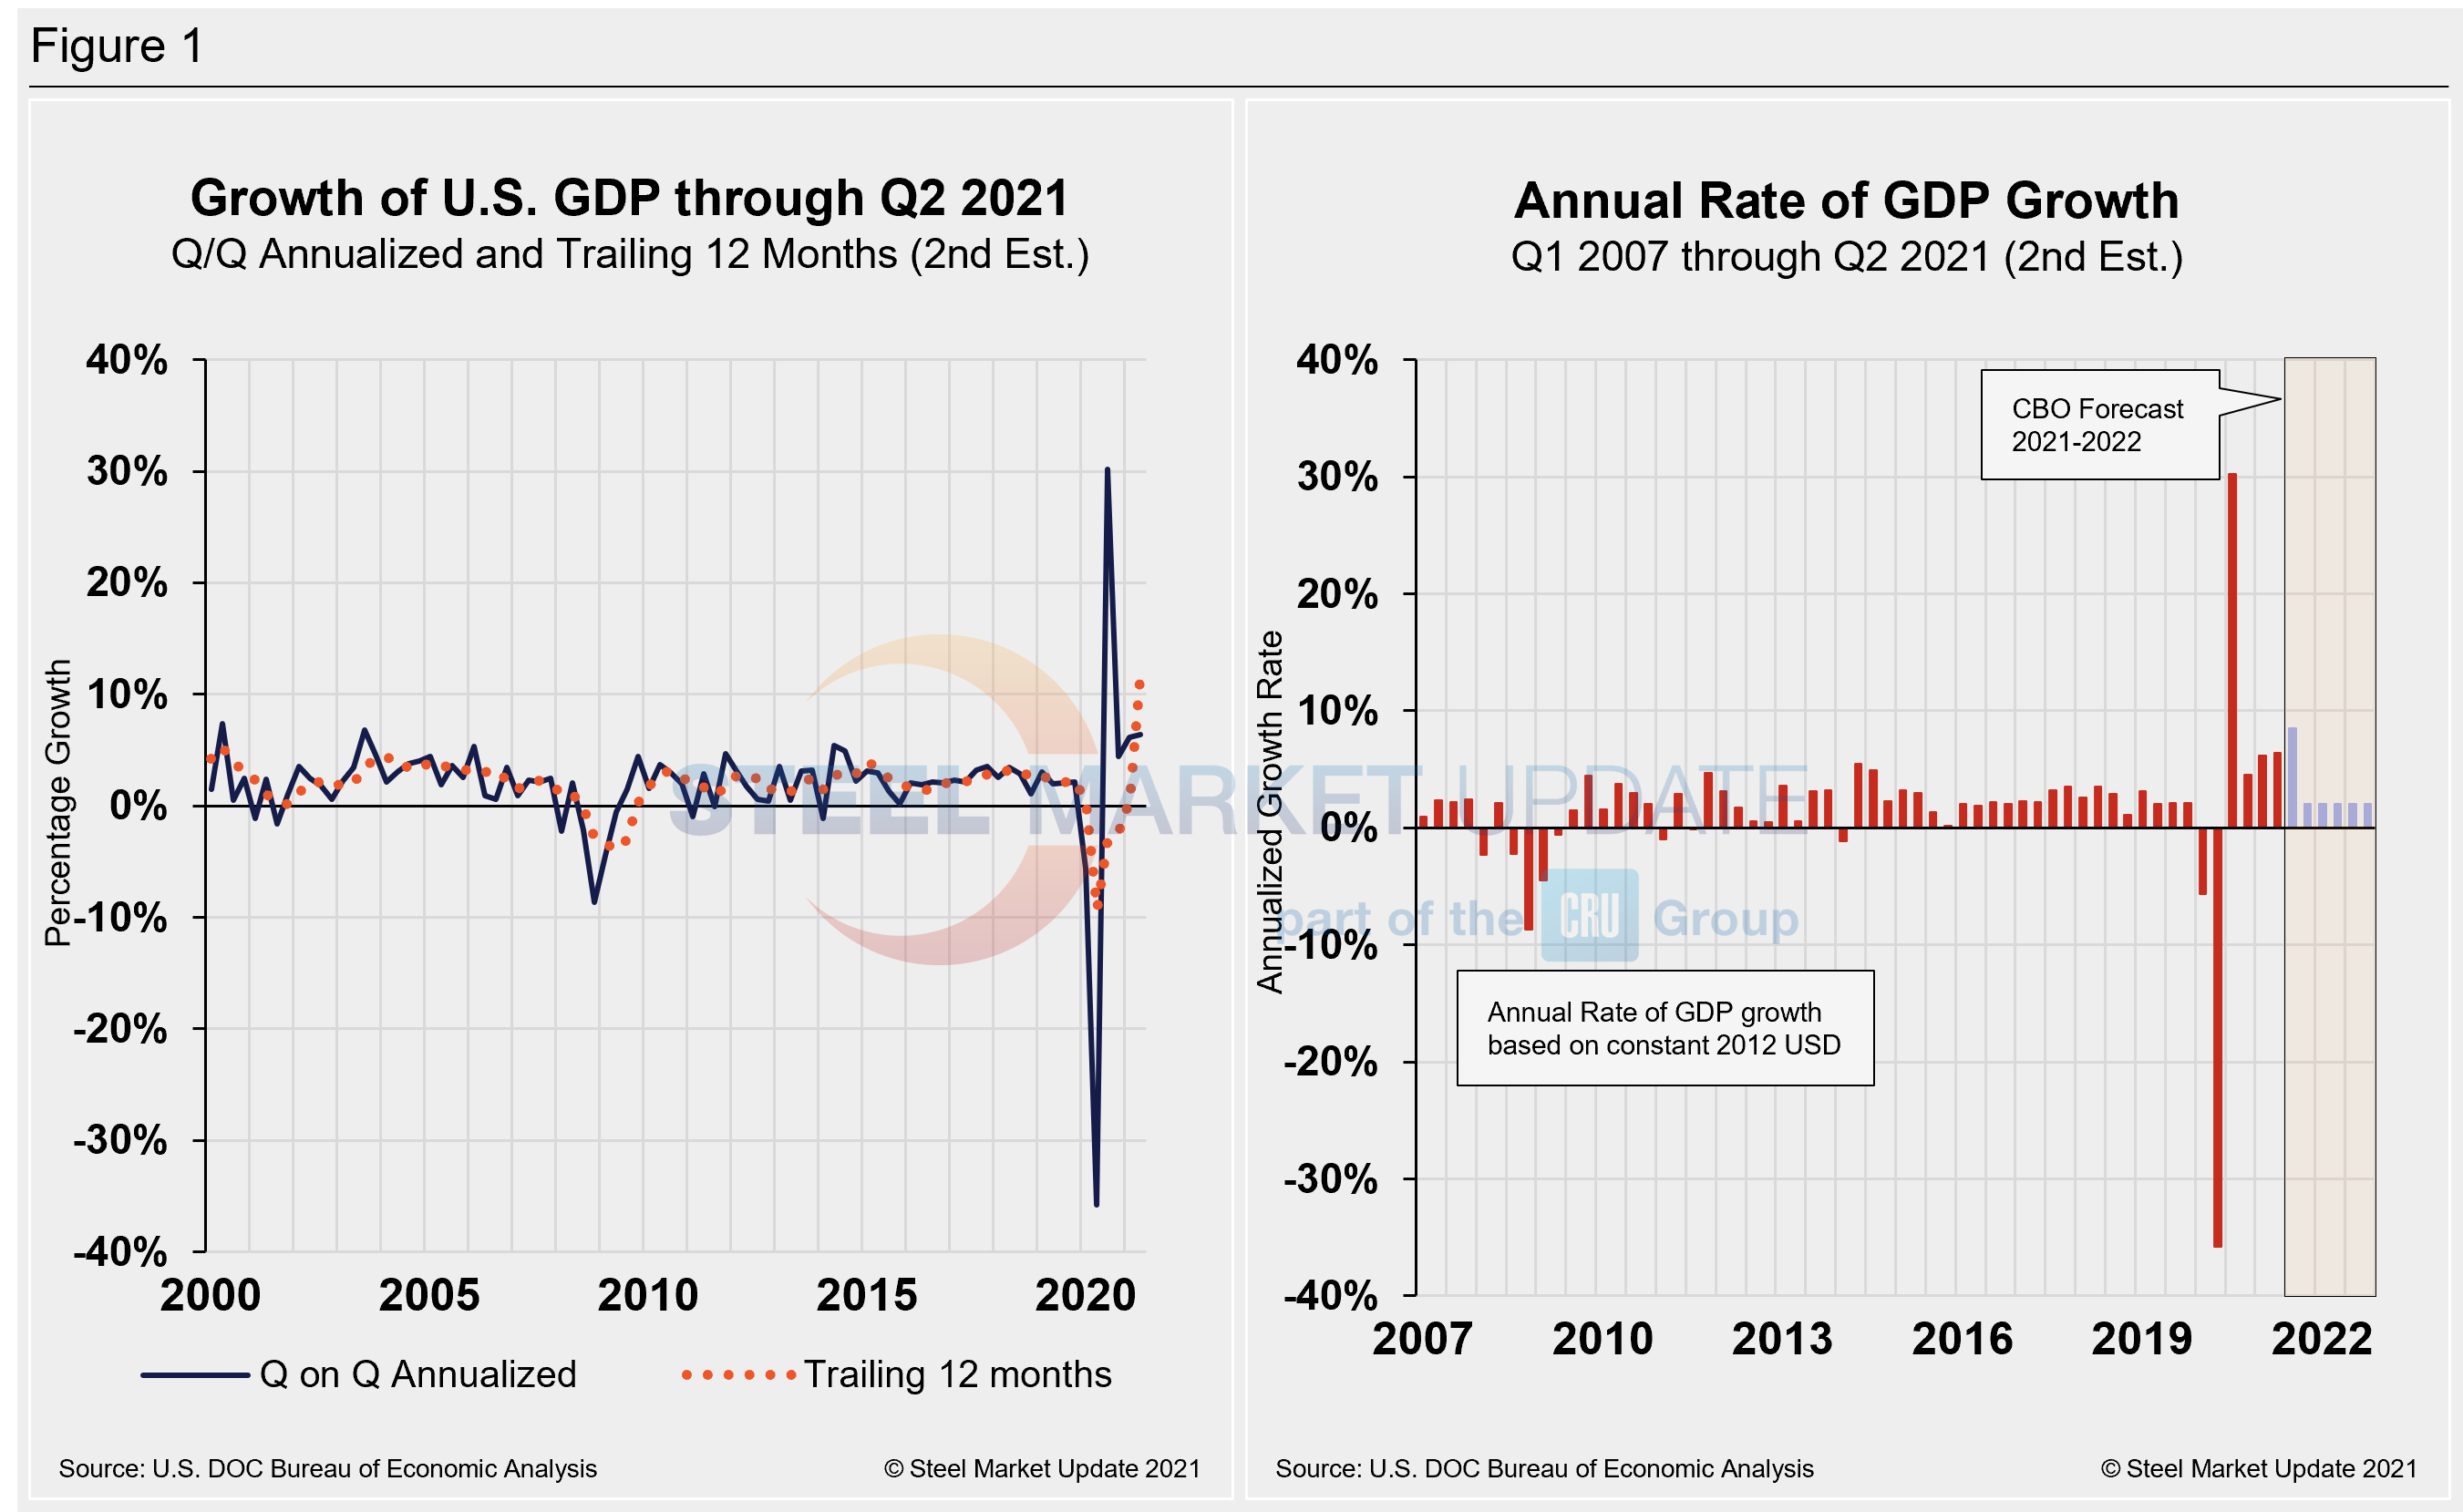
The Department of Commerce’s second look at U.S. GDP in Q2 totaled $22.73 trillion, a 13.2% or $ 693.2 billion increase from the previous quarter, measured in chained 2012 dollars on an annualized basis. Below in Figure 1 is a side-by-side comparison of the growth of U.S. GDP and the annual rate of GDP, both through Q2 2021. In the first chart, the orange dotted line is the trailing 12-month growth and the dark blue line is the headline quarterly result. The chart on the right details the headline quarterly results since Q1 2007 including the Congressional Budget Office’s GDP projection through 2022. On a trailing 12-month basis, GDP shot up to 12.18% in Q2, a surge from 0.55% in Q1, and a huge improvement from negative 9.27% seen one year ago at the height of the pandemic. For comparison, the average in 46 quarters since Q1 2010 has been a growth rate of 1.96%.
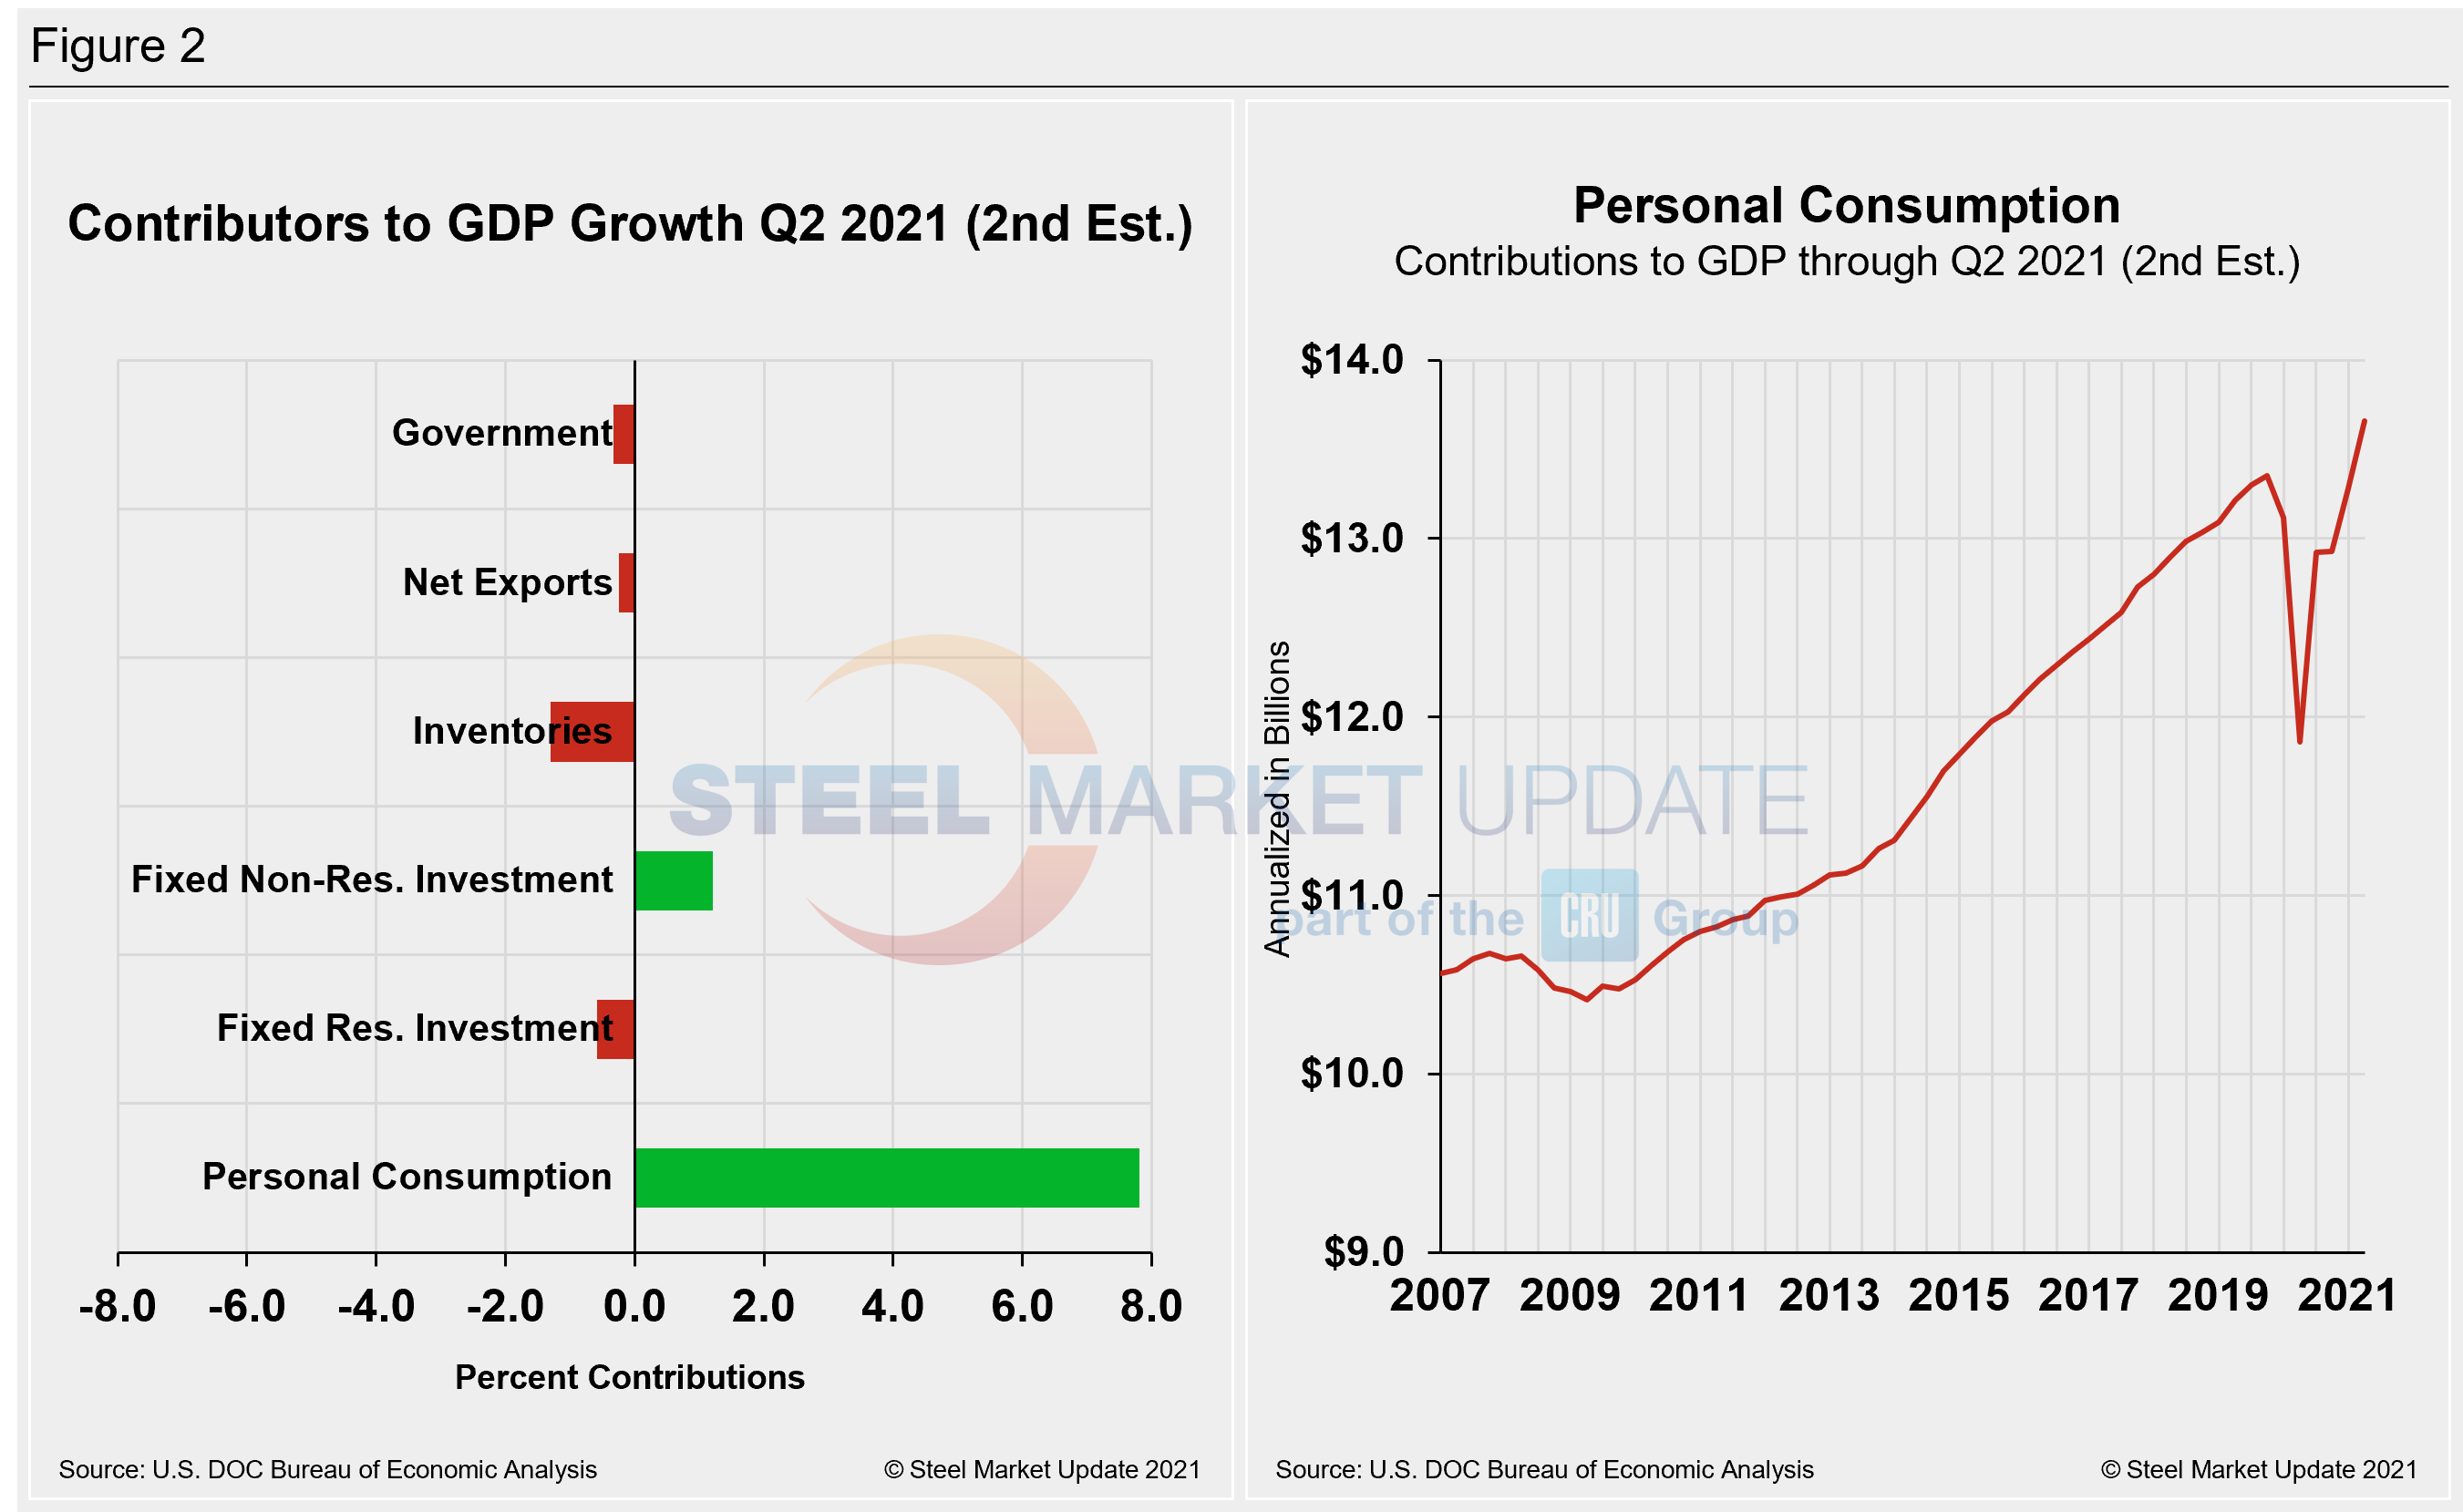
Shown below in Figure 2 is a side-by-side comparison of two charts. On the left is the mix of the six major components in the GDP growth calculation, while the chart on the right puts a spotlight on personal consumption. The most notable change and major source of GDP fluctuation during market freefalls is personal consumption, which saw a negative 24.01% contribution a year ago following the onset of COVID, followed by a positive 25.44% contribution in Q3 last year as the economy reopened.
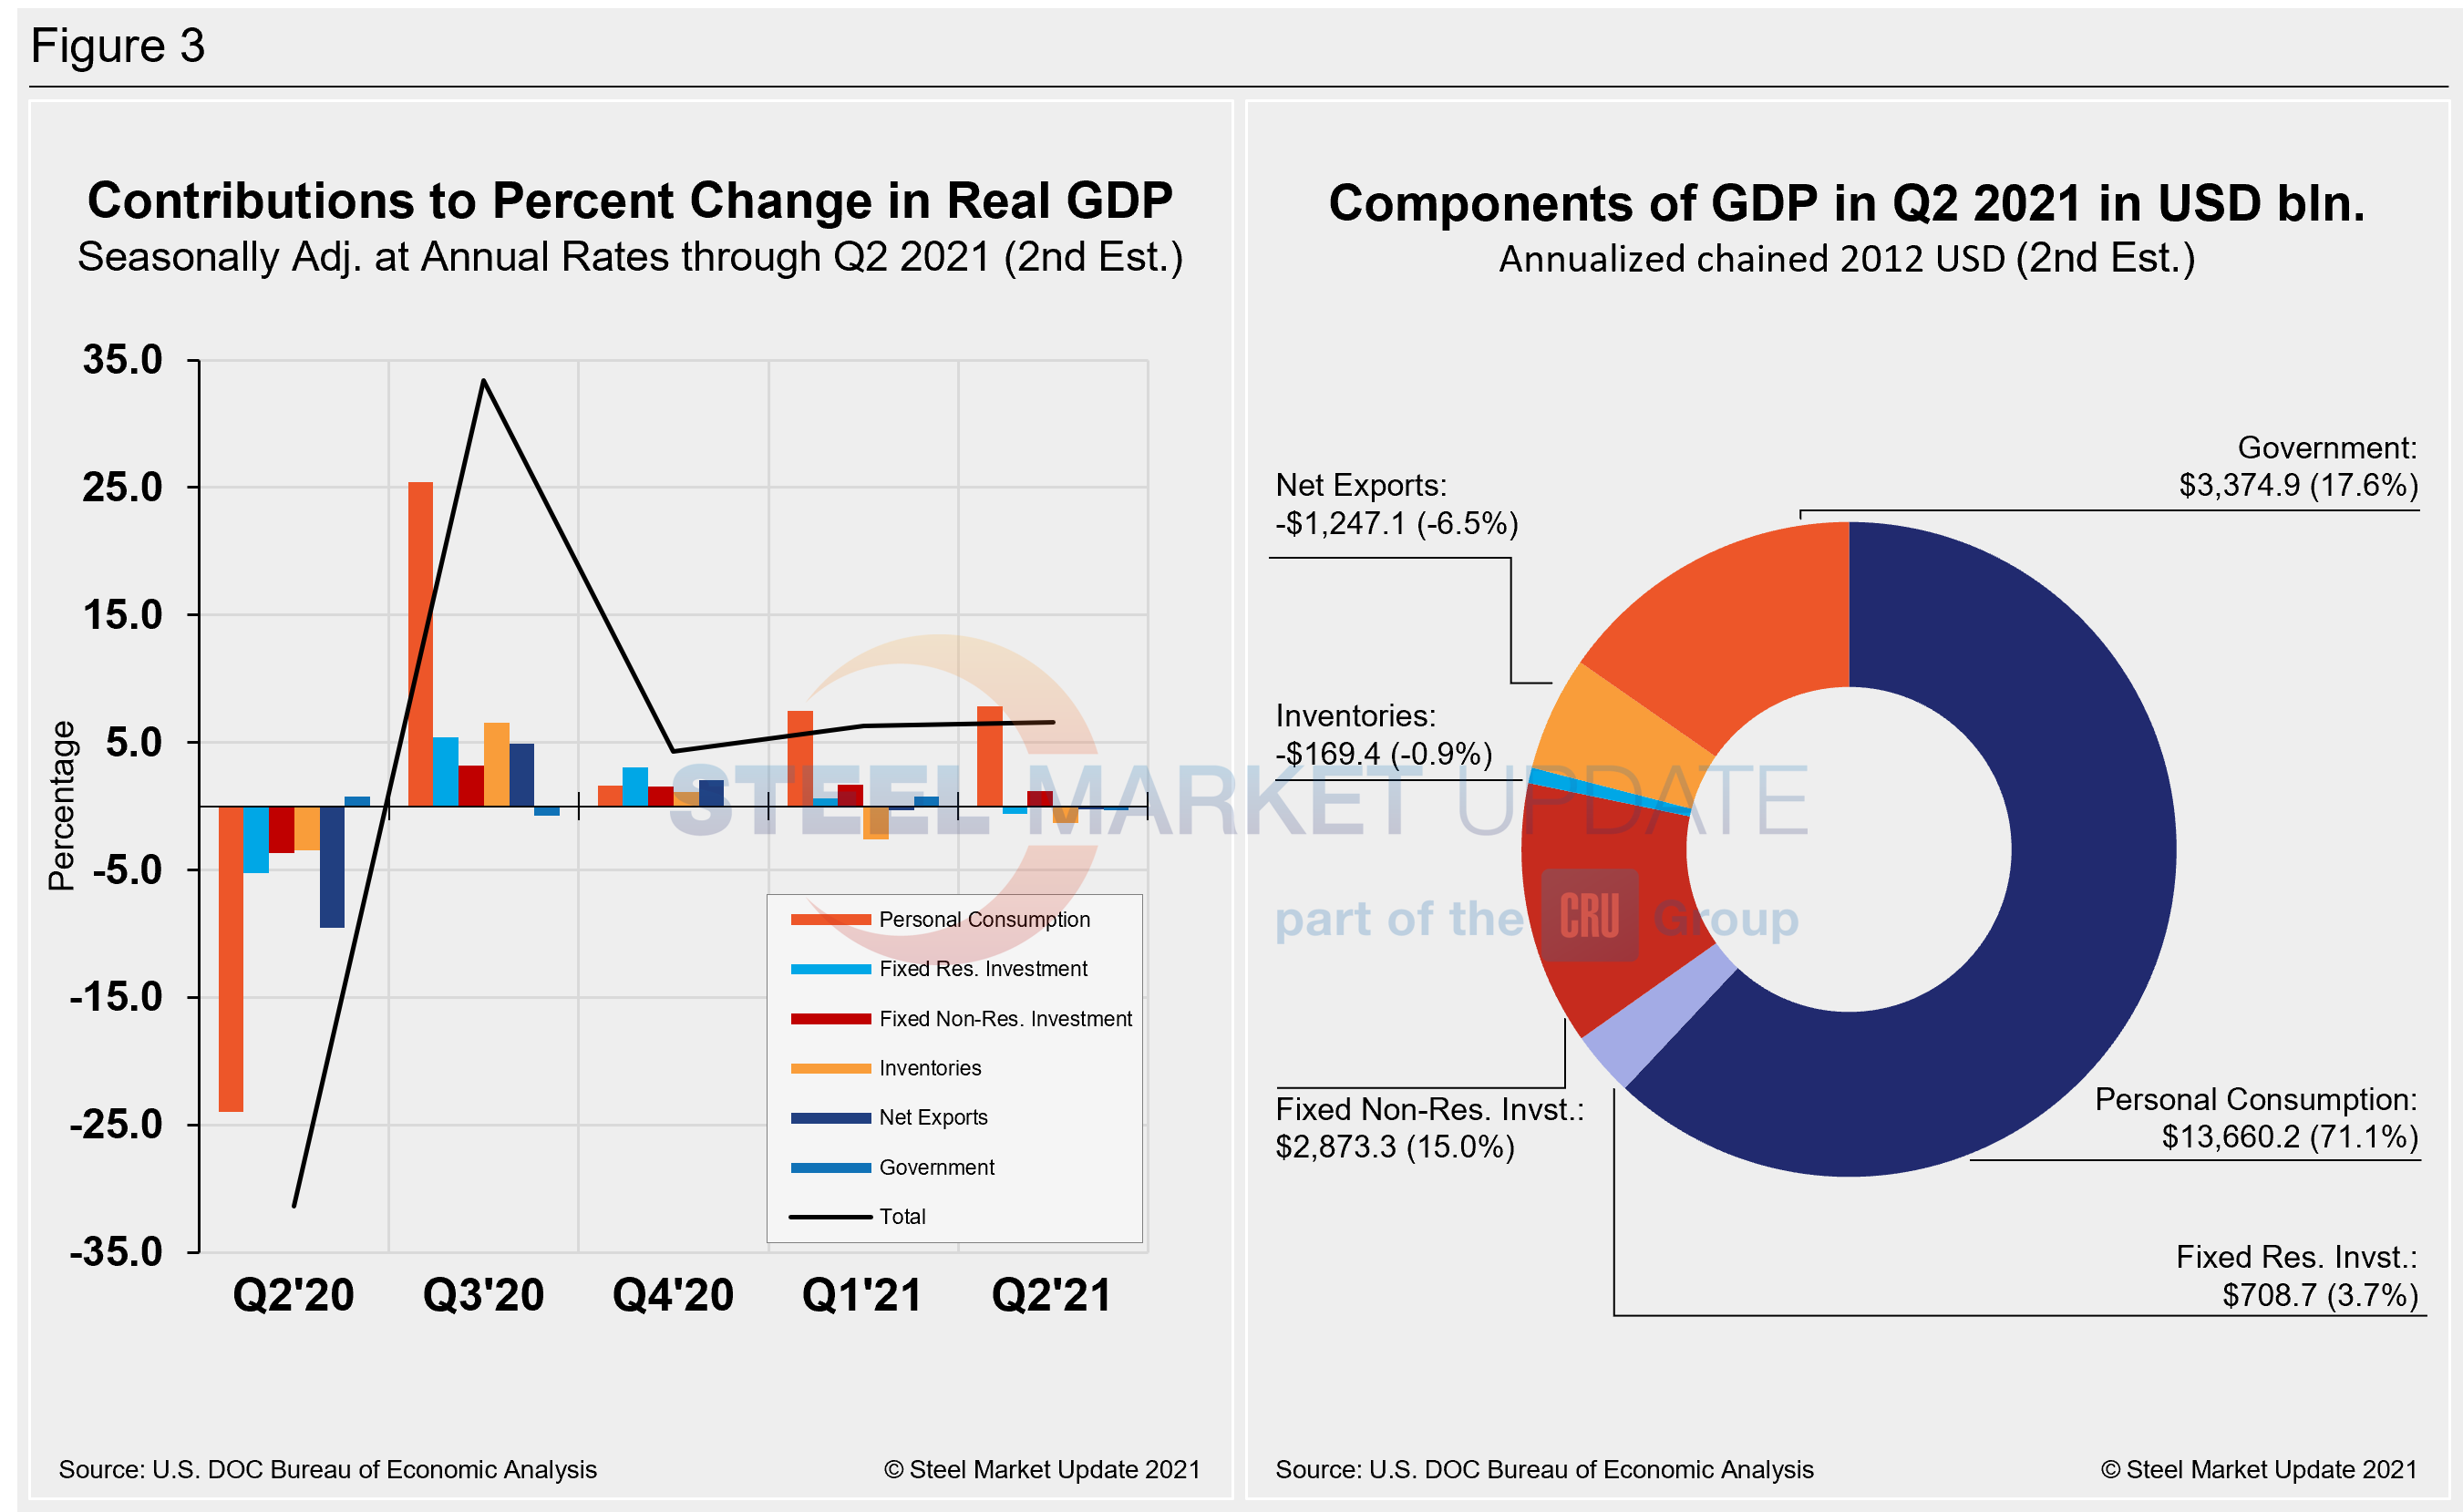
Quarterly contributions of the six major subcomponents of GDP since Q2 2020 and the breakdown of the $22.73 trillion economy in BEA’s second estimate of Q2 GDP are both shown in Figure 3. The chart on the left is detailed out for cross-comparison with Figure 1 above. The chart on the right shows the size of the other components relative to personal consumption.
SMU Comment: At an annual growth rate of 6.6% in Q2, the U.S. economy is pushing beyond its pre-pandemic level and could still see stellar growth in 2021. The Delta variant remains a key downside risk, however, and virus fatigue is leading to a weakening in consumer confidence.
By David Schollaert, David@SteelMarketUpdate.com


