Market Data

April 29, 2022
SMU Key Market Indicators Improve
Written by David Schollaert
Monthly Key Market Indicators improved slightly through March, though sentiment remains cautious, according to the latest analysis by Steel Market Update. Neutral and positive indicators have increased, while negative indicators have eased.
Consumers and businesses continue to spend even though economic dynamics remain in flux, with supply disruptions weighing on the economy. While inflation continues to plague the economy, the workforce has gotten a lift from falling unemployment rates and higher retention levels. Market indicators, which are mostly positive, might imply new confidence in the marketplace in the months ahead.
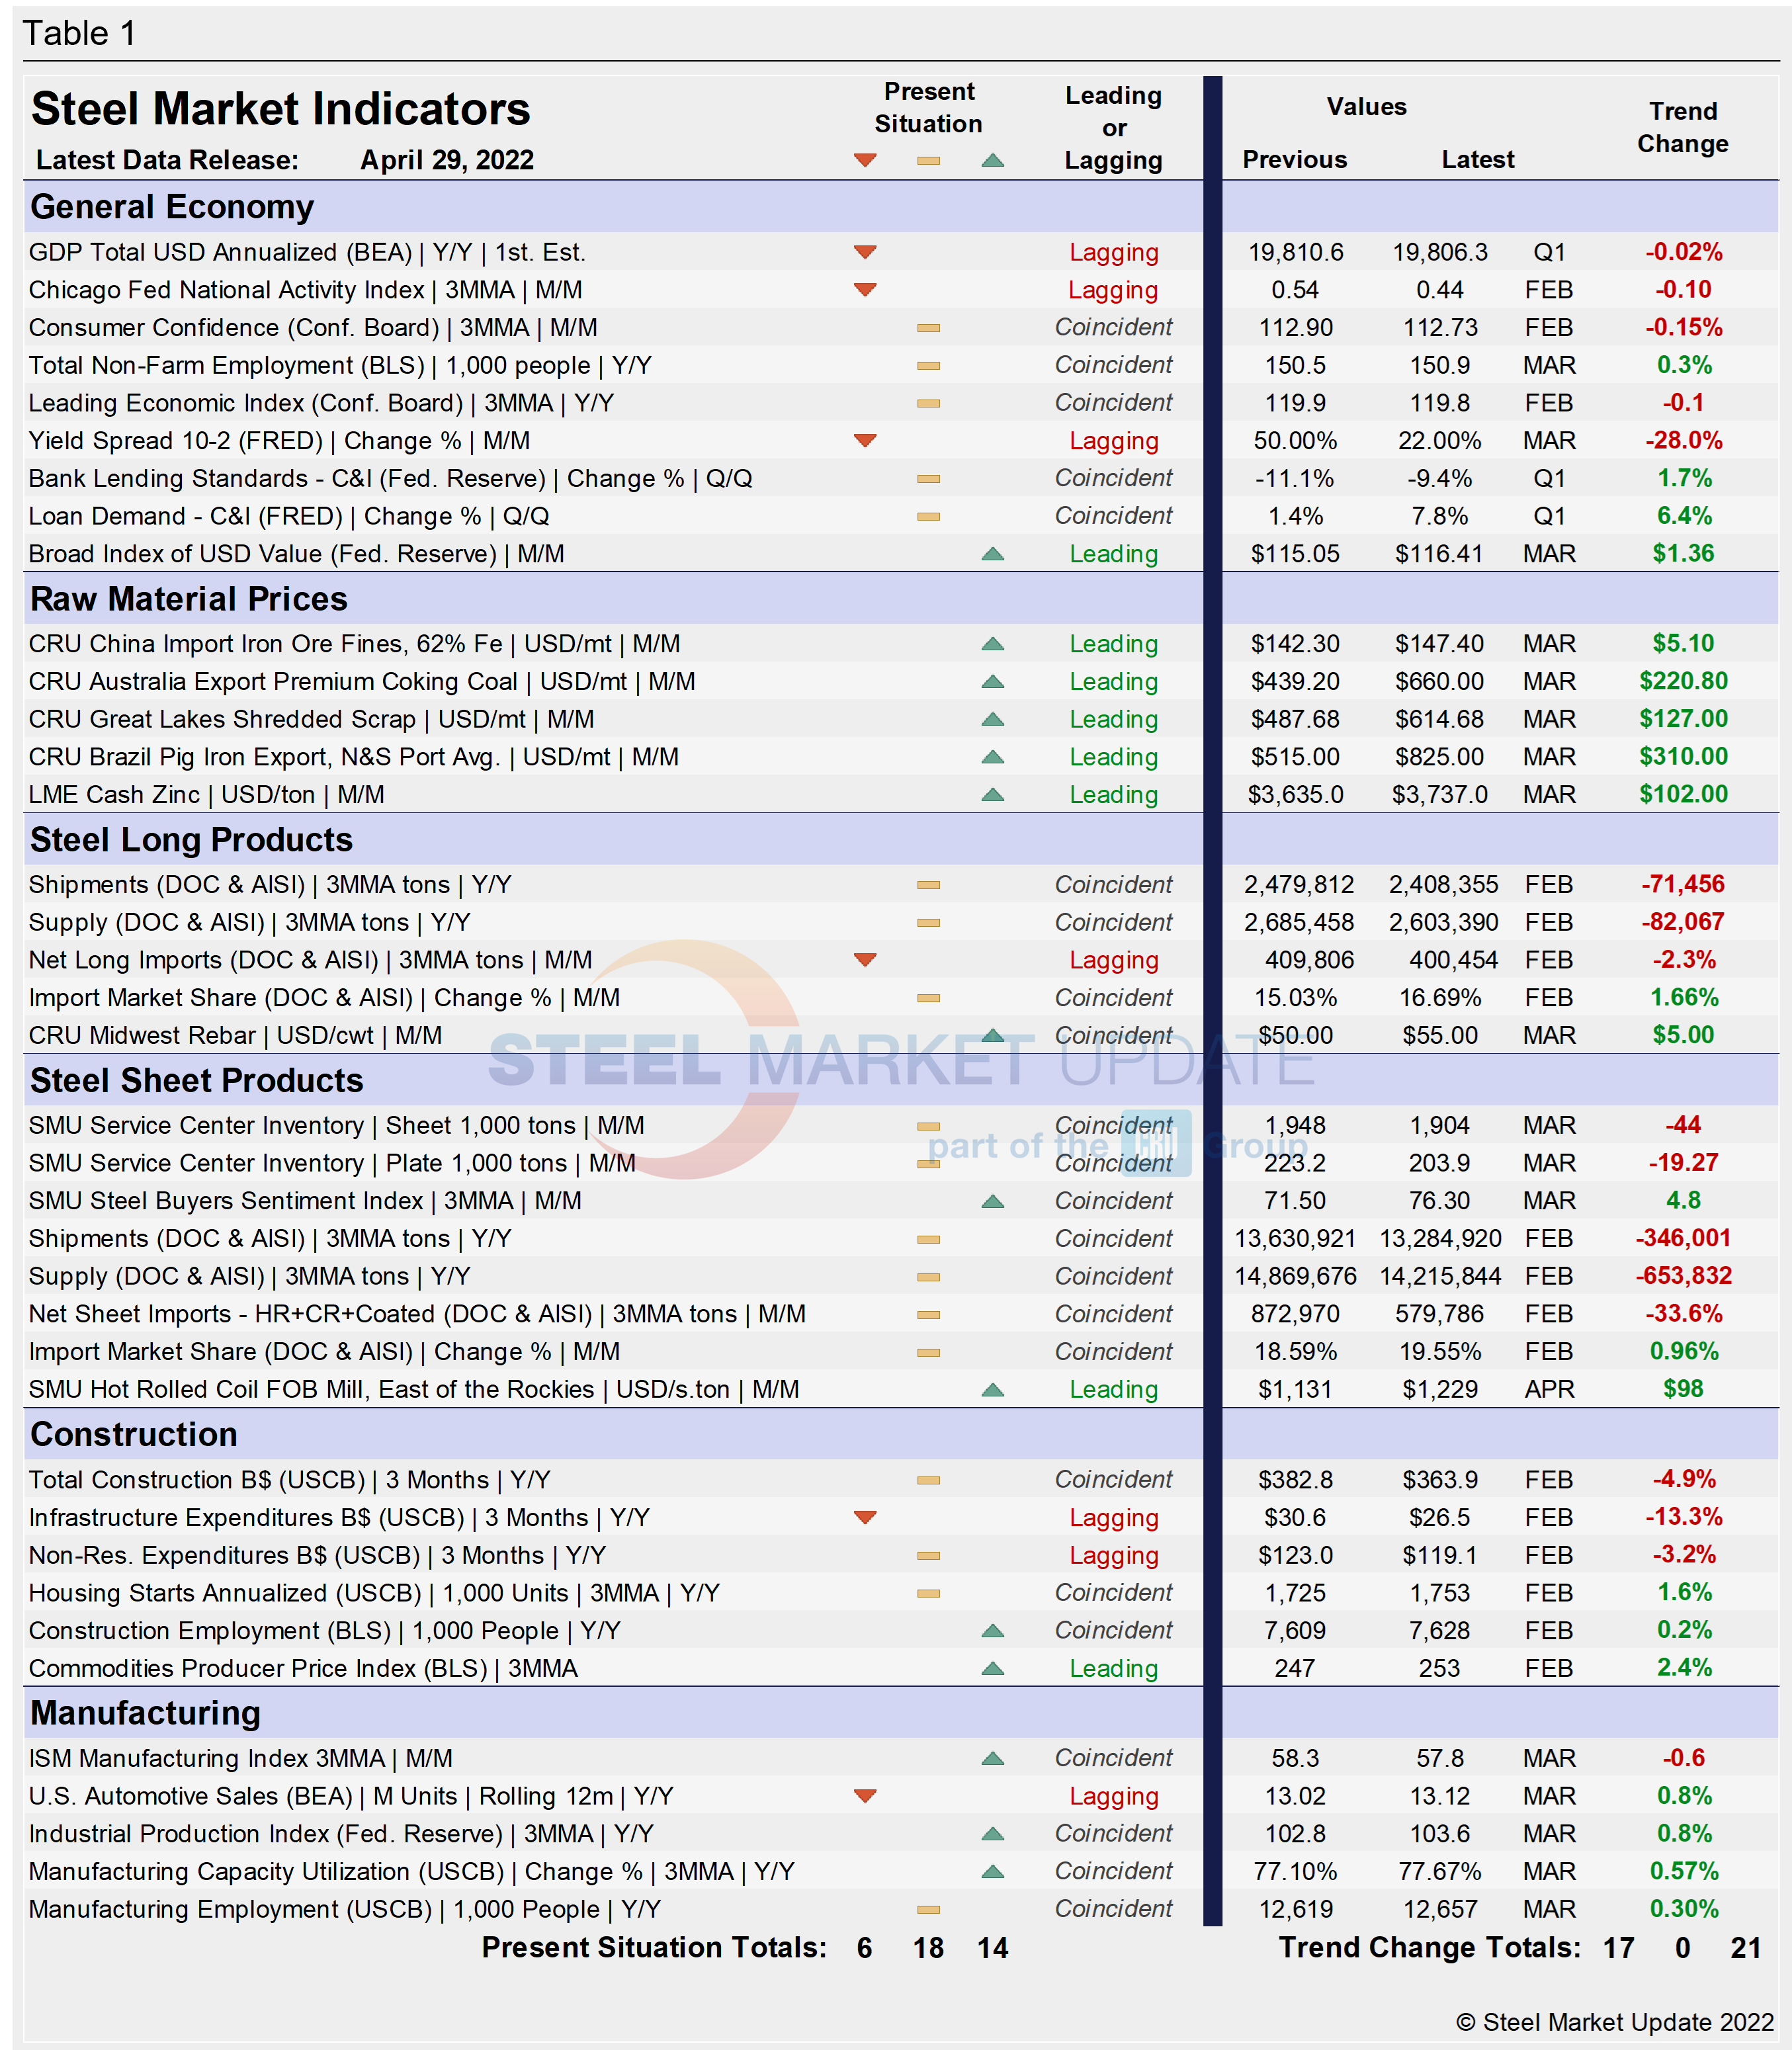
SMU’s Key Market Indicators include a data on the economy, raw materials, manufacturing, construction, and steel sheet and long products. They offer a snapshot of current sentiment and the near-term expected trajectory of the economy. Markers for the Present Situation were sideways in February but improved in March. Trends have fluctuated over the past two months but are now improving.
In the latest data, 14 of the 38 Present Situation indicators are positive, expanding the positive position by two points month-on-month (MoM). The neutral and negative positions both slipped by one point to 18 and 6, respectively.
SMU’s Present Situation and Trends analyses in the table below are based on the latest available data as of April 29, 2022. Readers should regard the color codes in the “Present Situation” column as a visual summary of the current market condition. The “Trend” columns are also color-coded to give a quick visual snapshot of the market’s direction. All data included in this table was released within the past month. The month or specific date to that the data refers to is shown in the second column from the far right. Click to expand the table below.
Present Situation
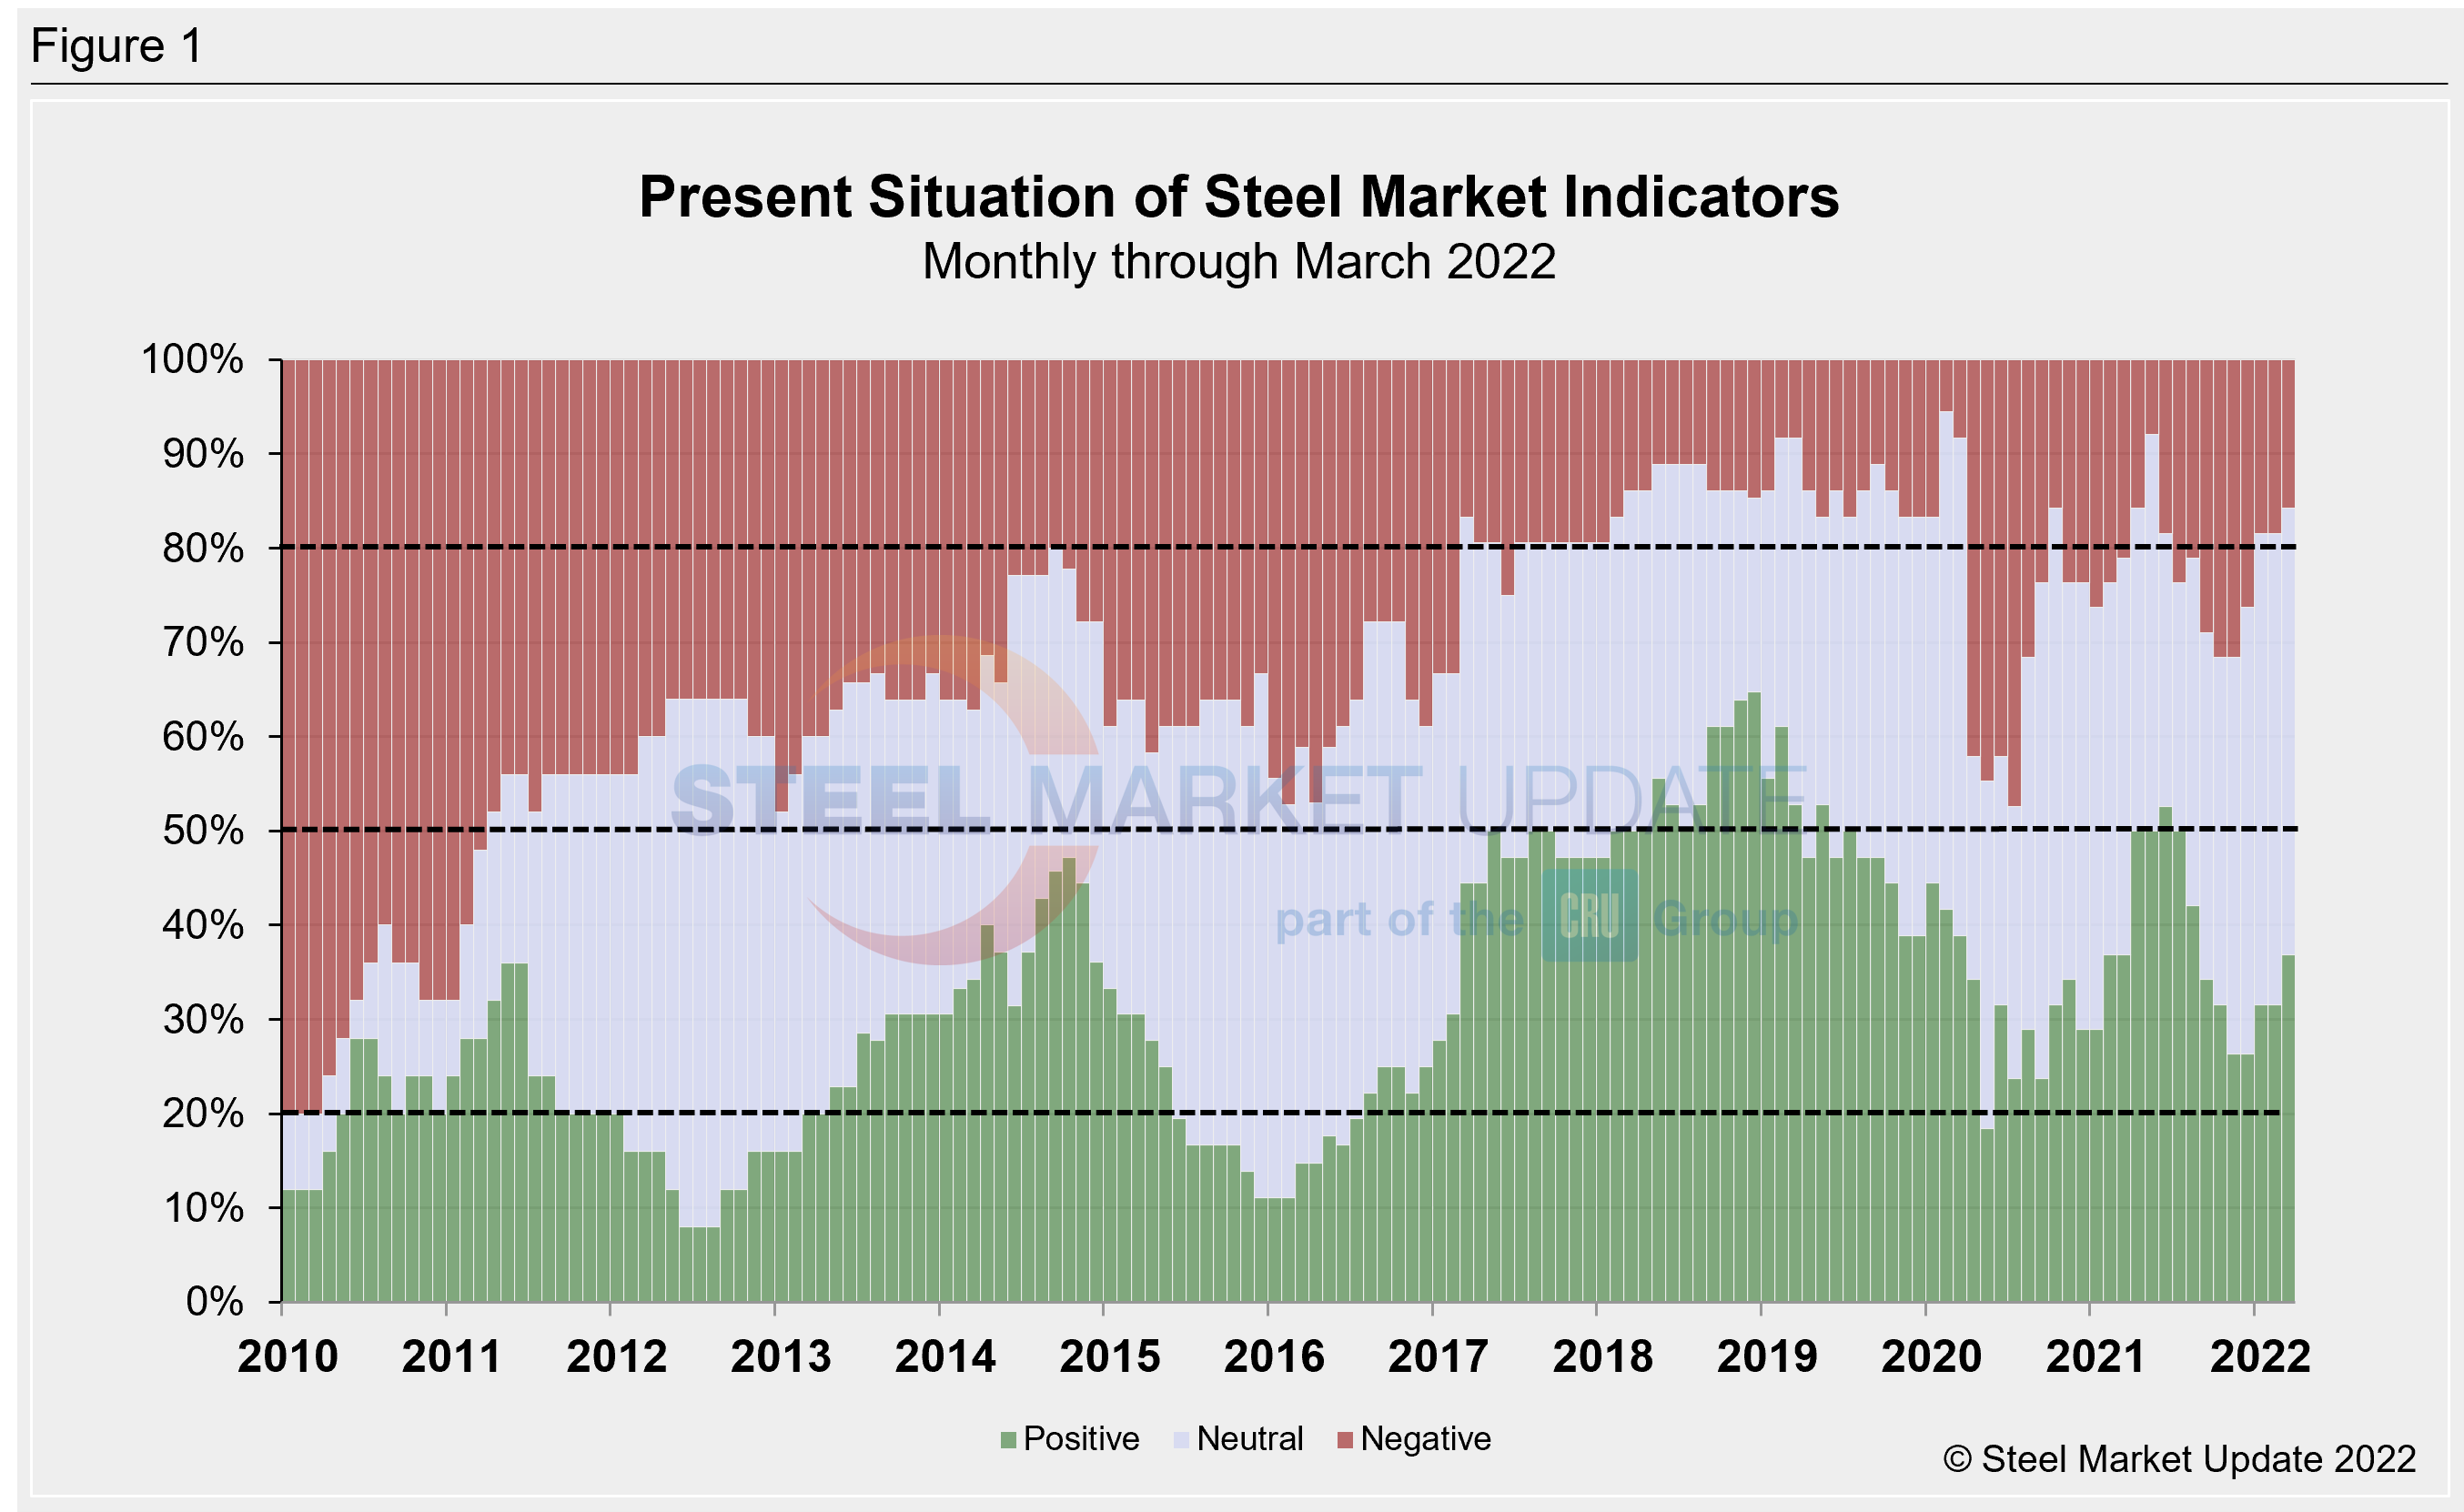
SMU’s Present Situation indicators below highlight the upward trajectory of the domestic market. Even if not smooth, the recovery has been remarkable. Beginning last June, momentum faded as the economy seemed unable to find its footing. A clear direction since has remained elusive, but the marketplace continues to show itself resilient despite rising inflation and interest rates, and supply-chain limitations – particularly in the consumer goods, auto and construction sectors – resulting from an ongoing war in Ukraine.
Through March, 36.8% of the marketplace is positive, a 5.2 percentage point increase, but still down from a high of 52.6% in June 2021. Presently, 15.8% of the market is negative, a 2.6 percentage point decline from February. With the expanded neutral and positive indicators, now 84.2% of the population sees the marketplace as neutral-to-positive, according to SMU’s assessment of key market indicators, a steady increase from 81.6% one month ago.
Our monthly assessment of the Present Situation since January 2010 on a percentage basis is shown in Figure 1.
Trends
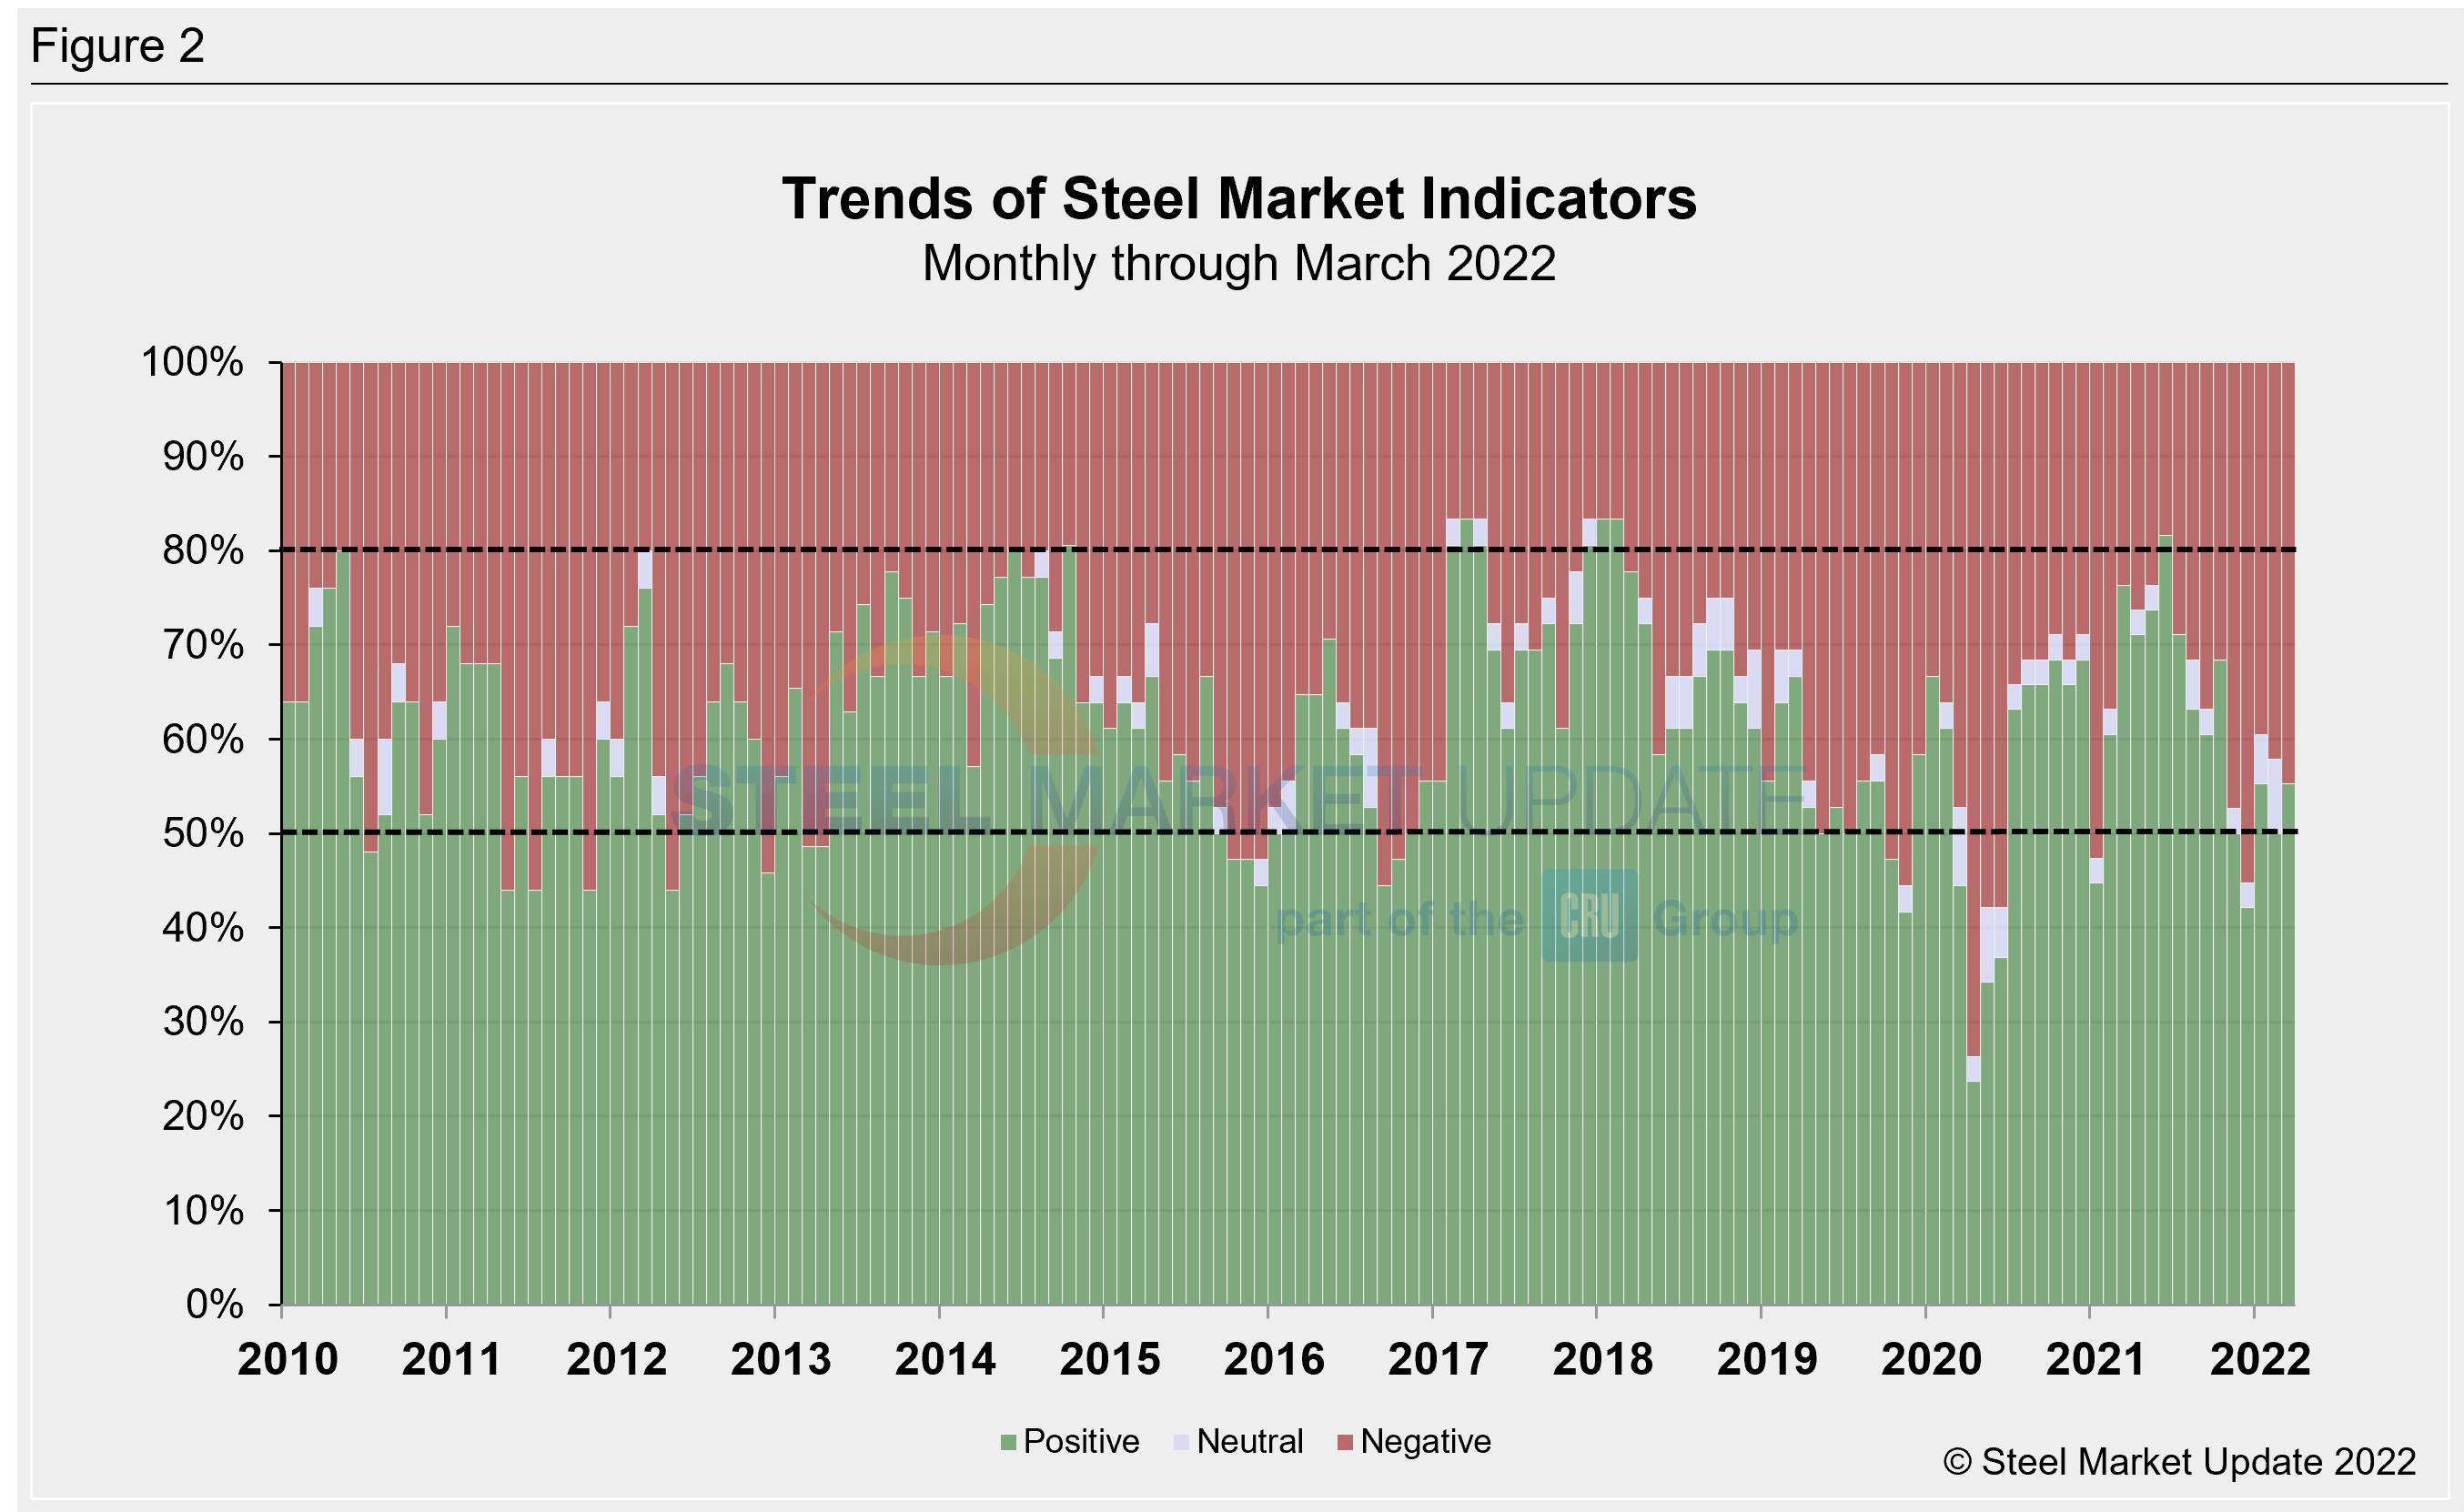
SMU’s Trends indicators have not been consistent since January, fluctuating each of the past three months. What’s unique in this latest analysis, is that the forward-looking Trends are divided between SMU’s positive and negative measures. The dynamic points to a lack of long-term clarity resulting from the current headwinds facing the US economy and its outlook.
It is important to note that most values in the Trends columns are three-month moving averages (3MMA) to smooth erratic monthly data. Note that in many cases this is not March or April data, but data that was released in March and/or April for previous months. Compared to month-ago data, the negative trend rose from 42.1% to 44.7% in March. The neutral trend fell 7.9 percentage points to a zero reading. The positive trend grew from 50% to 55.3% over the same span.
Despite the positive boost, March’s reading remains well behind the high of 81.6% seen last June. Figure 2 shows the recent movement of the trends and historical data for comparison.
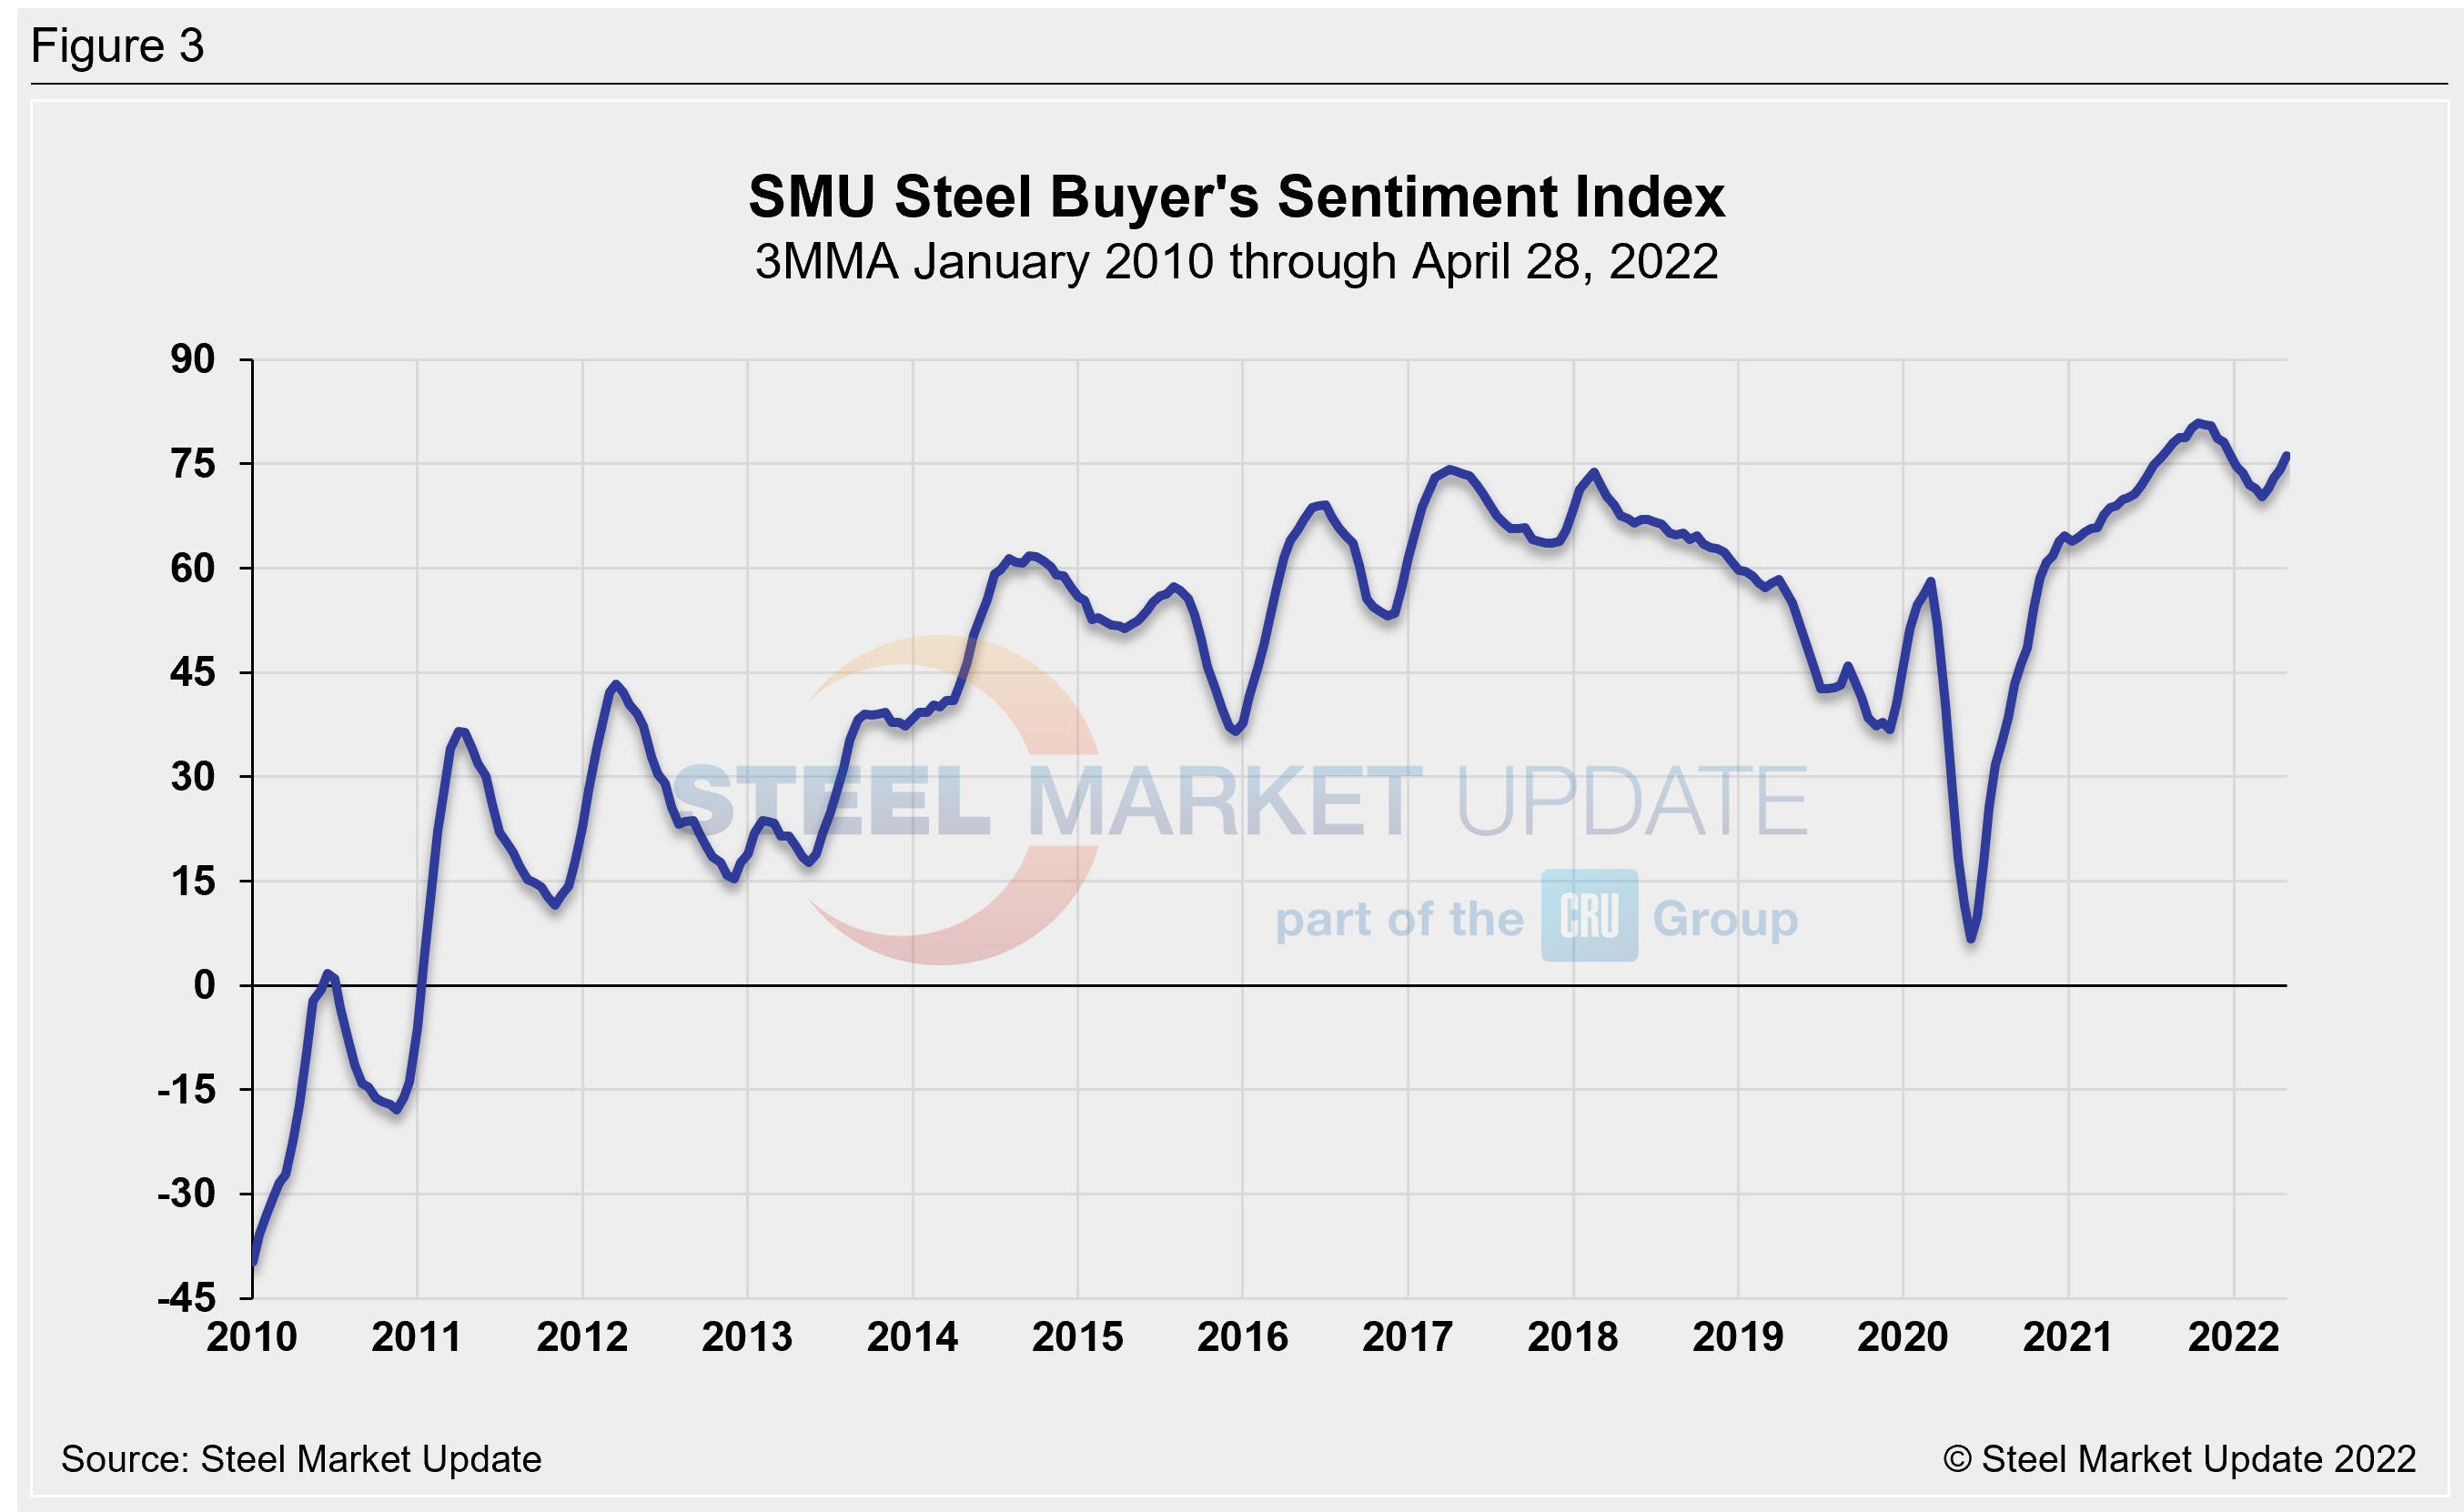
The SMU Steel Buyers Sentiment Index is a measure of the current attitude of North American steel buyers regarding their company’s chances for success in today’s market. The single value of the current sentiment index fell to -8 in early March 2020, a 66-point drop in just a month as the pandemic devastated the economy. It has since rebounded to a healthy +80 as of April 28 but is still down from the high of +84 seen on Sept. 2, 2021. The recent decline resulted from supply concerns linked to the war in Ukraine. Those concerns seem to have eased over the past few weeks, propping the index measure back up.
Figure 3 shows the 3MMA of the index since 2010. A reading above the neutral point of zero indicates that buyers have a positive attitude about their prospects. Steady demand appears to be keeping the Steel Buyer’s Sentiment Index at a highly optimistic level despite extemely volatile pricing.
By David Schollaert, David@SteelMarketUpdate.com