

Market Data

May 15, 2022
SMU Steel Buyer's Sentiment Index Slips
Written by David Schollaert
Steel Market Update’s Steel Buyer’s Sentiment Index slipped 2 points last week following three consecutive weeks of steel price declines. Our Future Sentiment Index was unchanged and remains at a new high set just two weeks prior.
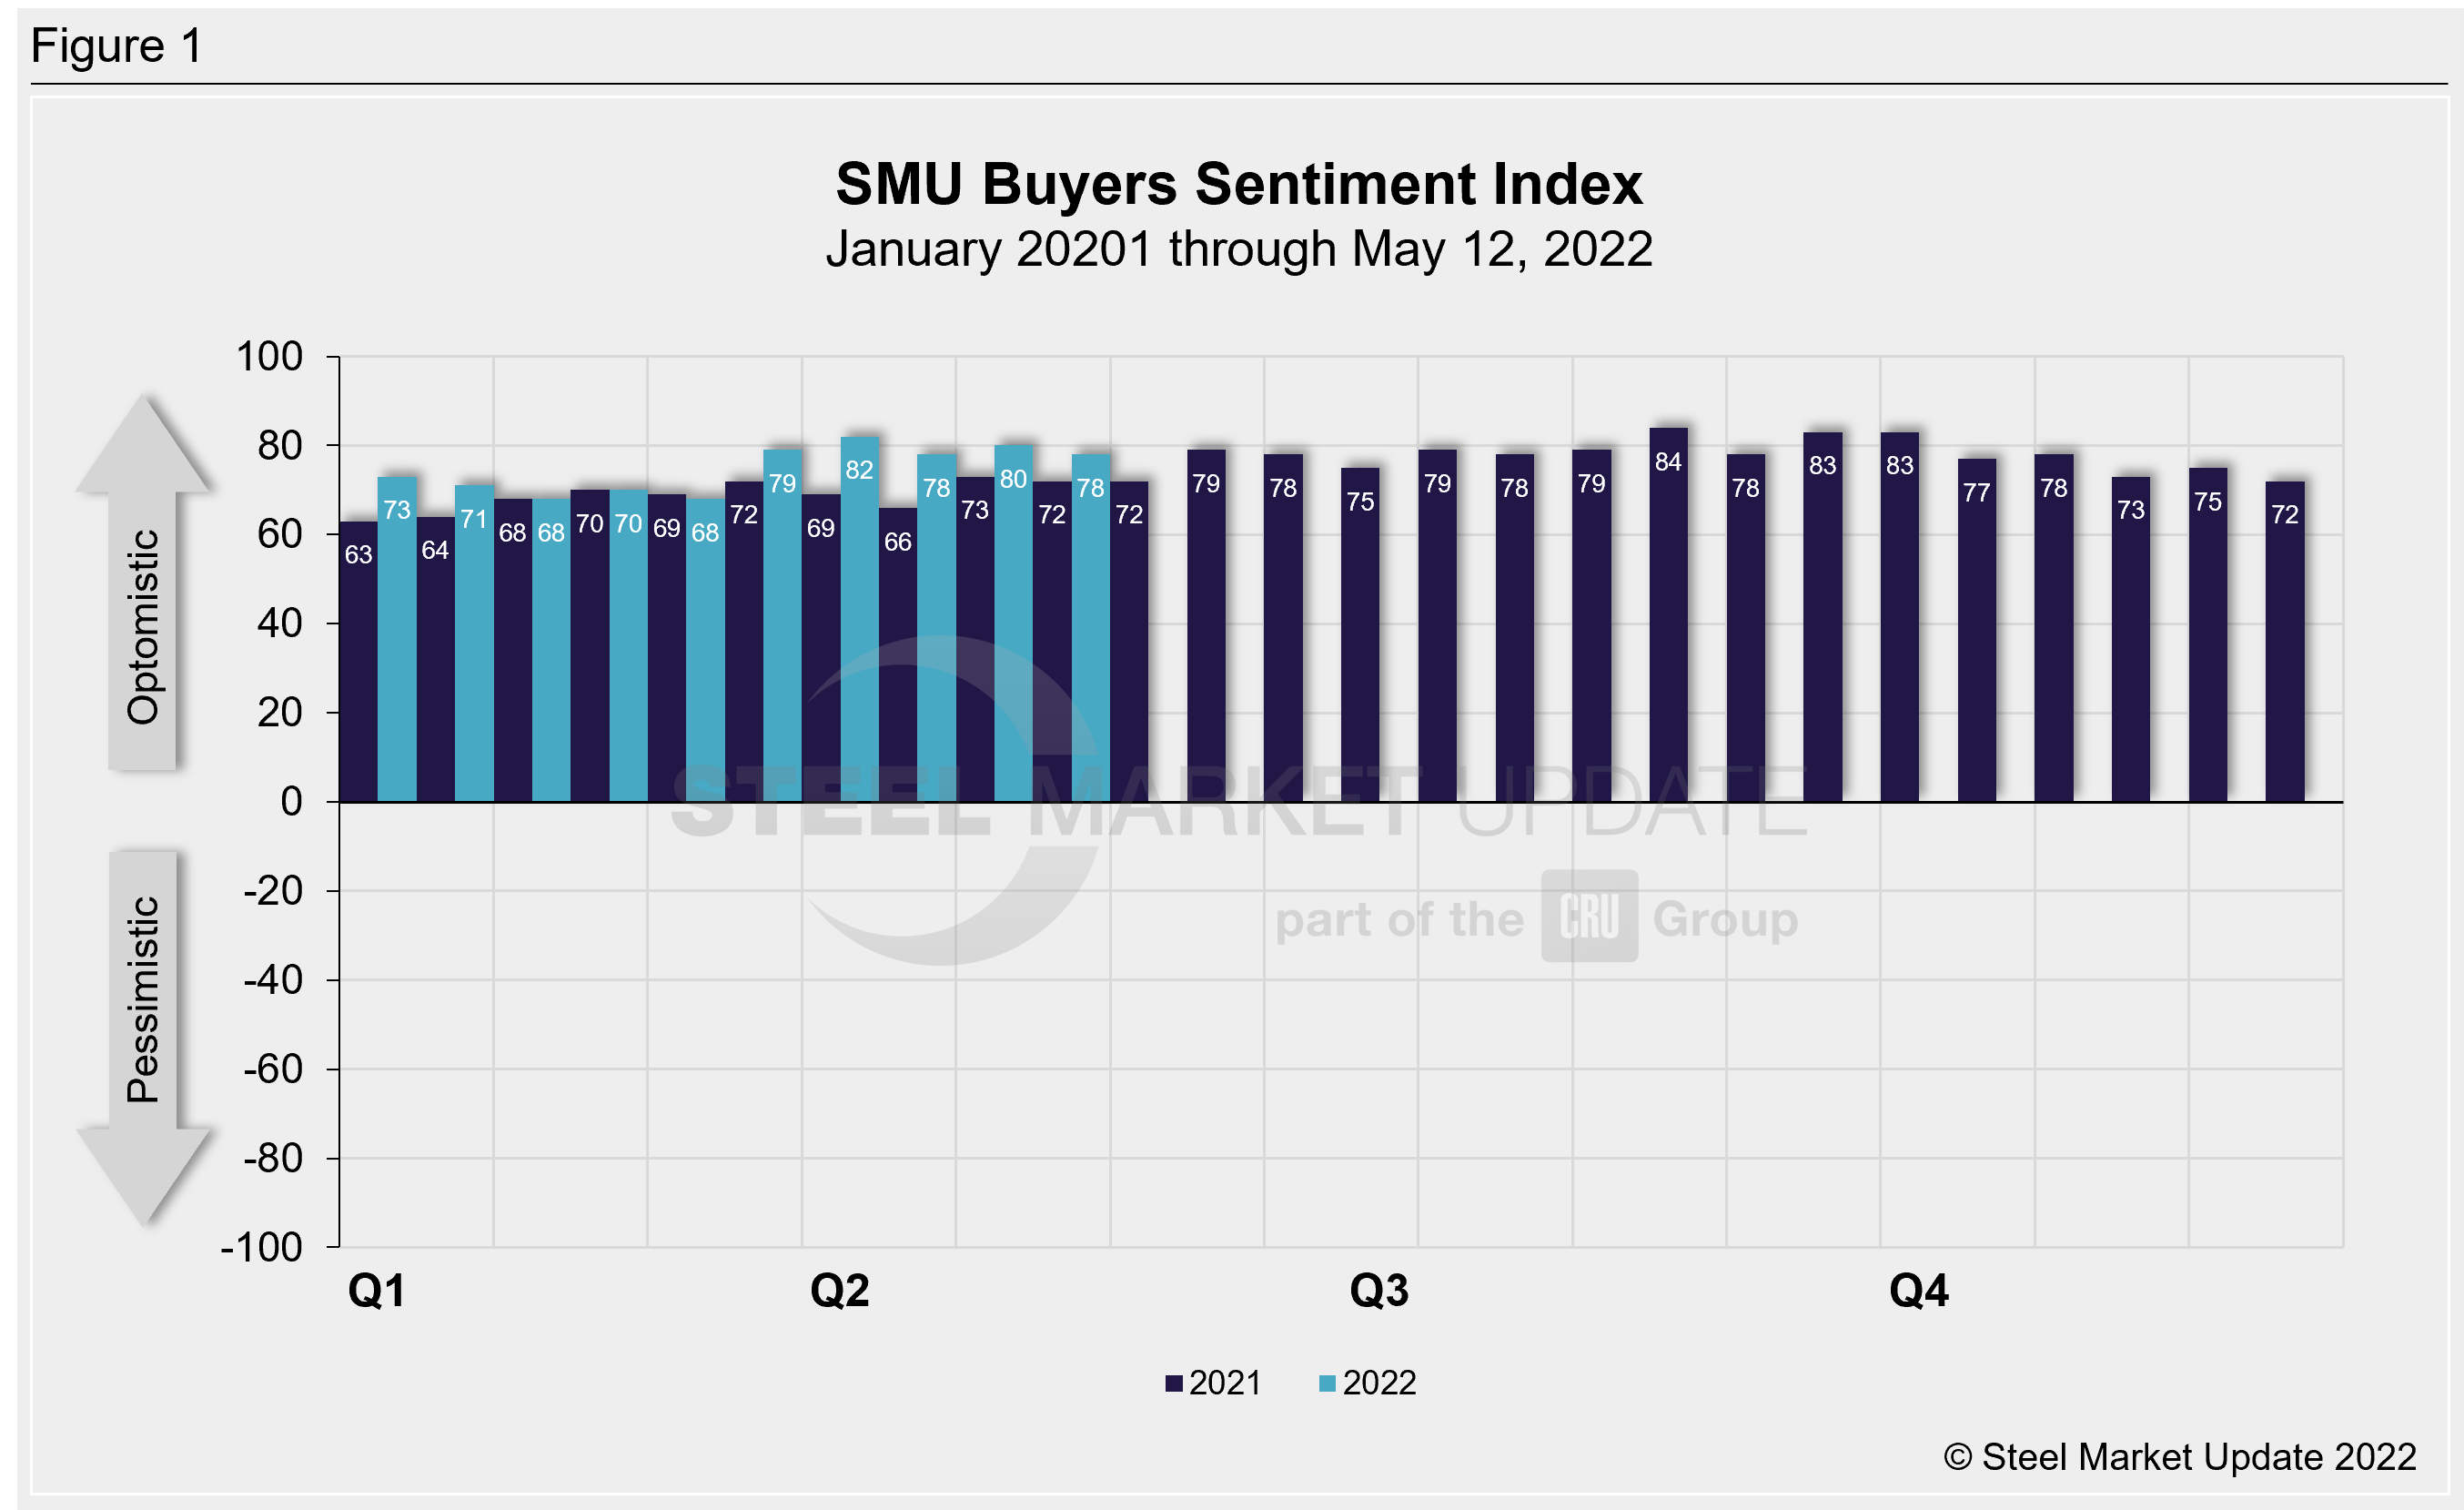
SMU surveys buyers every two weeks and asks how they view their chances of success in the near term and in the long term. SMU’s Current Sentiment Index, a measure of the near term, registered +78 last week (Figure 1), down 2 points from two weeks ago.
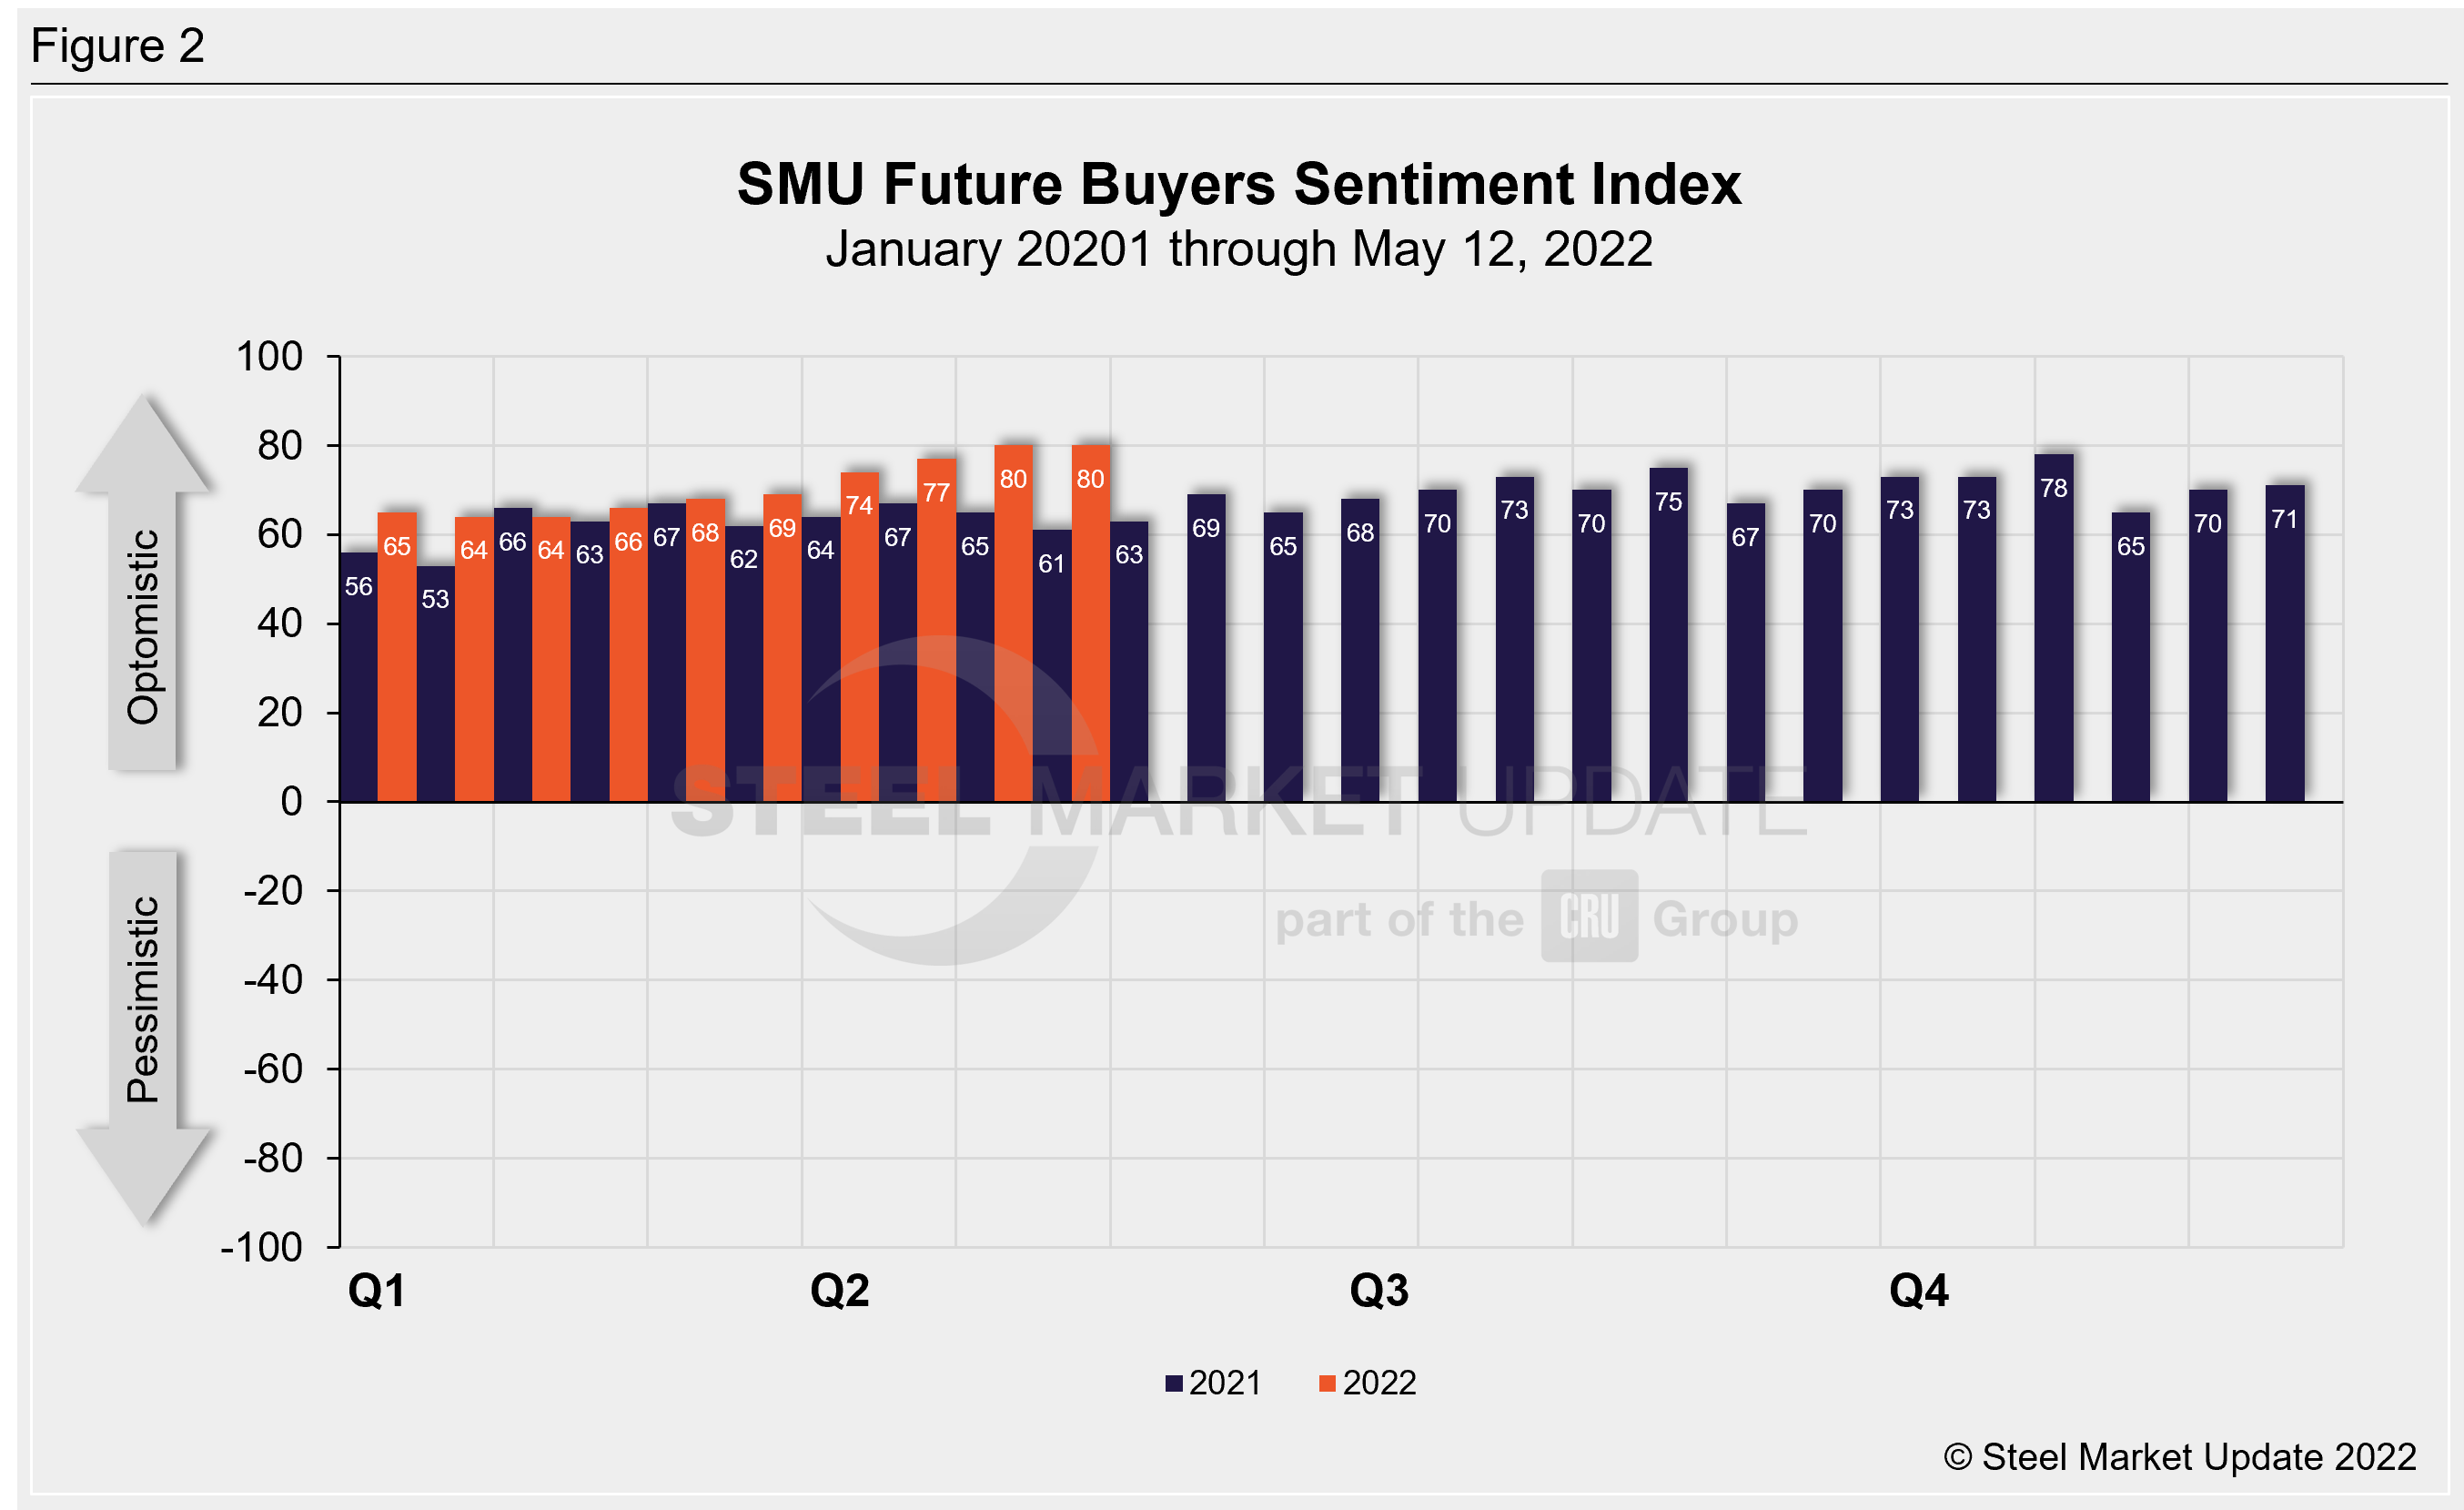
SMU’s Future Sentiment Index (Figure 2), which measures buyers’ feelings about their prospects three to six months in the future, was sideways. It held at a robust +80. This is the highest reading in our 13.5-year history.
Recall that last September, when steel prices peaked, Current Sentiment reached an all-time high of +84, and Future Sentiment was at a near-record +75. (Future Sentiment hit +78 two months later.)
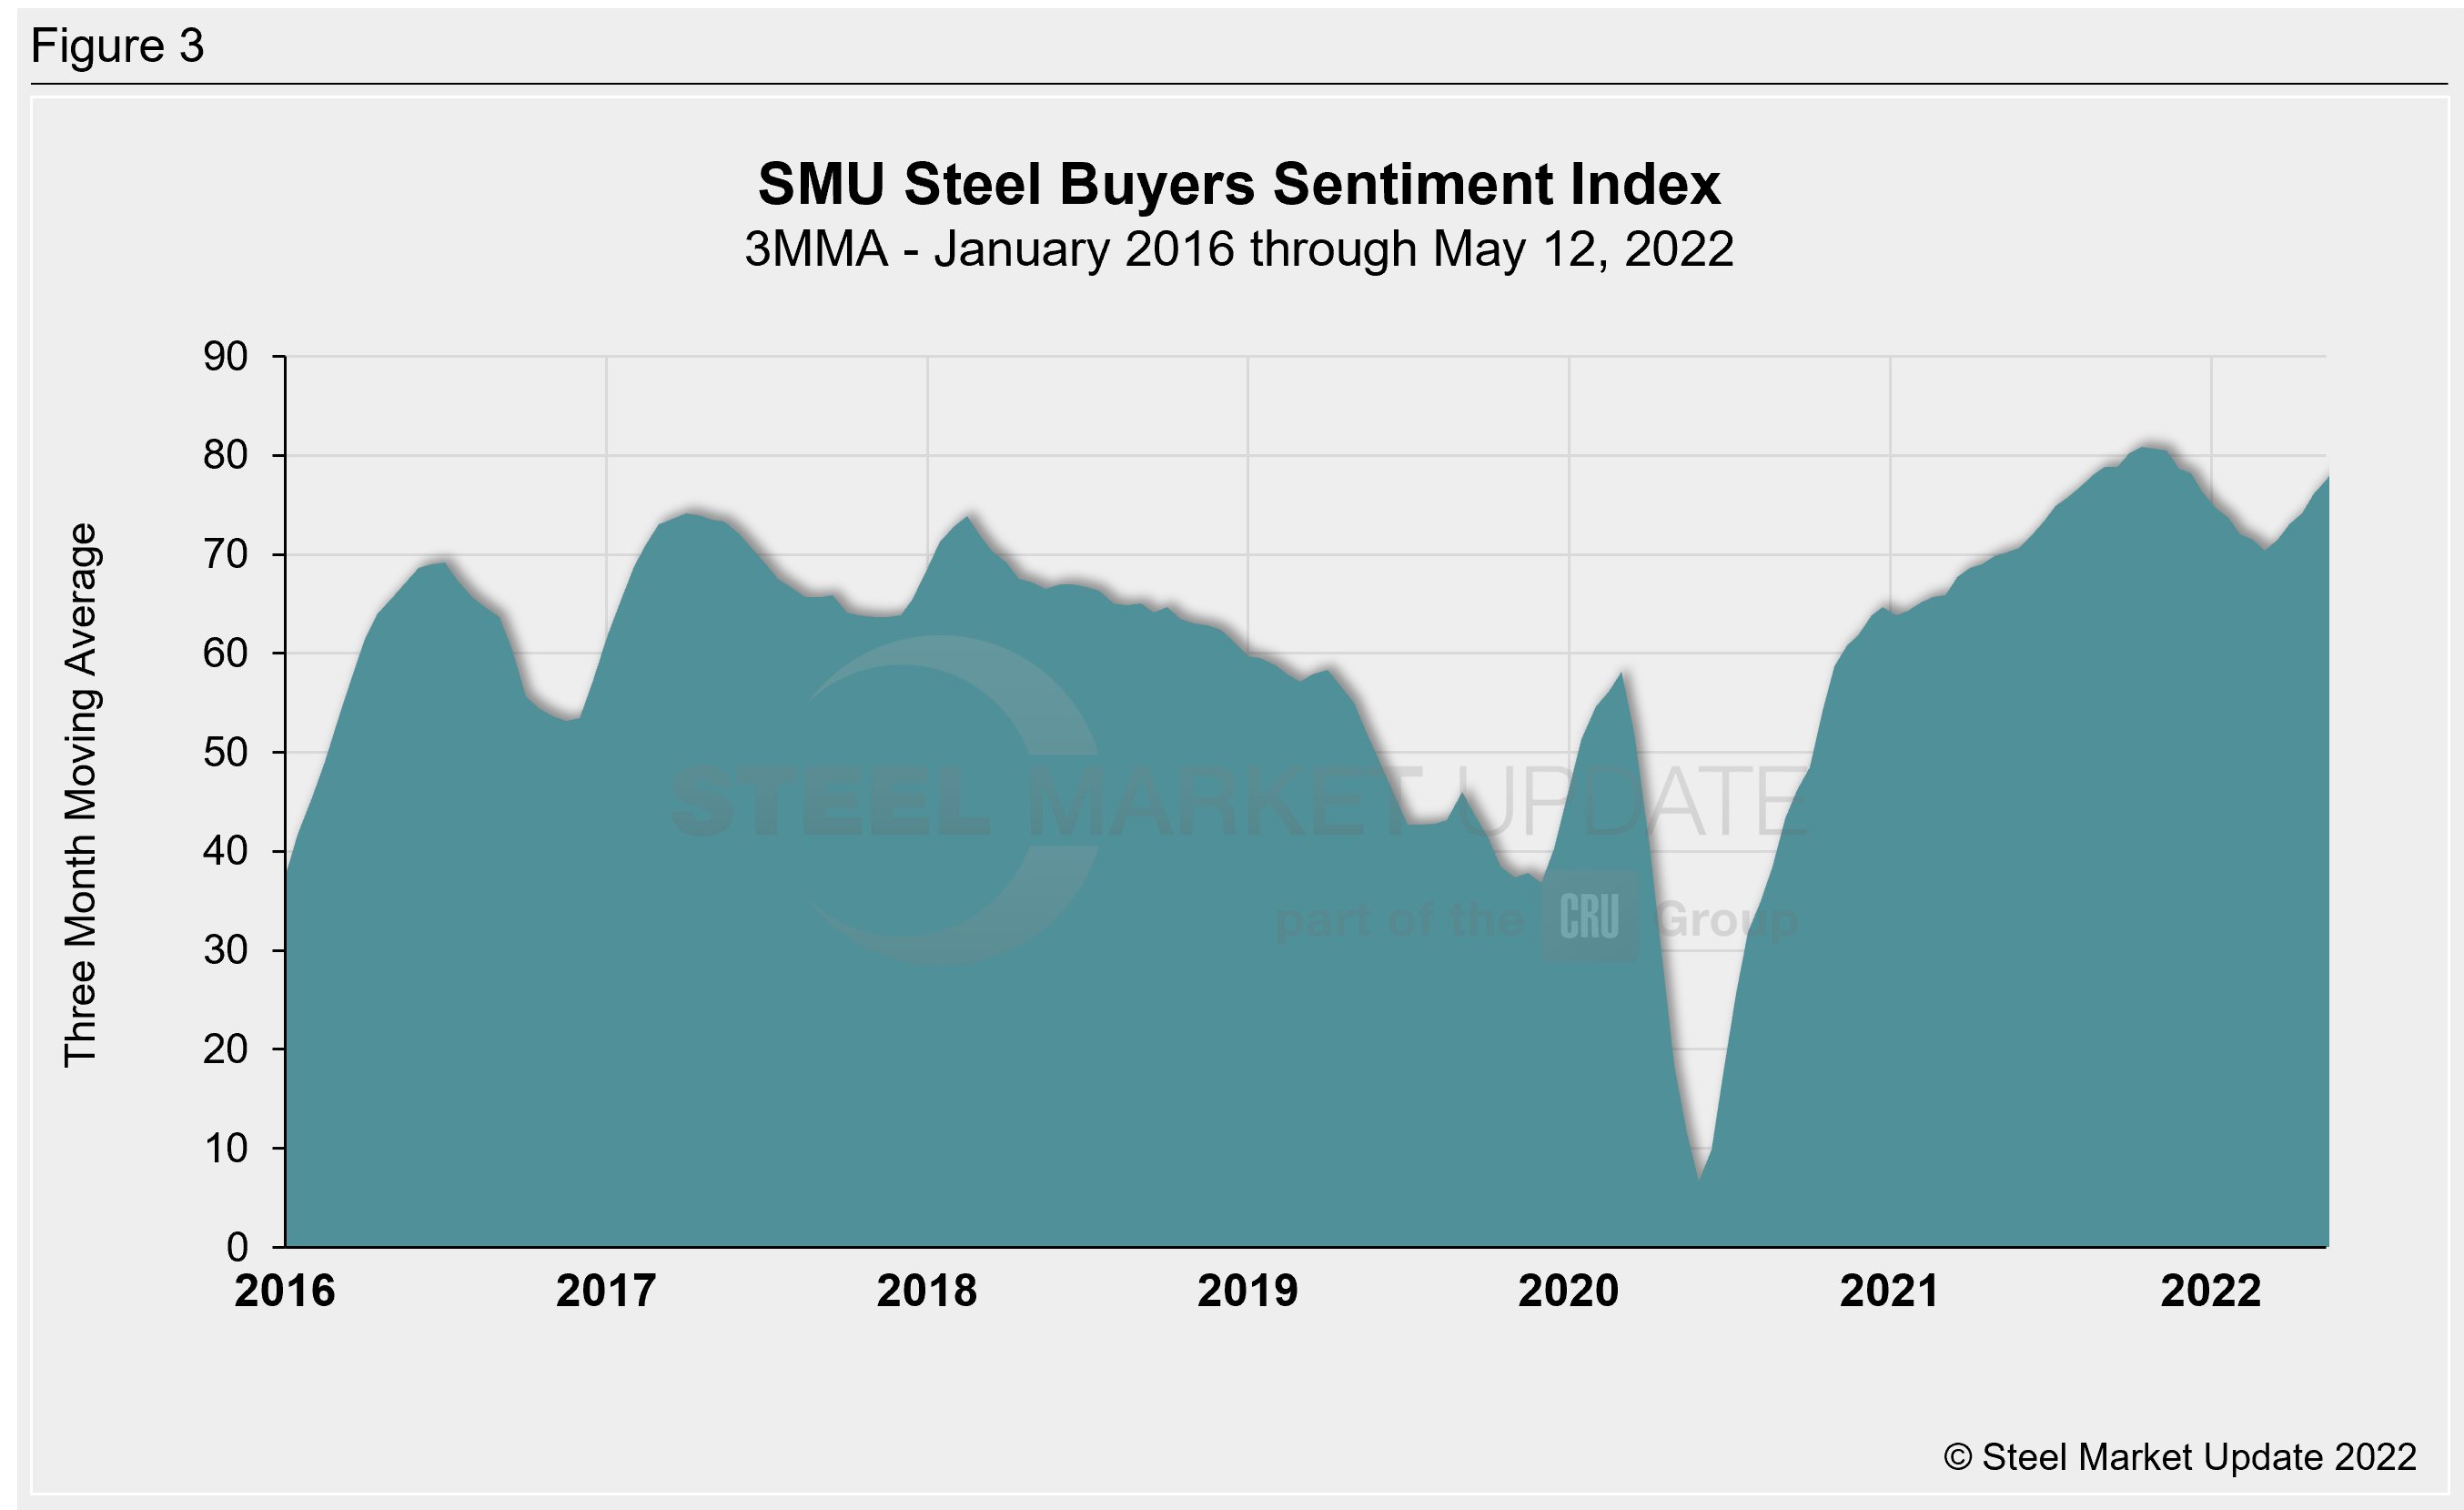
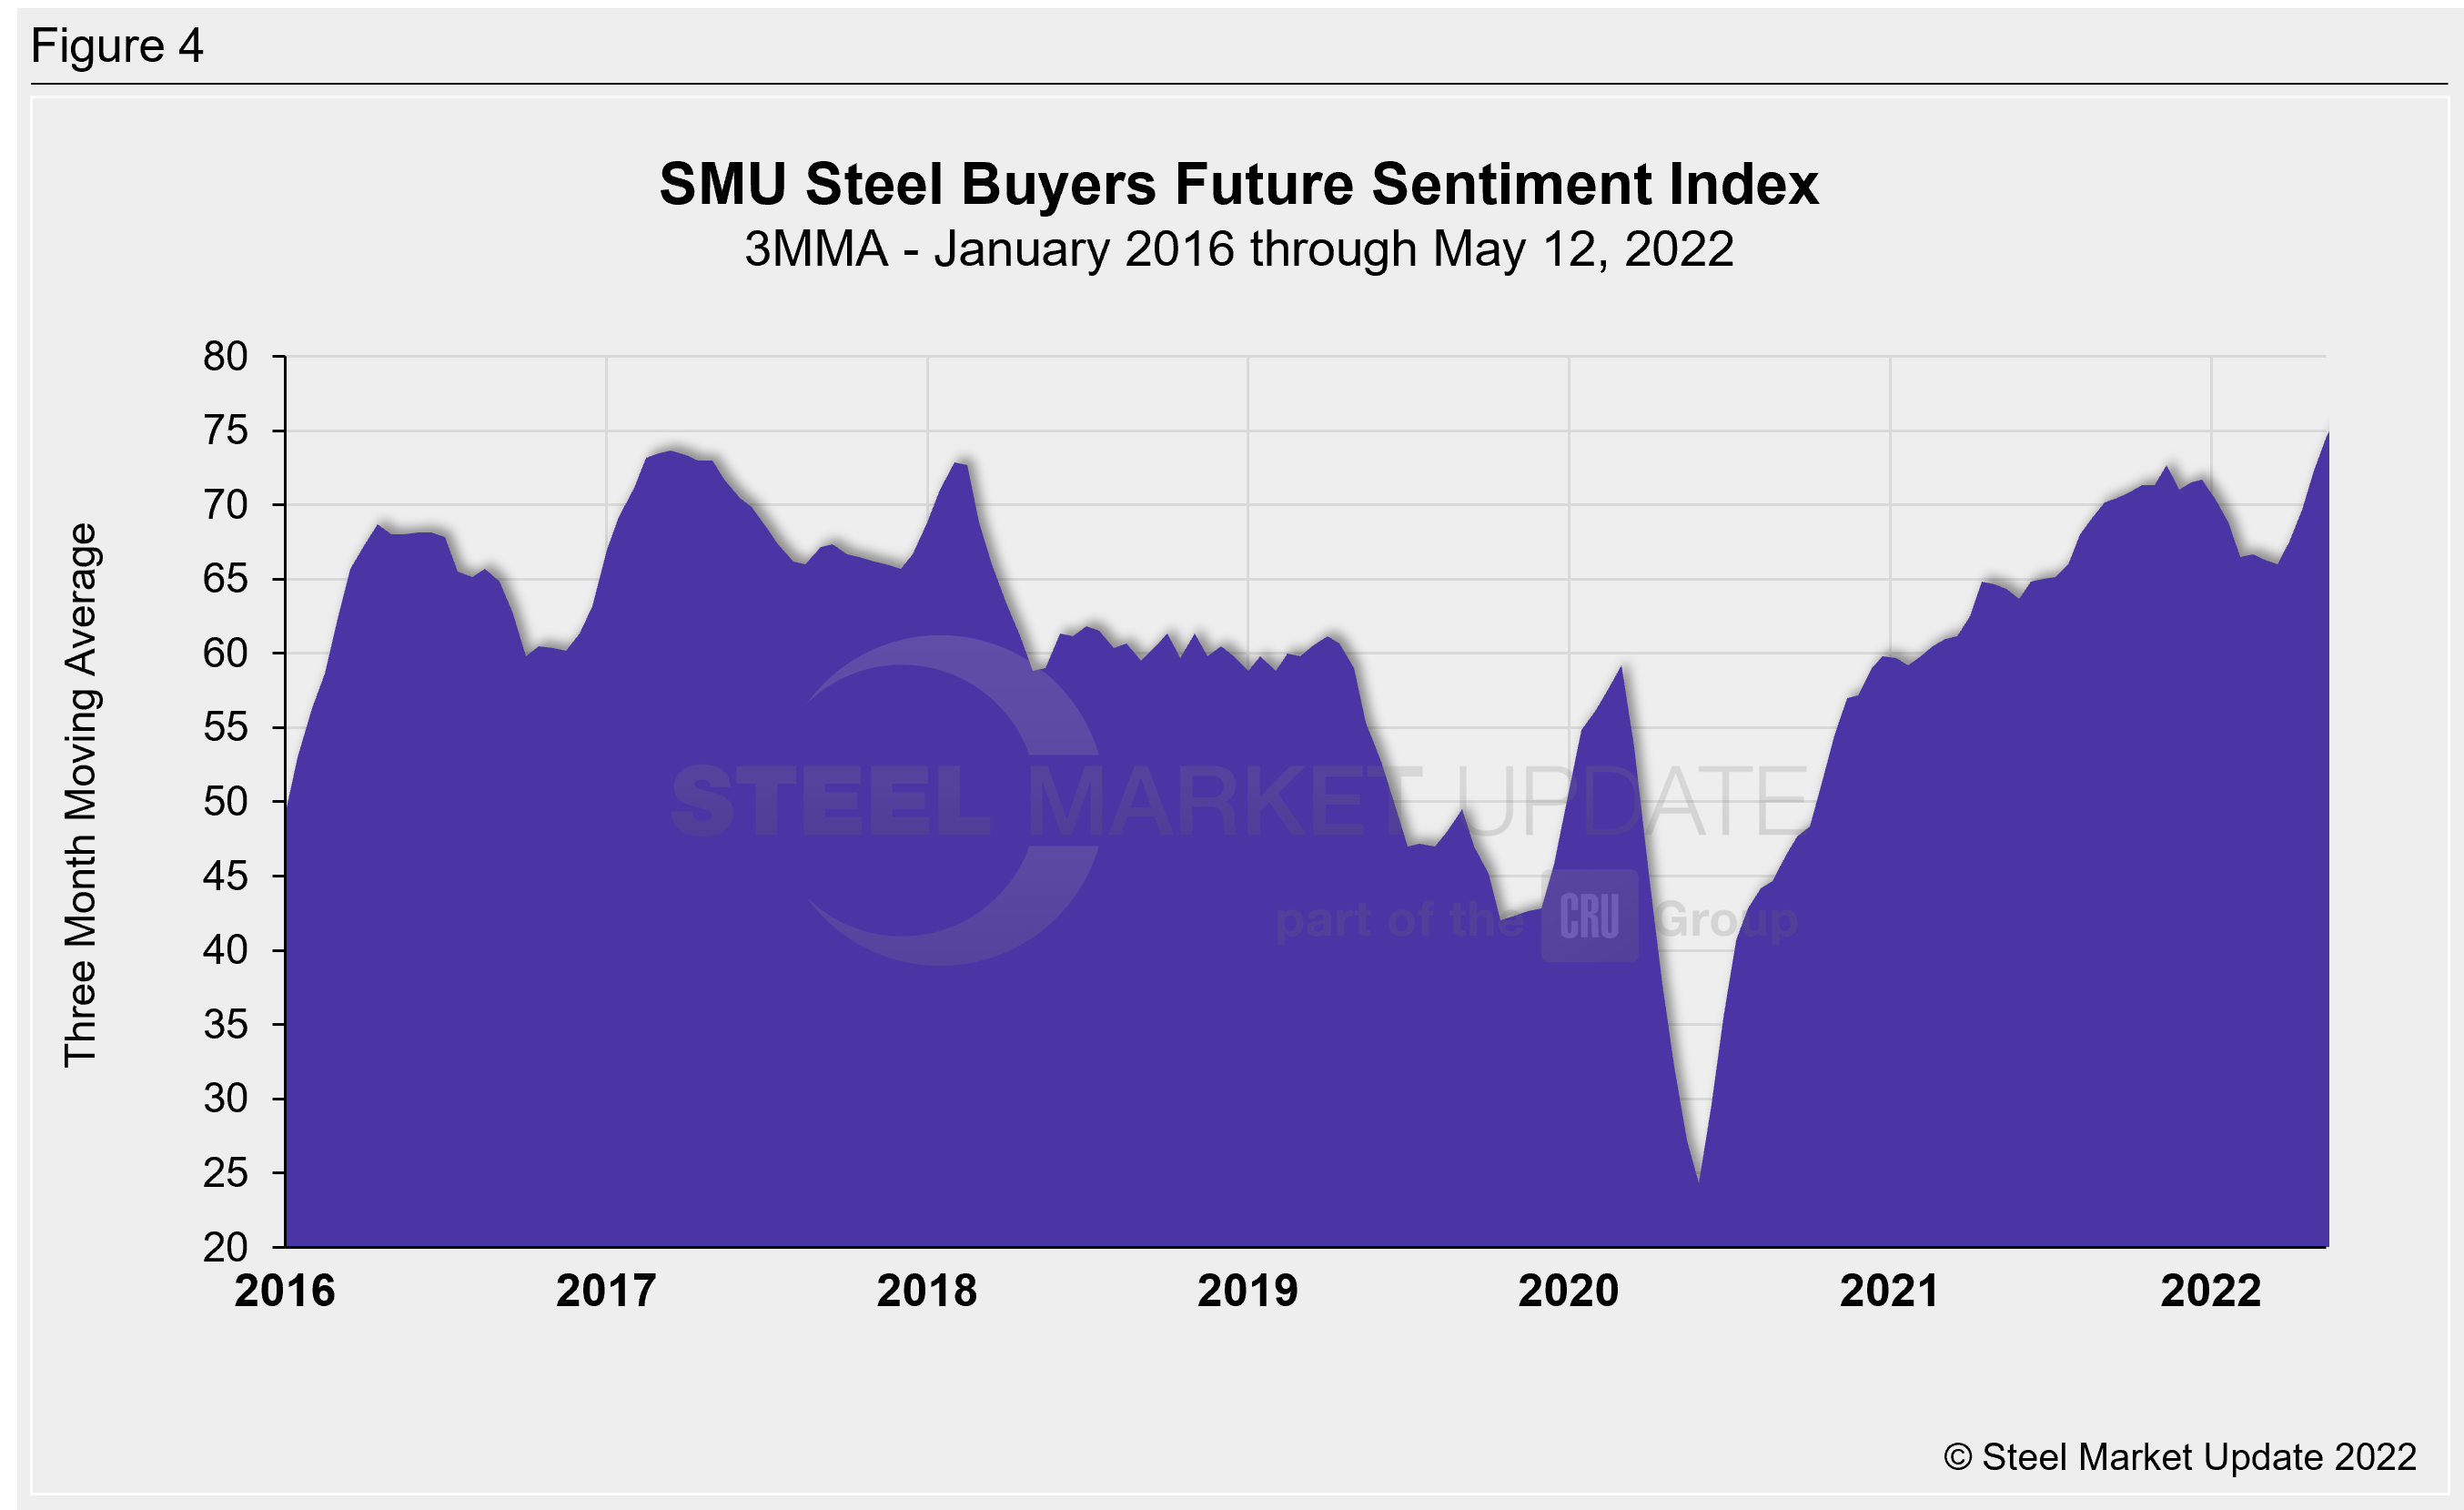
Measured as a three-month moving average, the Current Sentiment 3MMA rose to +77.50, its highest mark since early December 2021. Future Sentiment 3MMA hit a new all-time high at +74.67, surpassing the previous high of +73.67 in March 2017.
These latest findings indicate that steel buyers’ attitudes remain positive despite correcting prices and shifting market conditions. Historical data of the three-month moving average for Current Sentiment and Future Sentiment dating back to 2016 are dsiplayed below in Figure 3 and Figure 4.
Despite the bullish readings on sentiment, comments form SMU survey respondents were mixed. Some said the quick price correction was creating a cash crunch. But other said activity remained good. Following are a few excerpts from SMU’s latest survey:
“Activity is still good, but prices are declining.”
“Home construction drives our business, and I think there is still plenty of demand.”
“We’re going to have a wonderful uarter and lock up a very productive 1H of the year. That is all that really matters.”
“Some clouds are forming out there, so the back half of this year will be interesting. ’23 ought to be solid though between the infrastructure spend and auto’s return.”
Tracking steel buyers’ sentiment is helpful in predicting their future behavior.
About the SMU Steel Buyers Sentiment Index
SMU Steel Buyers Sentiment Index is a measurement of the current attitude of buyers and sellers of flat-rolled steel products in North America regarding how they feel about their company’s opportunity for success in today’s market. It is a proprietary product developed by Steel Market Update for the North American steel industry.
Positive readings run from +10 to +100. A positive reading means the meter on the right-hand side of our home page will fall in the green area indicating optimistic sentiment. Negative readings run from -10 to -100. They result in the meter on our homepage trending into the red, indicating pessimistic sentiment. A reading of “0” (+/- 10) indicates a neutral sentiment (or slightly optimistic or pessimistic), which is most likely an indicator of a shift occurring in the marketplace. Sentiment is measured via Steel Market Update surveys that are conducted twice per month. We display the meter on our home page.
We send invitations to participate in our survey to more than 600 North American companies. Our normal response rate is 100-150 companies. Approximately 40 percent are manufacturers, 40 percent are service centers/distributors, and the remainder are steel mills, trading companies or toll processors involved in the steel business.
Click here to view an interactive graphic of the SMU Steel Buyers Sentiment Index or the SMU Future Steel Buyers Sentiment Index.
By David Schollaert, David@SteelMarketUpdate.com


