Prices

June 2, 2022
HRC & Bush Futures: Post-March Hangover Sends Futures into Hibernation
Written by David Feldstein
Editor’s note: SMU Contributor David Feldstein is president of Rock Trading Advisors. Rock provides customers attached to the steel industry with commodity price risk management services and market intelligence. RTA is registered with the National Futures Association as a Commodity Trade Advisor. David has over 20 years of professional trading experience and has been active in the ferrous derivatives space since 2012.
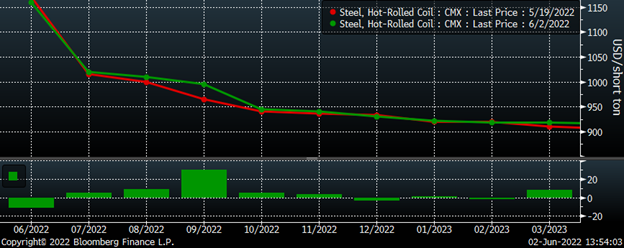
After the most intense period in the history of the HRC futures in March, the exhausted market is taking a much-needed rest. This chart shows the CME Midwest HRC futures curve’s settlements earlier today and from two weeks ago. In the lower panel it shows each future’s change over that period. Except for September’s $30 gain, no month has moved by more than $11 up or down.
CME Hot Rolled Coil Futures Curve $/st
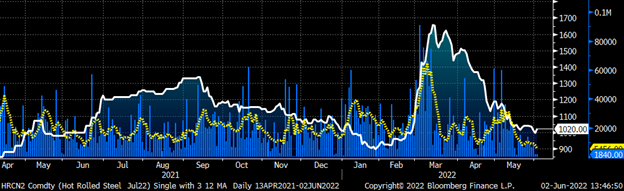
This chart shows the July future in white with daily volume for all futures months in blue and with a five-day average in yellow. The five-day volume average has collapsed to just below 5,500 tons from as high as 66,000 tons on March 9.
July CME HRC Future $/st w Volume & 5-Day Avg
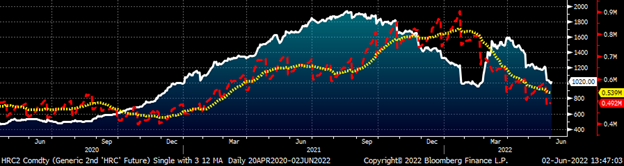
Open interest has also fallen dramatically. This chart is of the rolling second month HRC future with open interest in red, and a 22-day moving average in yellow shows open interest falling to its lowest level of 480,000 tons following last week’s expiration of the May futures contract.
Rolling 2nd Month CME Hot Rolled Coil Future $/st & Open Interest
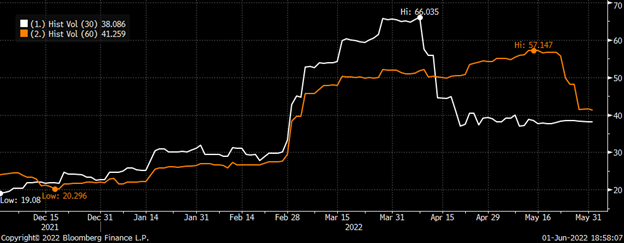
The sharp drop off in price movement has resulted in a steep drop for HRC future’s volatility. This annualized measure of price movement is typically computed in 30-, 60-, 90-day or longer periods. And as you can see, the 30-day peaked a month after volume collapsed while the 60-day crashed starting two months after volume sank. If the market continues to be rangebound with little movement as it has over the past two weeks, expect volatility to continue to drop like a rock. Volatility is the key component in option pricing like helium in balloon. All things being equal, increased volatility inflates option prices while decreased volatility deflates them.
July CME HRC Future 30-Day and 60-Day Historical Annualized Volatility
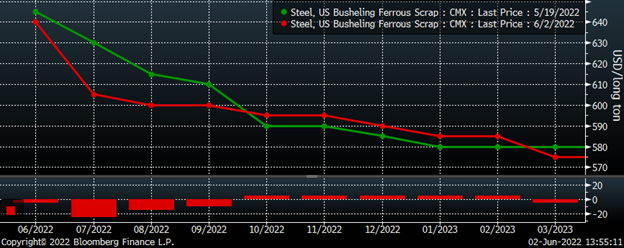
The same abrupt halt in volatility is happening in the busheling futures market with July’s $25 decline the largest on the downside and no month gaining more than $5 on the upside.
CME Busheling Futures Curve $/lt
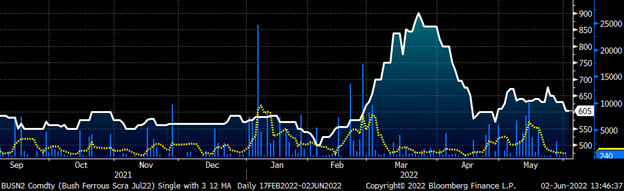
The busheling market is seeing the same collapse in volume with its five-day average below 800 tons per day for the fifth straight day today.
Rolling Front Month CME Busheling Future $/lt w Volume & 5-Day Avg.
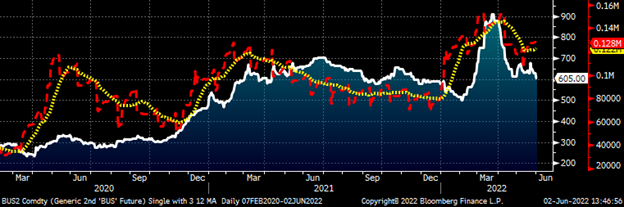
The one difference is a slight uptick in open interest seen in the busheling futures market.
Rolling 2nd Month CME Busheling Future $/lt & Open Interest
Disclaimer: The content of this article is for informational purposes only. The views in this article do not represent financial services or advice. Any opinion expressed by Feldstein should not be treated as a specific inducement to make a particular investment or follow a particular strategy, but only as an expression of his opinion. Views and forecasts expressed are as of date indicated, are subject to change without notice, may not come to be and do not represent a recommendation or offer of any particular security, strategy or investment. Strategies mentioned may not be suitable for you. You must make an independent decision regarding investments or strategies mentioned in this article. It is recommended you consider your own particular circumstances and seek the advice from a financial professional before taking action in financial markets.