

Market Data

October 13, 2022
Steel Mill Lead Times Stable
Written by Brett Linton
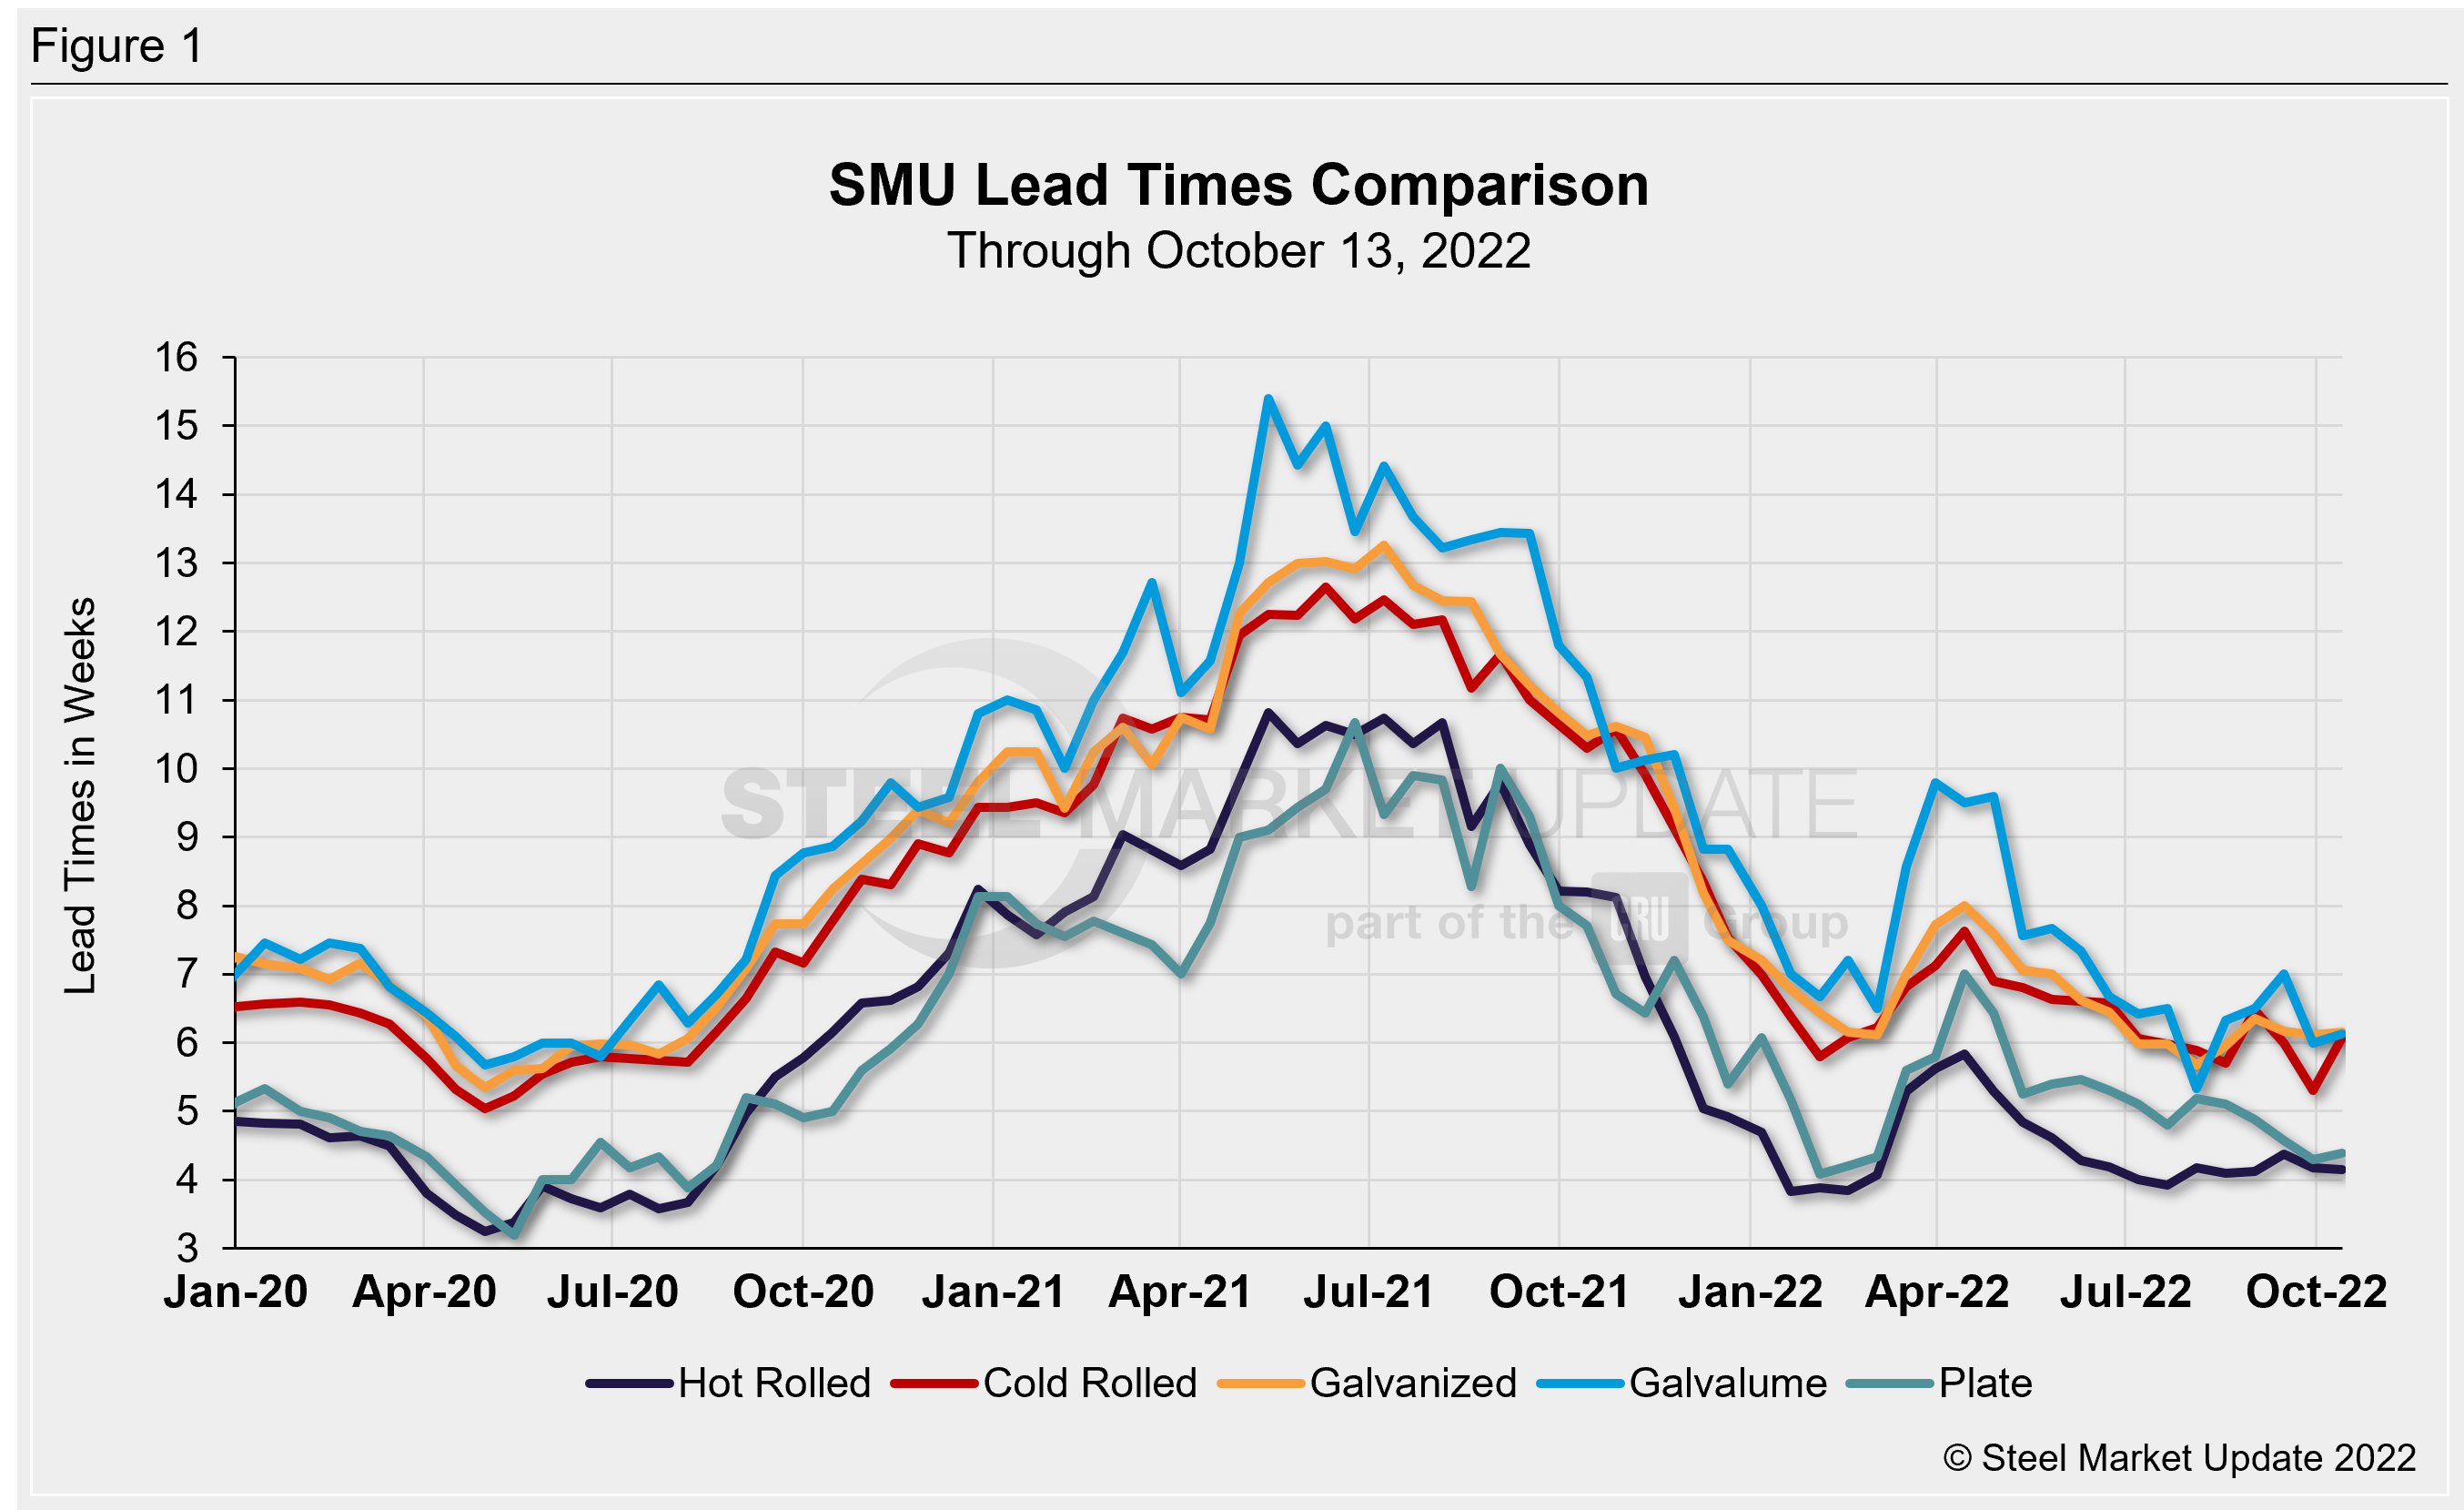
Steel mill lead times were relatively unchanged this week for four of the five products tracked by Steel Market Update. Our latest lead times analysis shows that production times on hot-rolled steel held steady compared to our previous market check. Galvanized, Galvalume, and plate lead times all extended just 0.1 weeks, while cold rolled lead times jumped 0.8 weeks compared to levels two weeks ago.
On average, lead times extended by 0.2 weeks compared to two weeks prior, down 0.2 weeks compared to this time last month. Following their peak in April, sheet lead times have remained somewhat stable since July/August. Plate lead times have gradually shrunk over the past six months.
Surveyed buyers reported mill lead times ranging from 3–6 weeks for hot rolled, 5–8 weeks for cold rolled and galvanized, 5–7 weeks for Galvalume, and 2–6 weeks for plate.
SMU’s hot rolled lead time was unchanged from late September at 4.2 weeks. One month ago HR lead times were at 4.4 weeks. Recall that the lowest level this year was 3.8 weeks seen in January/February. The record low in our ~11-year data history was 2.8 weeks in October 2016.
Cold rolled lead times rose almost one full week to 6.1 weeks (they were previously at the lowest level recorded since May). One month ago, cold rolled lead times were at 6.0 weeks.
Galvanized and Galvalume lead times both increased marginally, up by 0.1 weeks to 6.2 and 6.1 weeks, respectively. Our record low for galvanized was 4.8 weeks in February 2015 and Galvalume was 5.1 weeks in February 2015. Note that Galvalume figures can be volatile due to the limited size of that market and our smaller sample size.
Plate lead times rose 0.1 weeks to 4.4 weeks. Recall that the late September level was the lowest seen since February (4.1 weeks), and prior to that month, the last time plate lead times were this low was in August 2020. In our four-year history of plate lead times, the lowest figure we have recorded was 3.2 weeks in May 2020.
Looking down the road, 69% of the executives responding to this week’s questionnaire told SMU they believe lead times will be relatively flat two months from now. This is down from a rate of 80% when polled two weeks ago. 19% of buyers reported lead times would be extending, up from 16% in our previous survey. 12% said lead times would be contracting, versus 4% two weeks prior. Here is what a few of our respondents had to say:
“It has to be flat, we’re still looking at supply > demand right now.”
“They are pretty low to normal now, expect buying to increase starting the new year.”
“They will begin extending right at about two months from now.”
“[Extending] due to outages and lack of imports.”
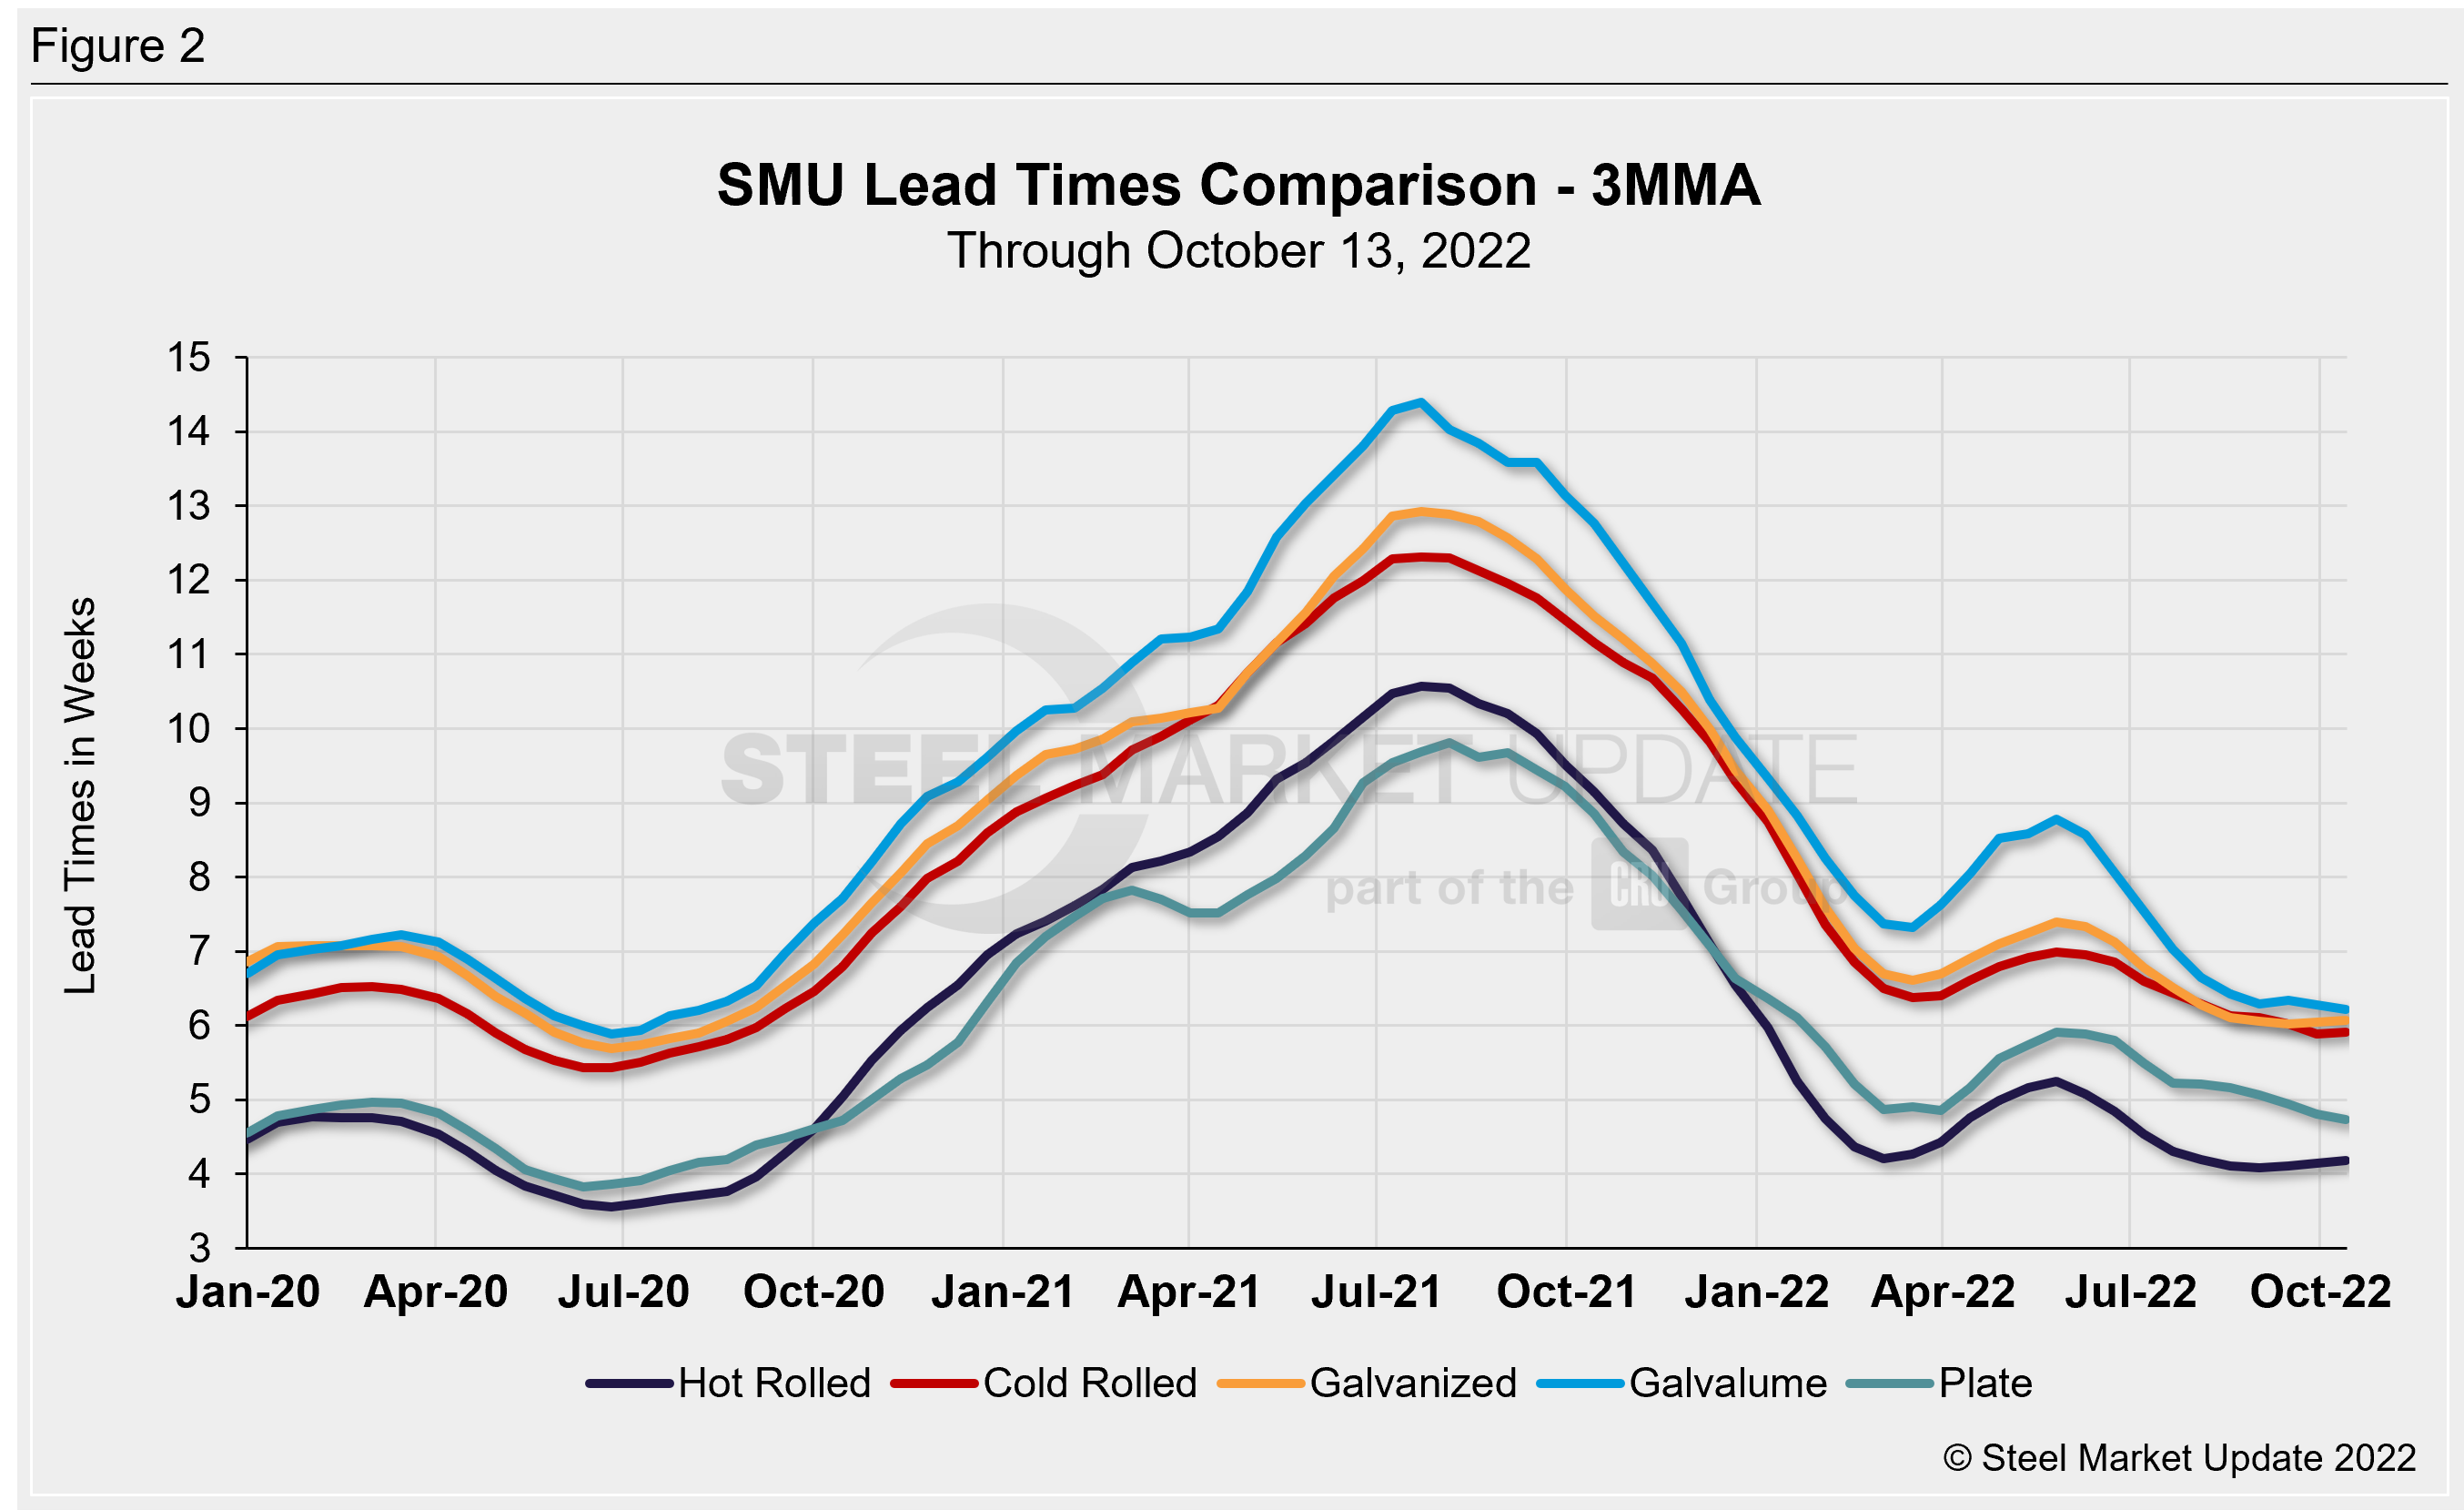
Looking at lead times on a three-month moving average (3MMA) can smooth out the variability in the biweekly readings. As a 3MMA, most products have been steady for the last two months. The latest 3MMA lead time for hot rolled rose 0.1 weeks to 4.2 weeks, previously unchanged since mid-August. Cold rolled held steady at 5.9 weeks, now at a two-plus-year low. Galvanized lead times rose 0.1 weeks to 6.1 weeks (the previous 3MMA of 6.0 was the lowest level seen since August 2020). Galvalume lead times declined 0.1 weeks to 6.2 weeks, now the lowest level seen since August 2020. Plate lead times also declined 0.1 weeks, now at 4.7 weeks, the lowest 3MMA measured since October 2020.
Note: These lead times are based on the average from manufacturers and steel service centers who participated in this week’s SMU market trends analysis. SMU measures lead times as the time it takes from when an order is placed with the mill to when the order is processed and ready for shipping, not including delivery time to the buyer. Our lead times do not predict what any individual may get from any specific mill supplier. Look to your mill rep for actual lead times. To see an interactive history of our Steel Mill Lead Times data, visit our website here.
By Brett Linton, Brett@SteelMarketUpdate.com


