

Market Data

November 28, 2022
ABI Dropped Below 50 in October on Declining Demand
Written by David Schollaert
Demand for design services from US architectural firms declined in October. The drop came after the pace of growth had slowed in recent months.
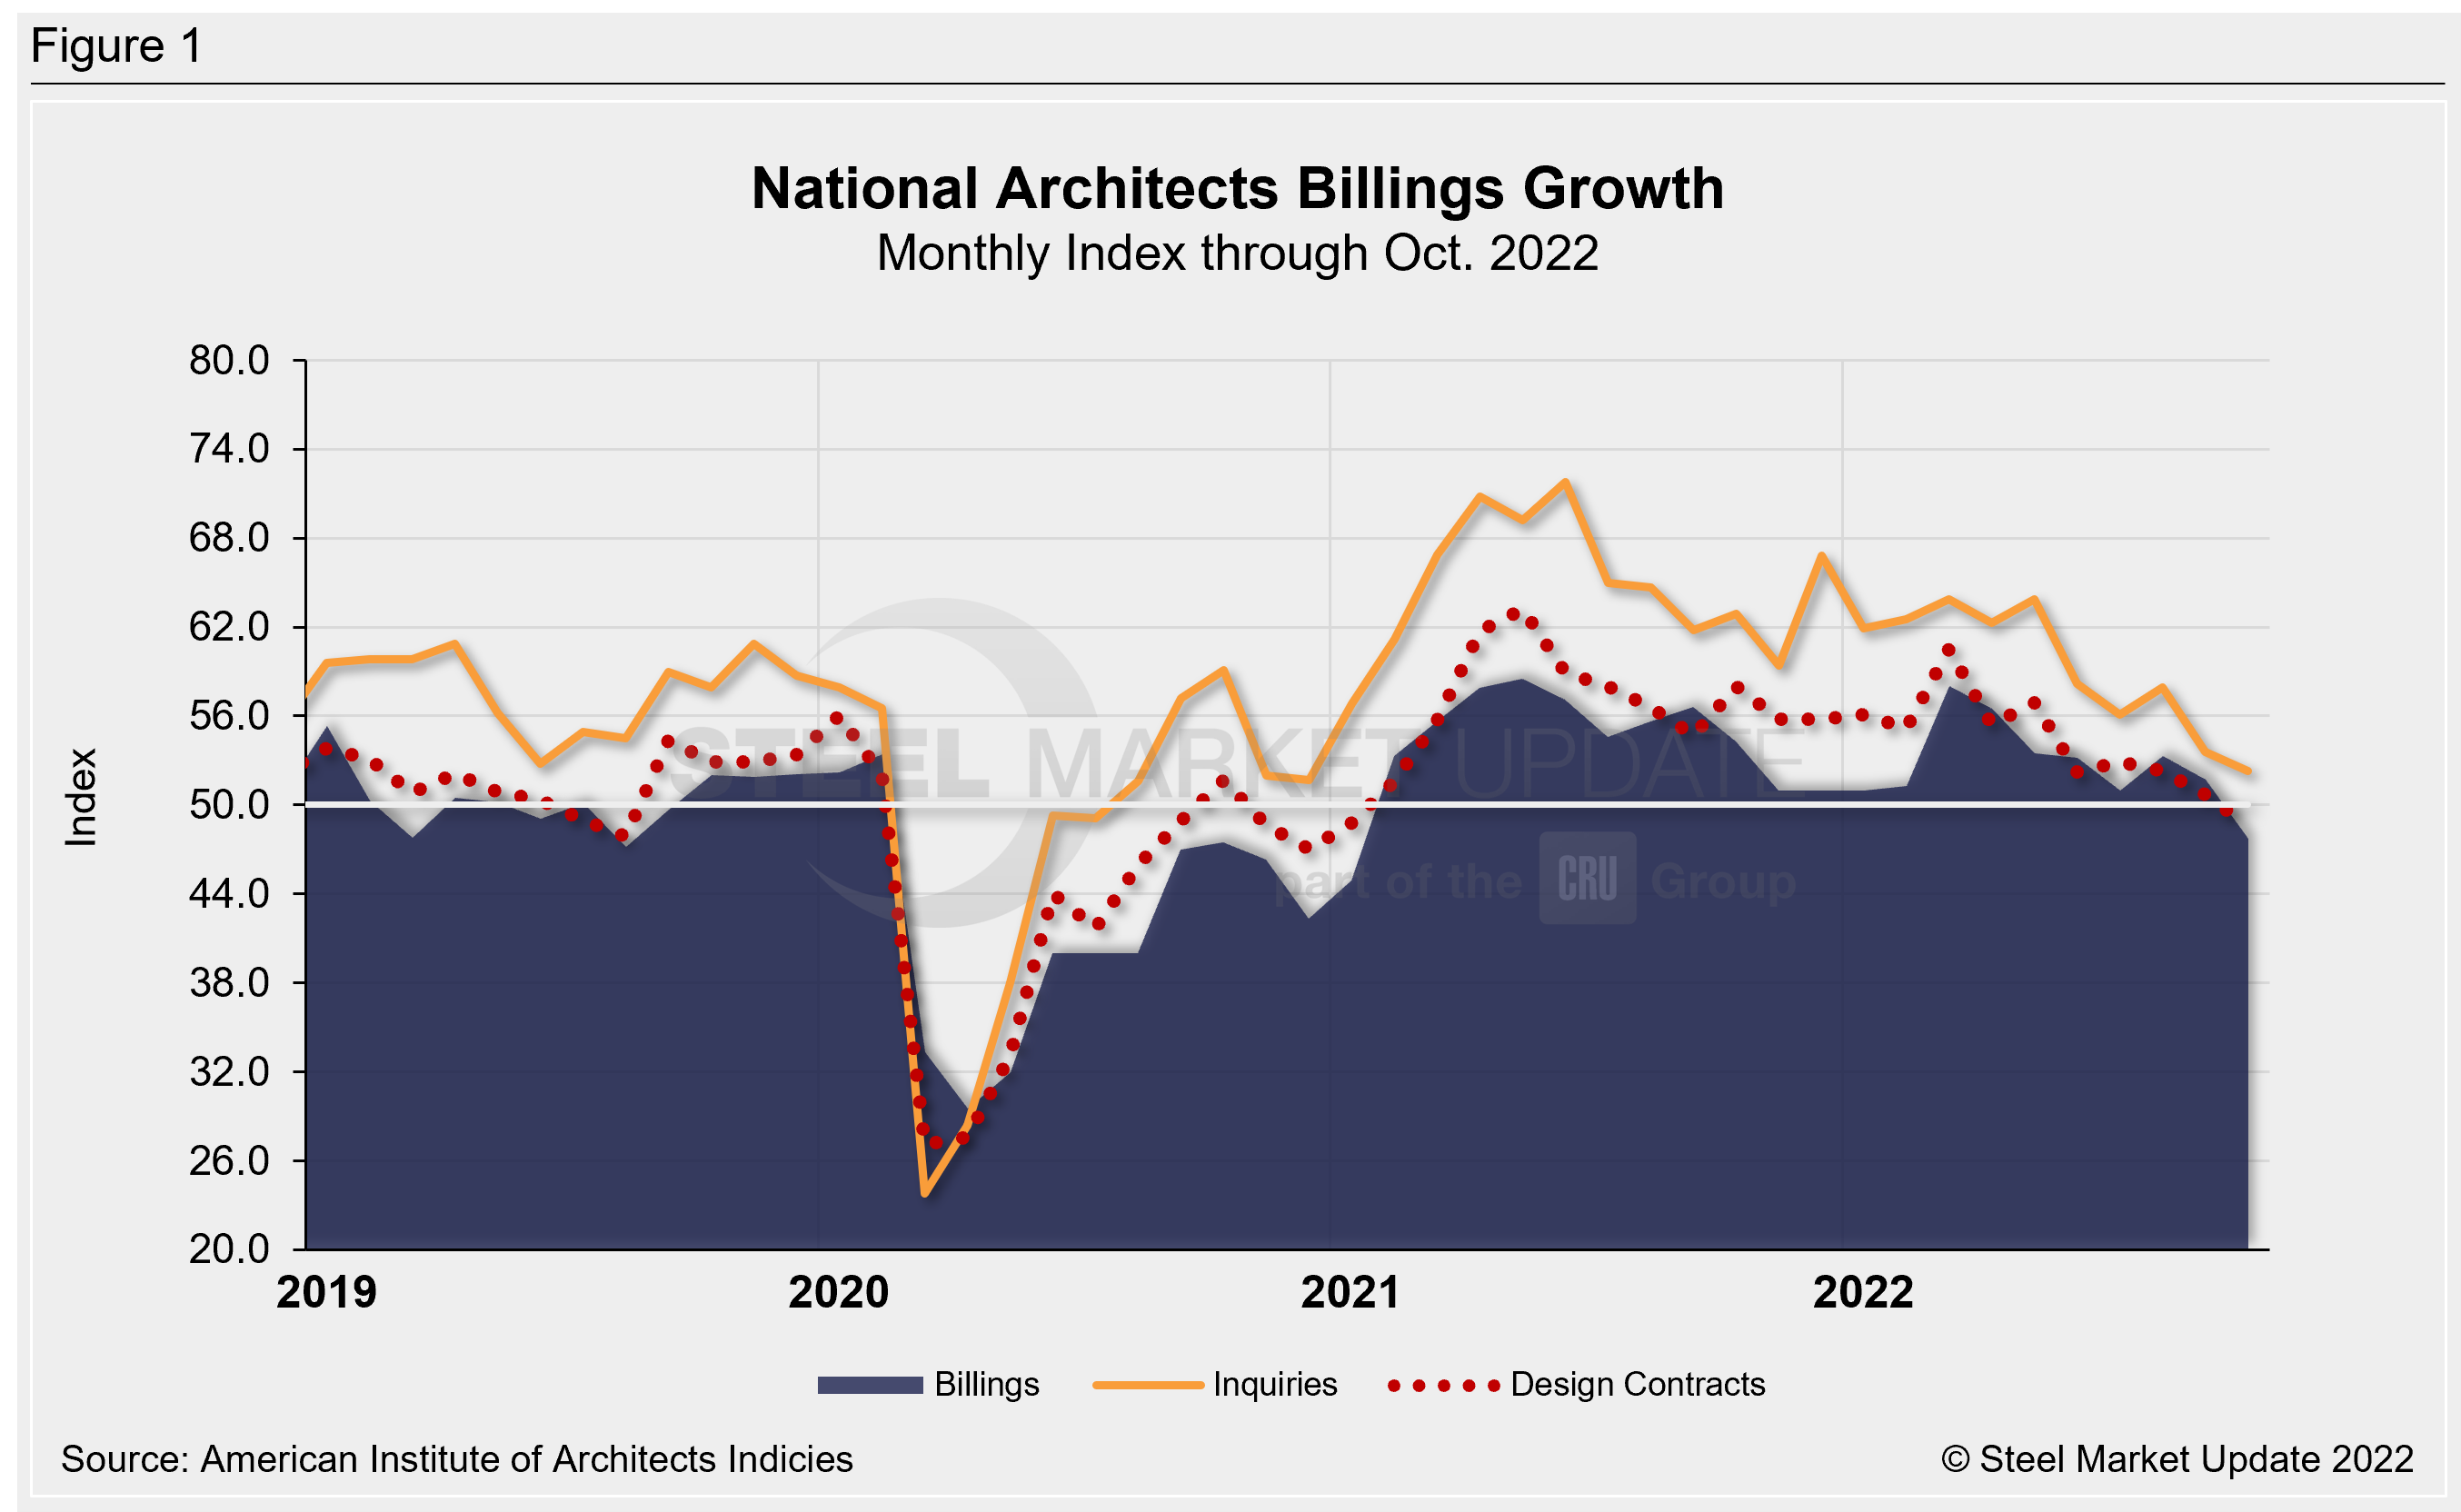
The October AIA Architecture Billings Index (ABI) score slipped below 50, ending a 20-month run of growth following the pandemic-induced downturn in 2020.
Recall that the ABI is an advanced economic indicator for nonresidential construction activity with a lead time of 9–12 months. A score above 50 indicates an increase in activity, and a score below 50 indicates a decrease.
The October ABI registered 47.7, down from September’s score of 51.7, according to the latest report from the American Institute of Architects (AIA). Last month’s result was the lowest score since January 2021. The result continues to point to ongoing issues such as inflation and economic uncertainty.
“Economic headwinds have been steadily mounting, and finally led to weakening demand for new projects,” said AIA chief economist Kermit Baker. “Firm backlogs are healthy and will hopefully provide healthy levels of design activity against fewer new projects entering the pipeline should this weakness persist.”
In October, new project inquiries and design contracts also declined month on month (MoM) to 52.3 and 48.6, respectively, from 53.6 and 50.7 in September. Though new inquiries still indicate robust growth, design contracts do not.
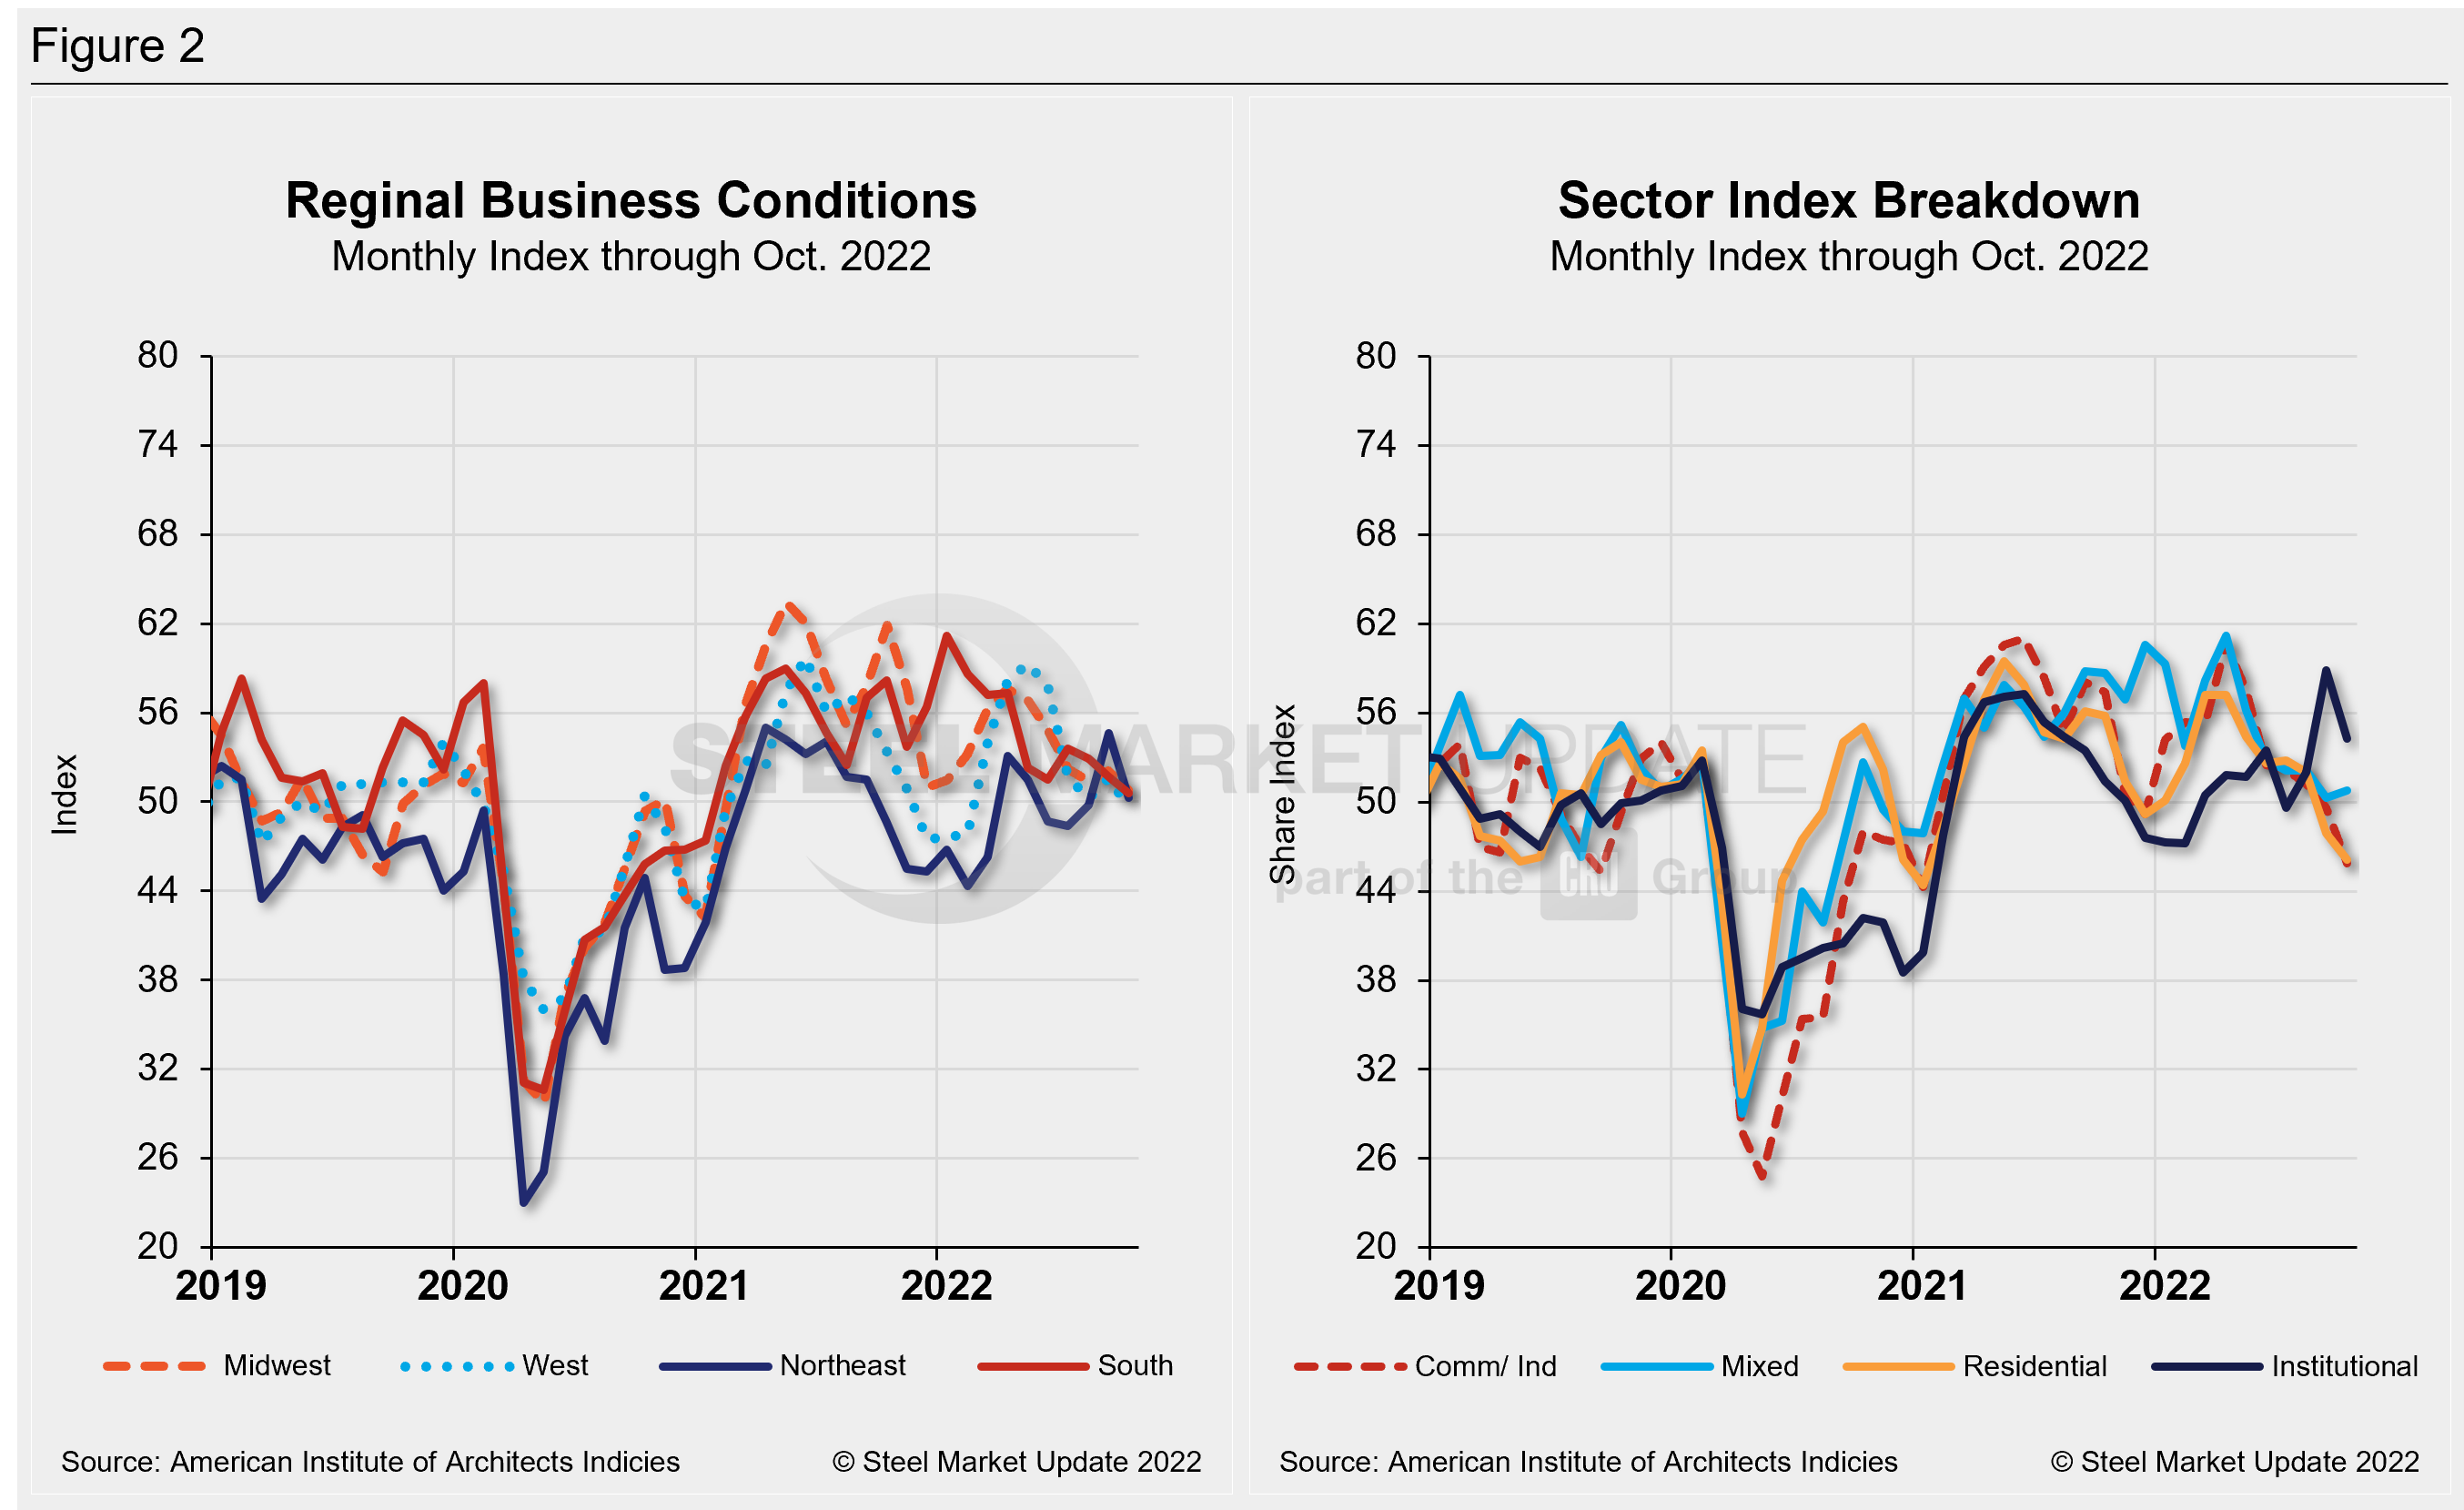
By region, the national average ABI score decreased. Business conditions in the Northeast still indicated modest growth despite slowing demand with a score of 50.3. Both the Midwest and the South also reported slowing growth with scores of 50.8 and 50.6, respectively. The West was the sole region to report a score under 50, coming in at 49.6.
Key ABI highlights for October include:
- Regional averages: Midwest (50.8); South (50.6); Northeast (50.3); West (49.6)
- Sector index breakdown: institutional (54.3); mixed practice (50.8); multi-family residential (46.1); commercial/industrial (45.9)
Regional and sector scores are calculated as 3MMA. Below are three charts showing the history of the AIA Architecture Billings Index, Reginal Business Conditions, and Sectors.
An interactive history of the AIA Architecture Billings Index is available on our website. Please contact us at info@SteelMarketUpdate.com if you need assistance logging into or navigating the website.
By David Schollaert, David@SteelMarketUpdate.com


