Market Segment

December 15, 2022
SMU Key Indicators Deteriorate, Outlook Weakens
Written by David Schollaert
Monthly Key Market Indicators (KMI) deteriorated over the past month after steadily improving since July, while steel buyer sentiment inched up after it had tumbled to a 26-month low, according to the latest analysis by Steel Market Update. Positive and neutral indicators have eased, while negative indicators rose.
Despite recent improvements, headwinds remain. The economy has shown some continued signs of strength by surprise gains in GDP and employment totals. But that will likely lead to additional rate hikes to tame inflation. Consumer confidence has also deteriorated as many speculate that there could be more pain ahead in the market if benchmark lending rates are driven higher.
Thus, consumers and businesses have grown more cautious about spending as decade-high inflation and ongoing supply disruptions continue to weigh on the economy. The outlook, as a result, has waned since last month’s analysis.
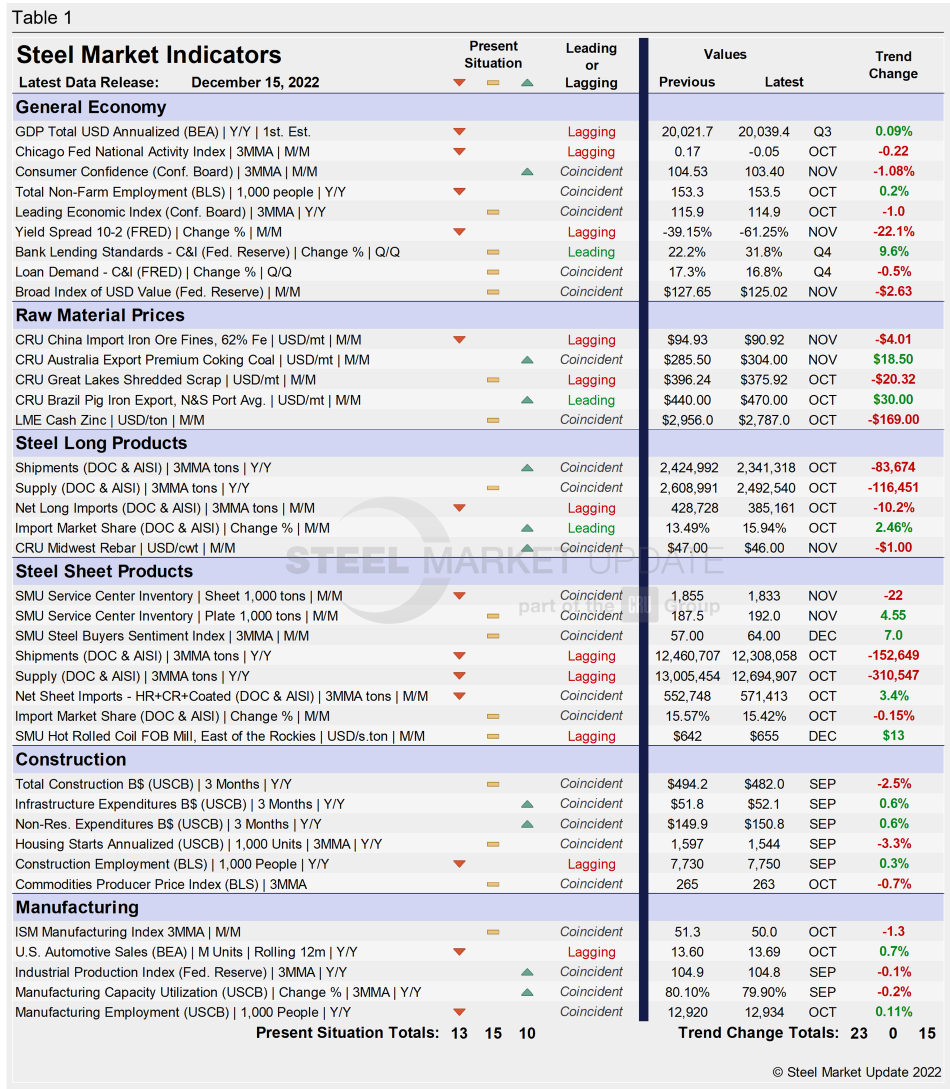
SMU’s KMI include data on the economy, raw materials, manufacturing, construction, and steel sheet and long products. They offer a snapshot of current sentiment and the near-term expected trajectory of the economy. Markers for the Present Situation had been slowly rising after positive indicators fell in July to their lowest totals since mid-2016.
In the latest data, just 10 of the 38 Present Situation indicators are positive, falling three points month on month (MoM). The neutral position also edged down while negative indicators rose over the same period. The neutral indicator fell by two points to 15, while the negative indicator gained five points to a reading of 13, the second-highest reading all year.
SMU’s Present Situation and Trends analyses in the table below are based on the latest available data as of Dec. 15. Readers should regard the color codes in the “Present Situation” column as a visual summary of the current market condition. The “Trend” columns are color-coded to give a quick visual snapshot of the market’s direction. All data included in this table was released within the past month. The month or specific date to which the data refers to is shown in the second column from the far right. Click to expand the table below.
Present Situation
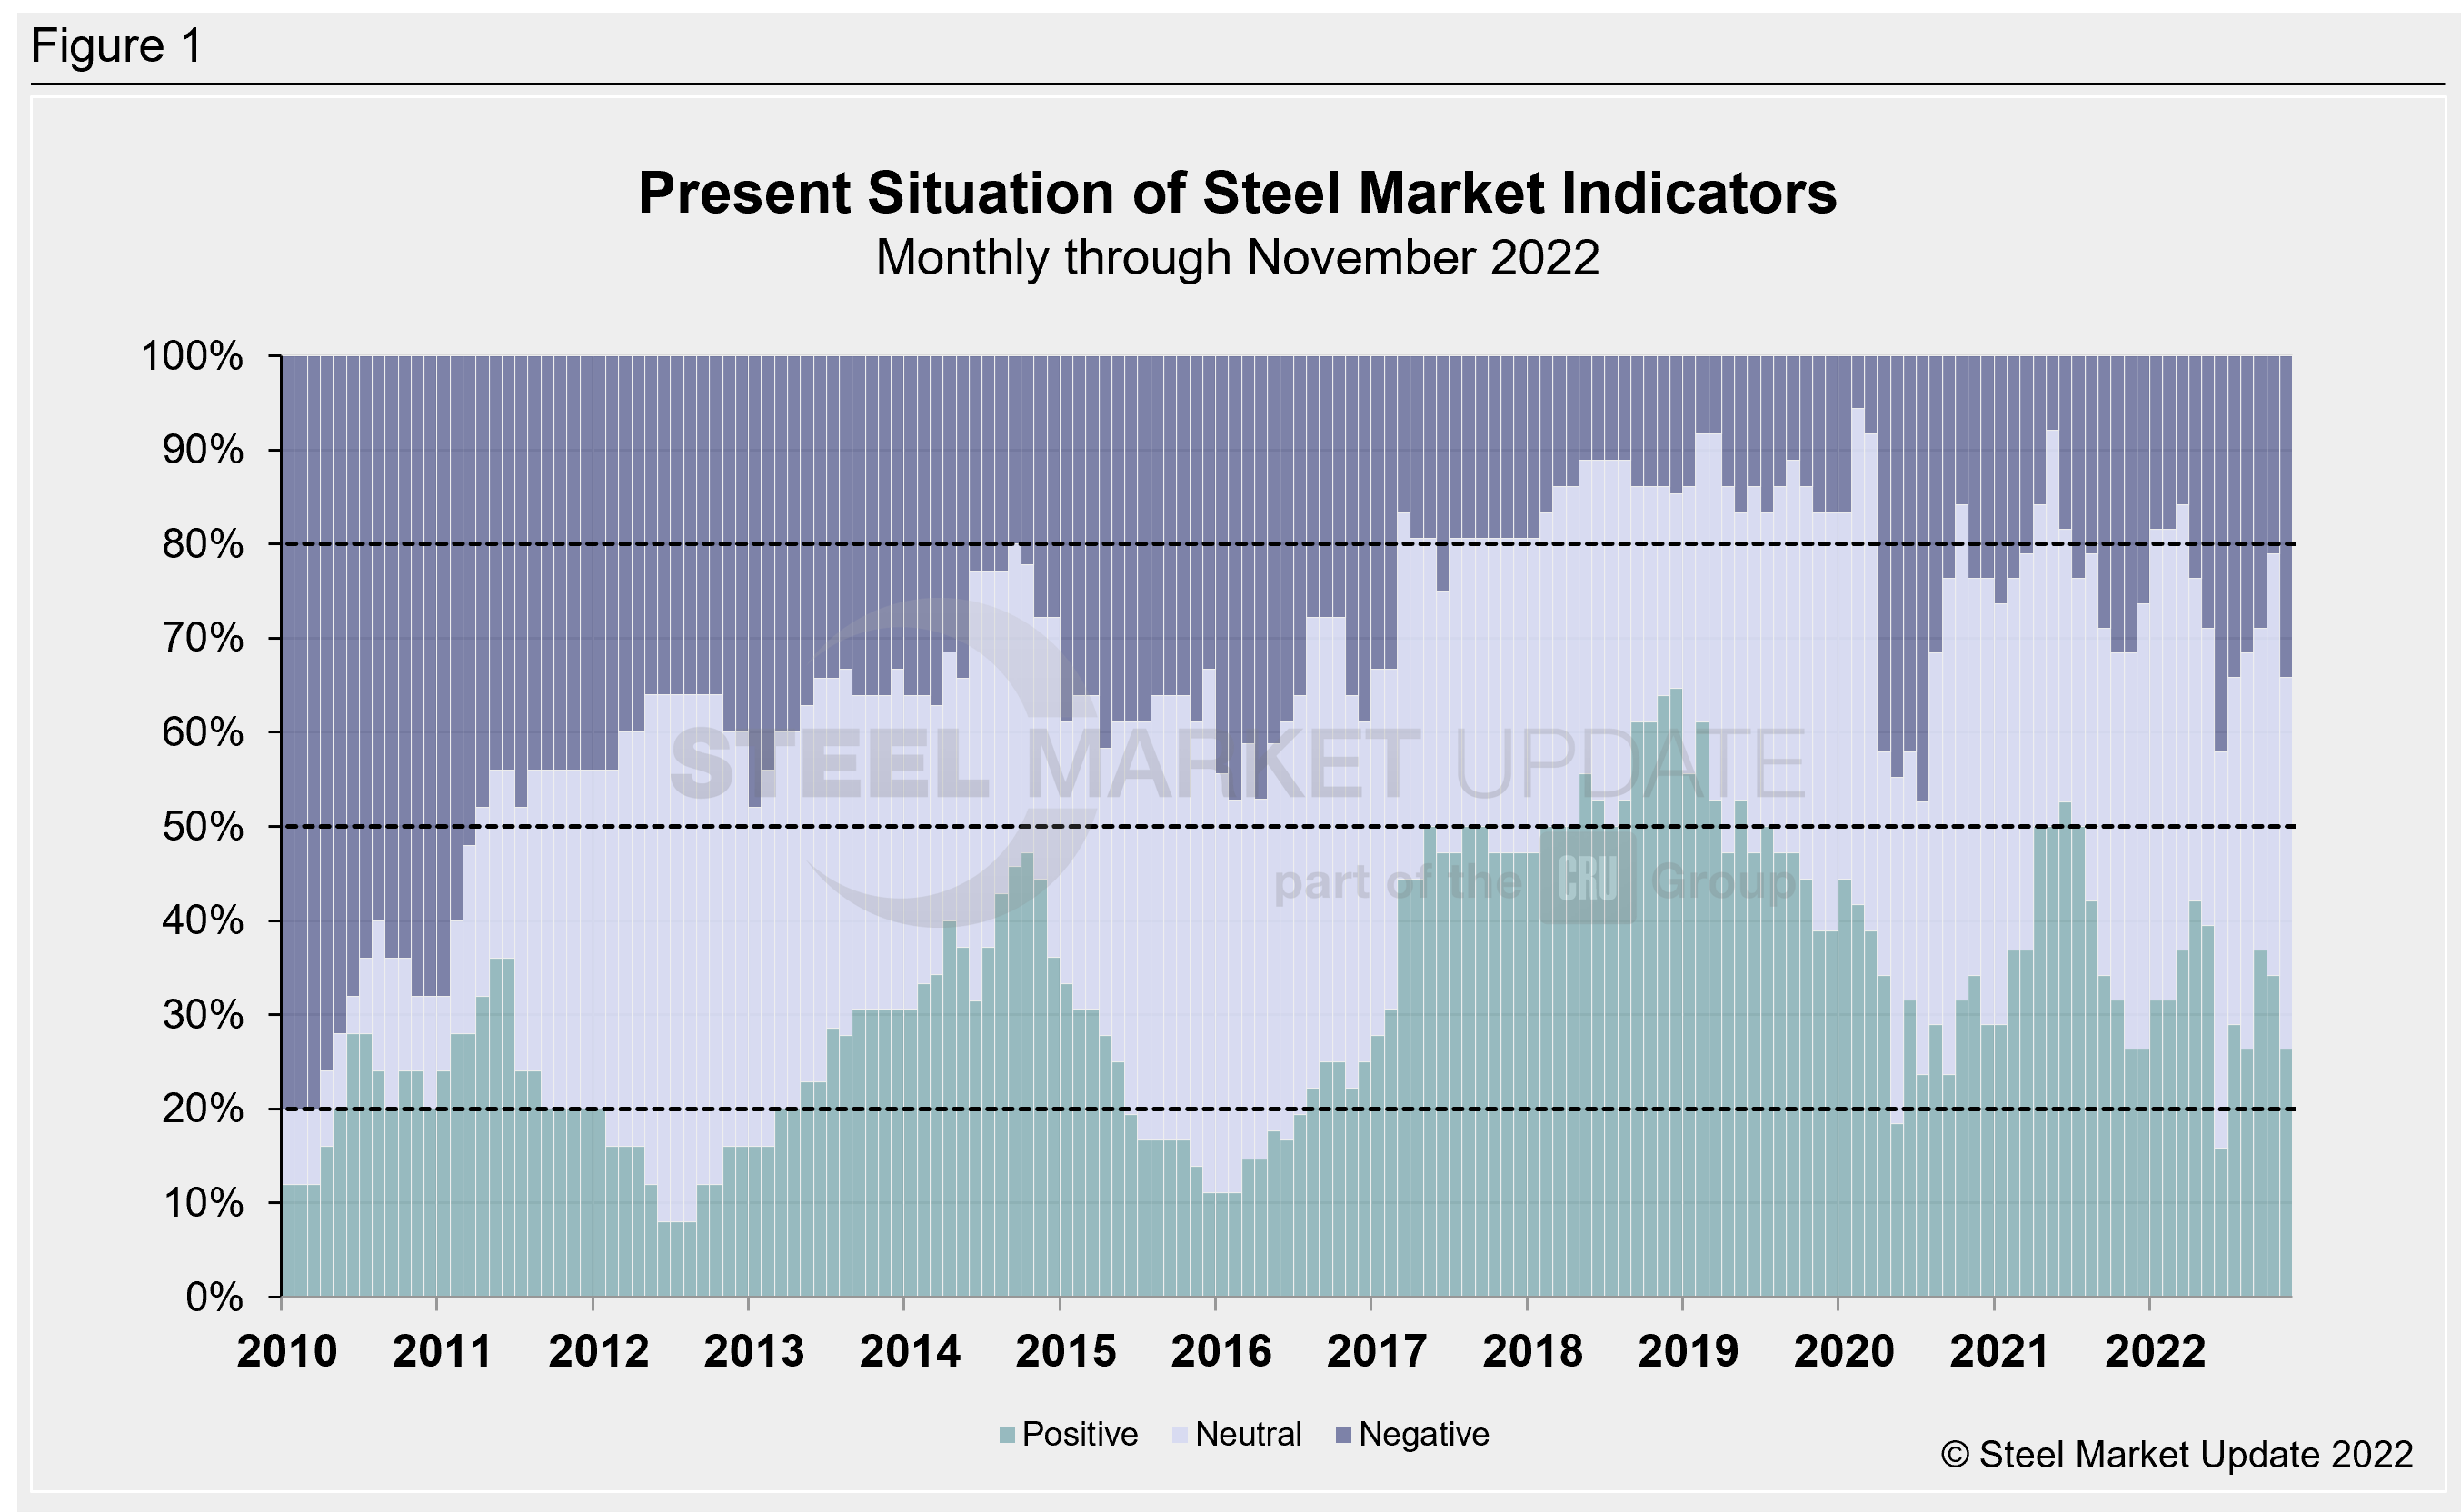
SMU’s Present Situation indicators below continue to highlight the uncertainty of the domestic market. Though positive markers remain, negative indicators took hold over the past month.
Through November, 34.2% of the marketplace is negative, a 13.2-percentage point increase MoM, nearing closer to June’s reading of 42.1%, its worst total since the height of the pandemic in July 2020. Presently, 26.3% of the market is positive, 7.9 percentage points lower when compared to the month prior, while 39.5% of the market is neutral – broadly still watchful.
With just a few more neutral and an increase in negative indicators, Present Situation indicators are now 65.8% as neutral-to-positive, according to SMU’s assessment of key market indicators, a noticeable decline from 78.9% one month ago.
Our monthly assessment of the Present Situation since January 2010 on a percentage basis is shown in Figure 1.
Trends
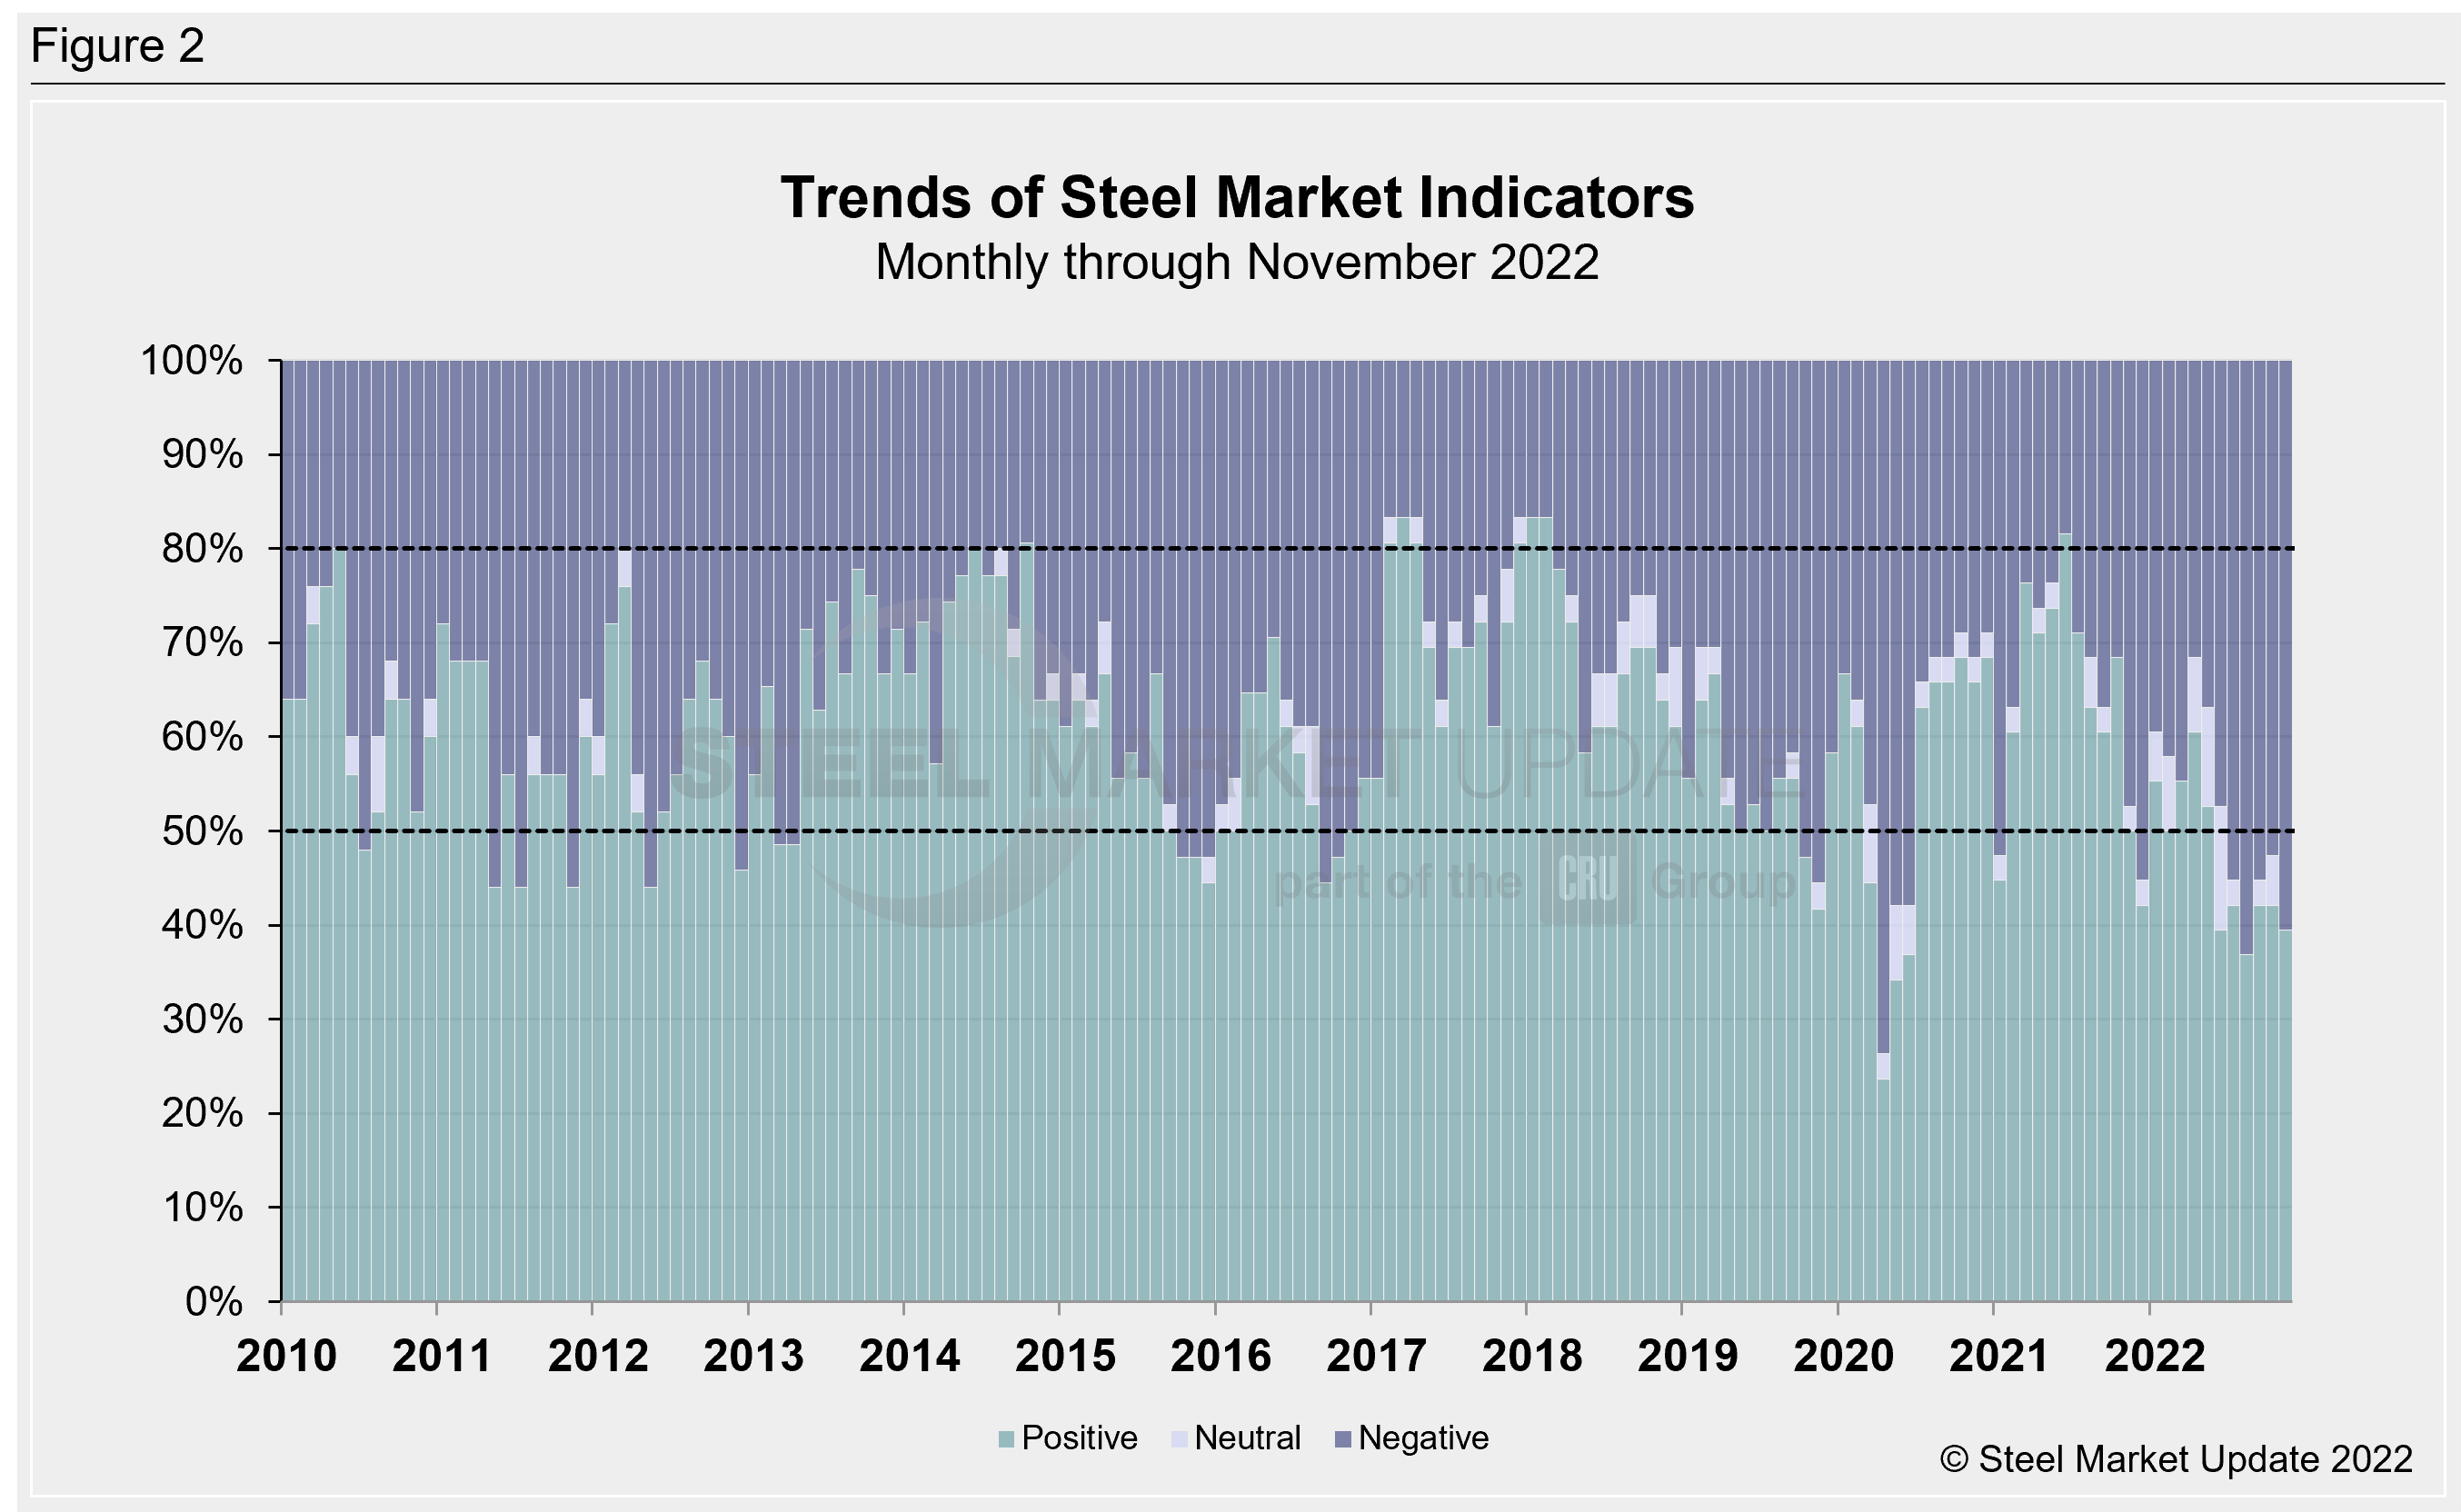
SMU’s Trends indicators also worsened of late, remaining on a considerable negative run. The dynamic points to a lack of long-term clarity resulting from the current headwinds facing the US economy.
It is important to remember that most values in the Trends columns are three-month moving averages (3MMA) to smooth variations in monthly data. Note that in many cases this is not November or December data, but data that was released in November and/or December for previous months. Compared to month-ago data, the negative trend rose from 52.6% to 60.5% in December. The neutral trend fell by 5.3 percentage points to a reading of zero. The positive trend also dipped, down to 2.6 percentage points to a measure of 39.5% over the same span.
The continued negative turn places December’s reading well behind the high of 81.6% seen in June 2021. Figure 2 shows the recent movement of the trends and historical data for comparison.
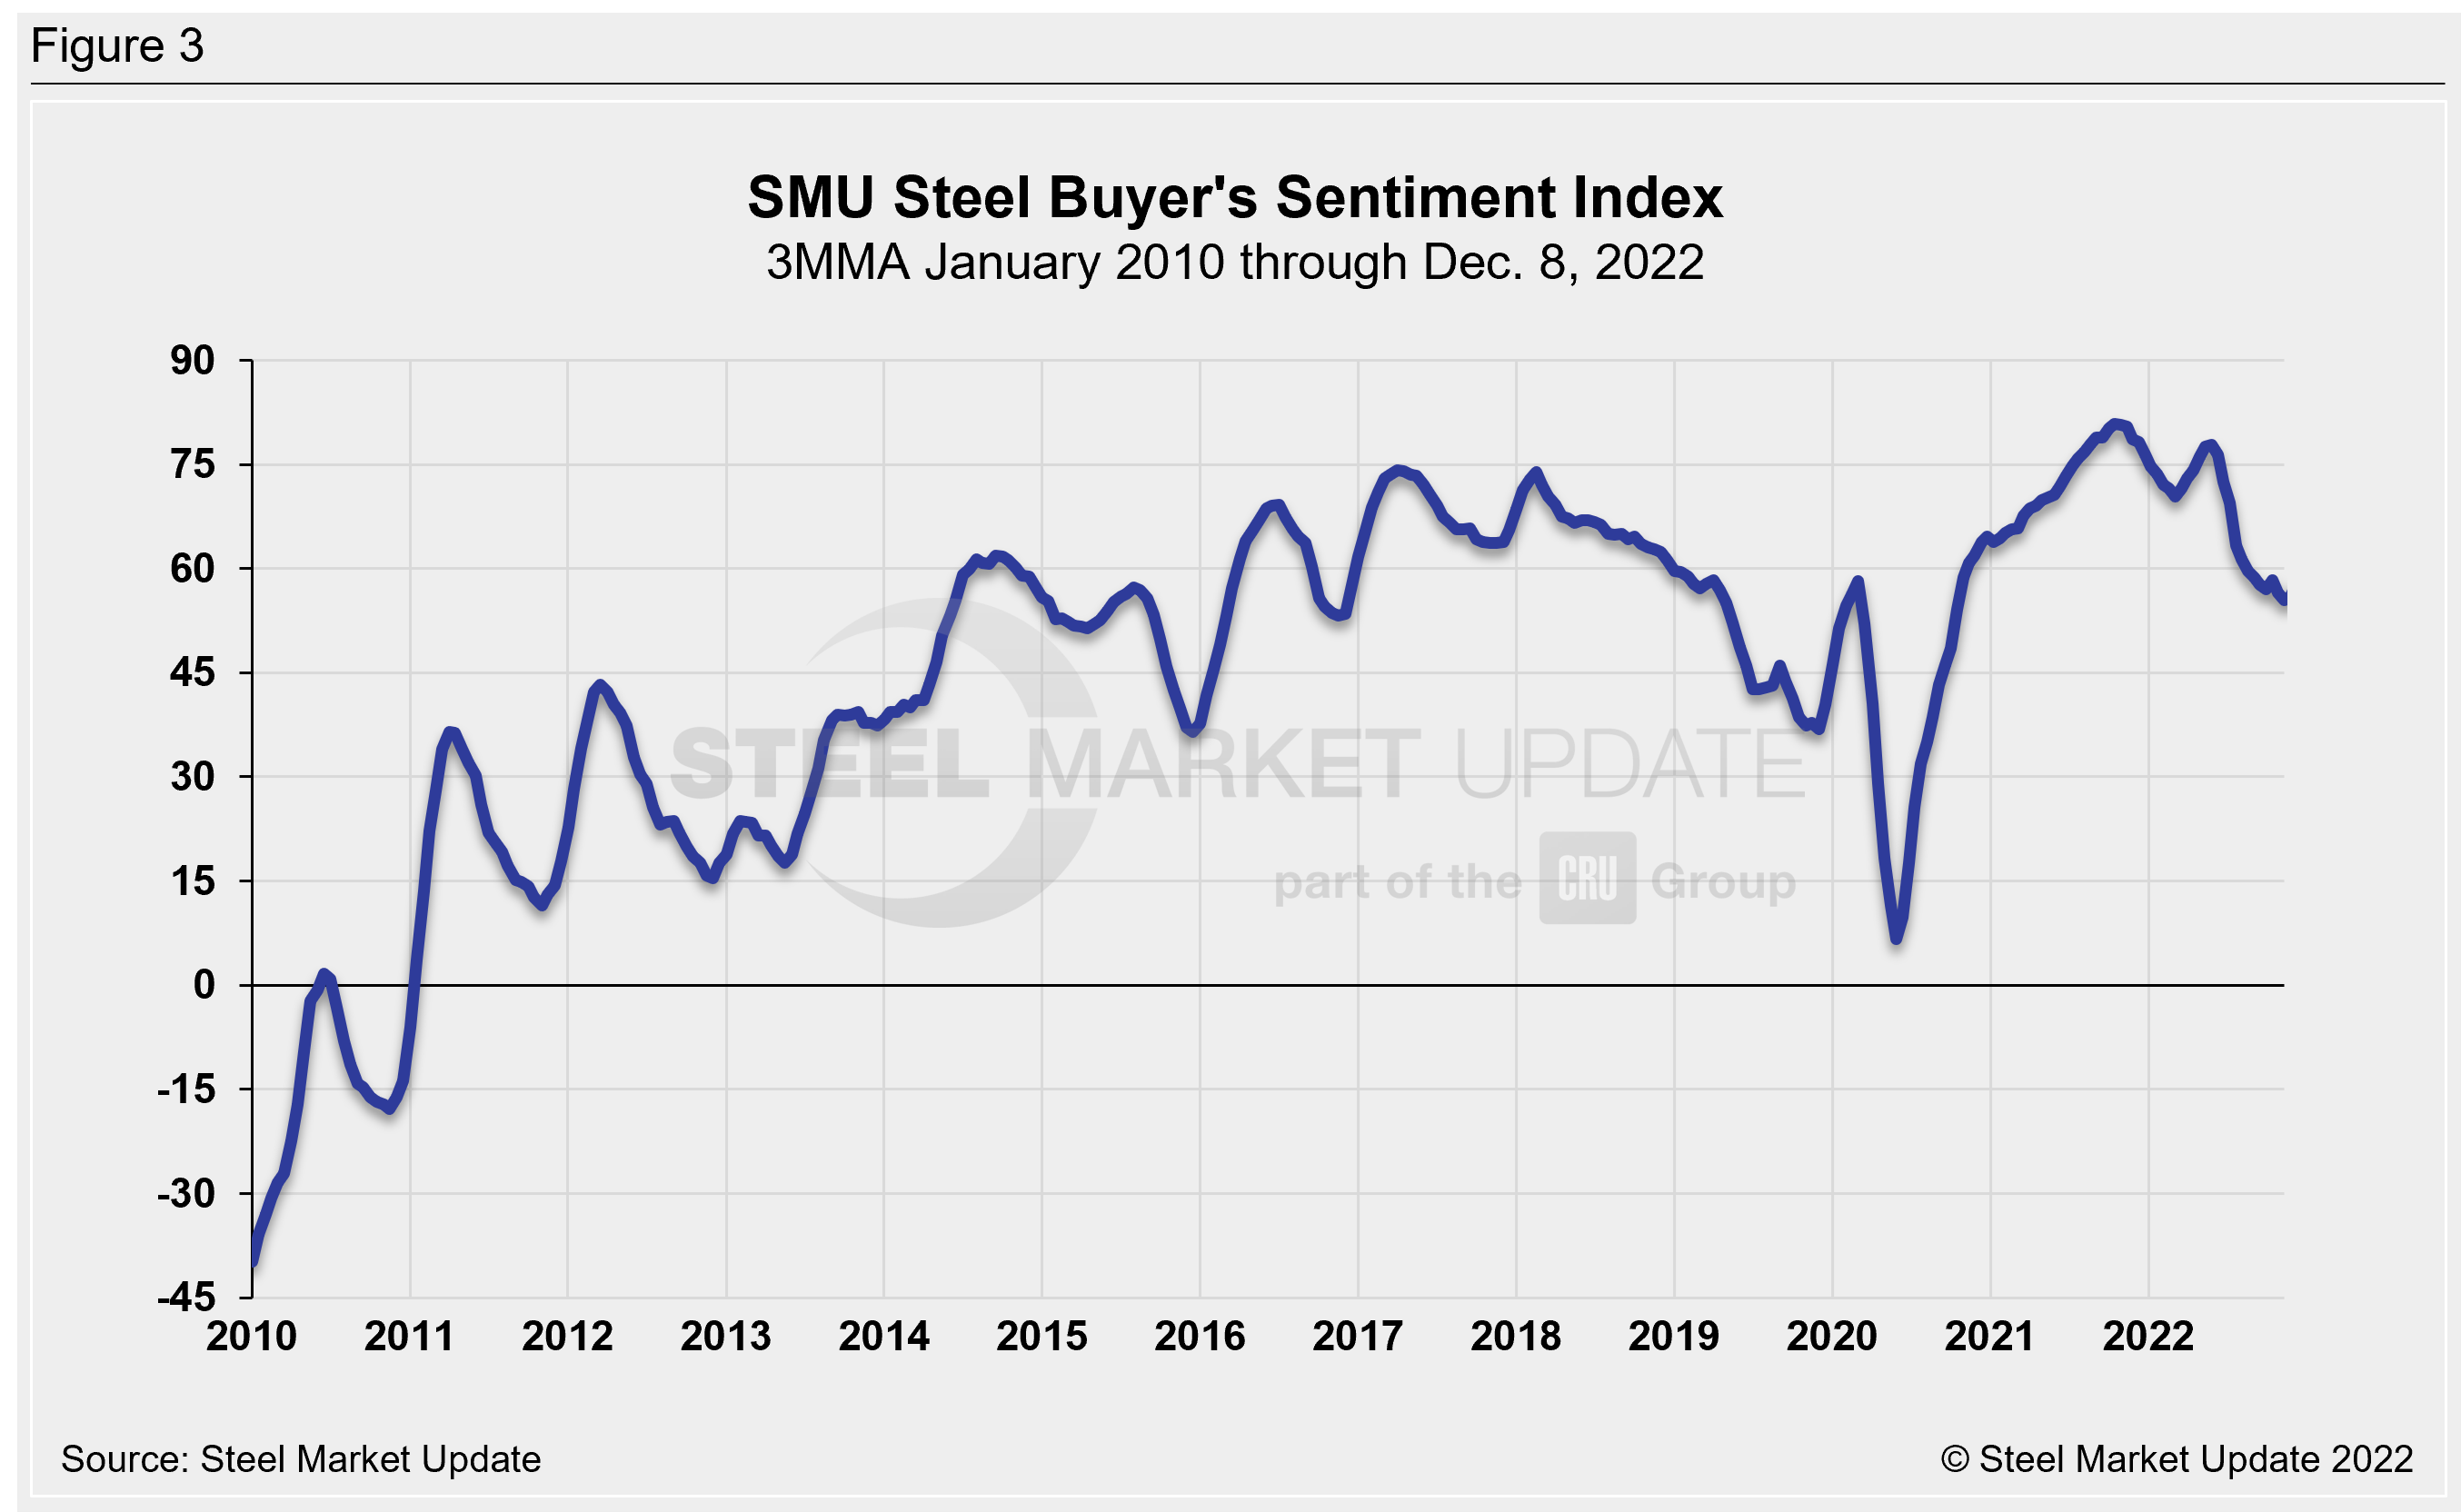
The SMU Steel Buyers Sentiment Index is a measure of the current attitude of North American steel buyers regarding their company’s chances for success in today’s market. The single value of the current sentiment index fell to -8 in early March 2020, a 66-point drop in just a month as the pandemic devastated the economy. It rebounded to a healthy +82 by late March but had been largely trending down through November. Since July’s two-year low of 43, the reading has edged up, though it remains underwhelming at 64 as of Dec. 8.
Figure 3 shows the 3MMA of the index since 2010. A reading above the neutral point of zero indicates that buyers have a positive attitude toward their prospects. Steady-to-declining demand and falling steel prices appear to be pressuring the Steel Buyer’s Sentiment Index to remain low.
By David Schollaert, David@SteelMarketUpdate.com