Market Data
May 30, 2024
Steel imports surge through April and May data
Written by Brett Linton
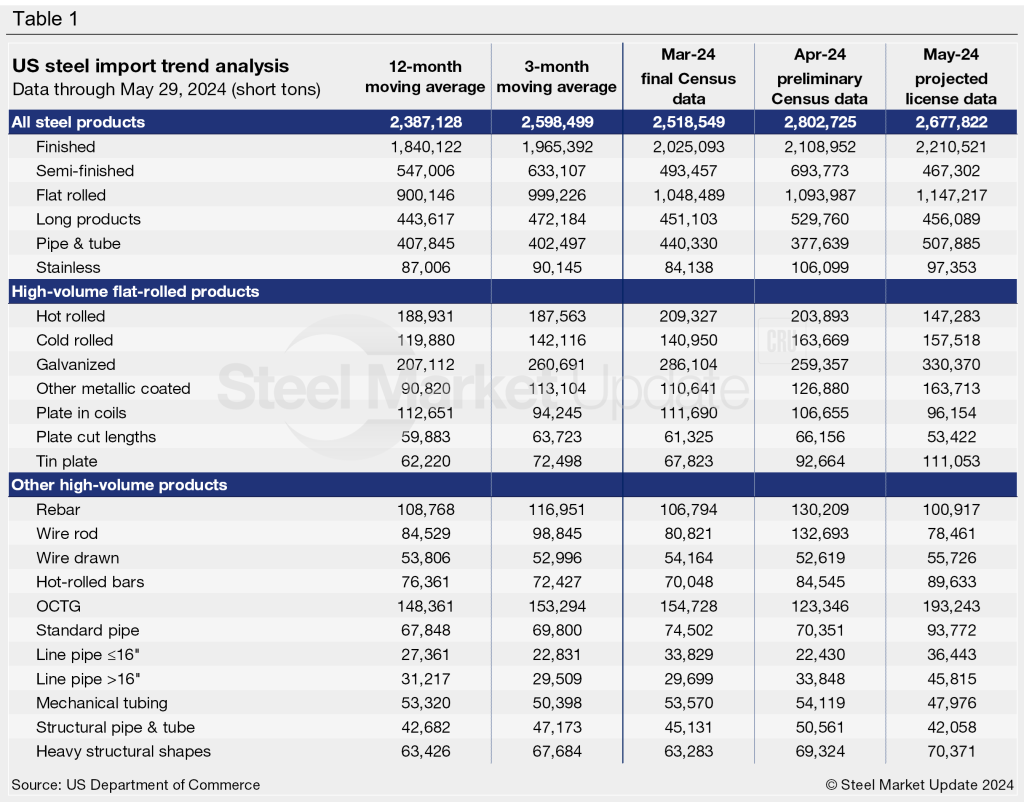
Steel imports jumped from March to April and are looking nearly as strong for May, according to updated US Census data released earlier this week.
Following a relatively stable first quarter, preliminary April imports surged 11% month over month (m/m) and are now nearing a two-year high. Projected May import license data suggests imports could ease slightly from April, though still significantly high in comparison to levels seen over the past year.
The US Commerce Department’s preliminary count shows 2.80 million short tons (st) of steel products entered the country last month. This is up from 2.52 million st in March and likely the highest month for imports since June 2022 (2.84 million st). The latest projections on May import licenses are up to 2.68 million st, potentially down 4% from April (note that license data is still being collected so May figures could fluctuate from here).
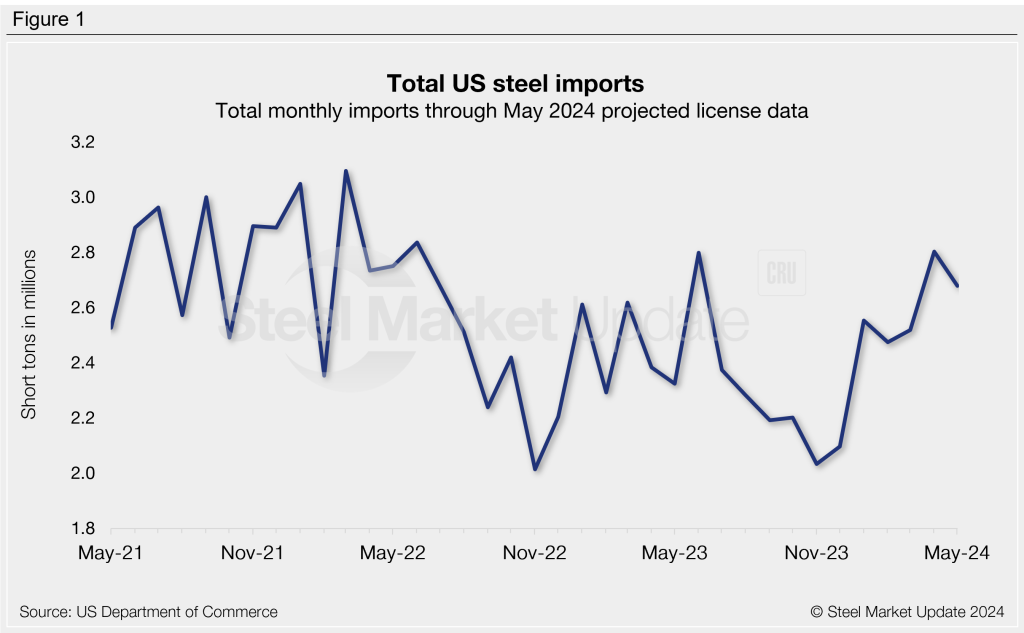
Imports as a 3MMA
Looking at imports on a three-month moving average (3MMA) basis can smooth out the variability seen month to month and better showcase long-term trends. On a 3MMA basis, imports through preliminary April data rose further from March to 2.60 million st. Now at a 20-month high, the April 3MMA is up 3% from the previous month and up 17% from the start of the year. The 3MMA through projected May license data is even higher, currently at 2.66 million st. Figure 2 shows a five-year view of total steel imports on a 3MMA basis.
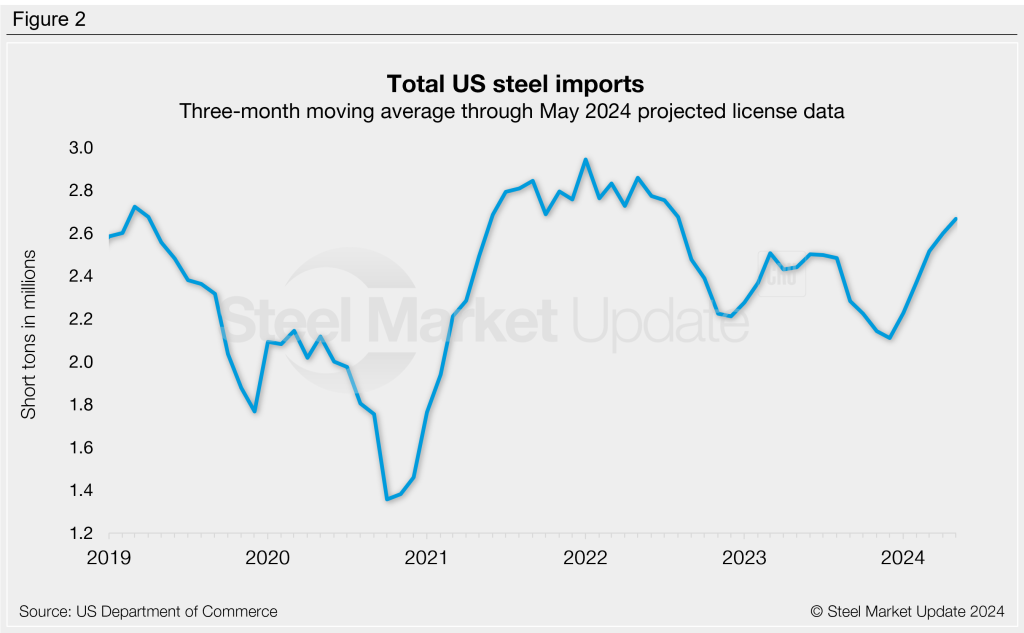
Semi-finished and finished steel
Imports of semi-finished steel recovered in April following the previous month’s dip, rising 41% m/m to 694,000 st. Projected May licenses are currently at 467,000 st, 33% lower than April levels. For reference, semi-finished imports averaged 524,000 st per month last year. This year has seen a monthly average of 597,000 st through May figures.
Meanwhile, finished steel imports increased 4% m/m in April to 2.11 million tons, now at a 21-month high. The latest finished import tally through May is up another 5% to 2.21 million st. Finished imports averaged 1.83 million st per month in 2023, whereas the monthly average for 2024 now stands at 2.01 million st.
Flat-rolled steel
Flat-rolled steel imports continue to recover since reaching a seven-month low last November. Preliminary figures show April up 4% m/m to a 22-month high of 1.09 million st. May license projections are up another 5% from April at 1.15 million st, potentially the highest monthly rate seen since March 2022.
Figure 4 shows monthly imports by product category. Imports of long products rose 17% in April to a 10-month high of 530,000 tons; May projections are down 14% to 456,000 st. Pipe and tube imports slipped 14% in April to 378,000 st, potentially rebounding 34% in May to 508,000 st. Stainless imports surged 26% m/m to 106,000 st in April, now up to 20-month high. May stainless projections are currently 8% lower than April at 97,000 st.
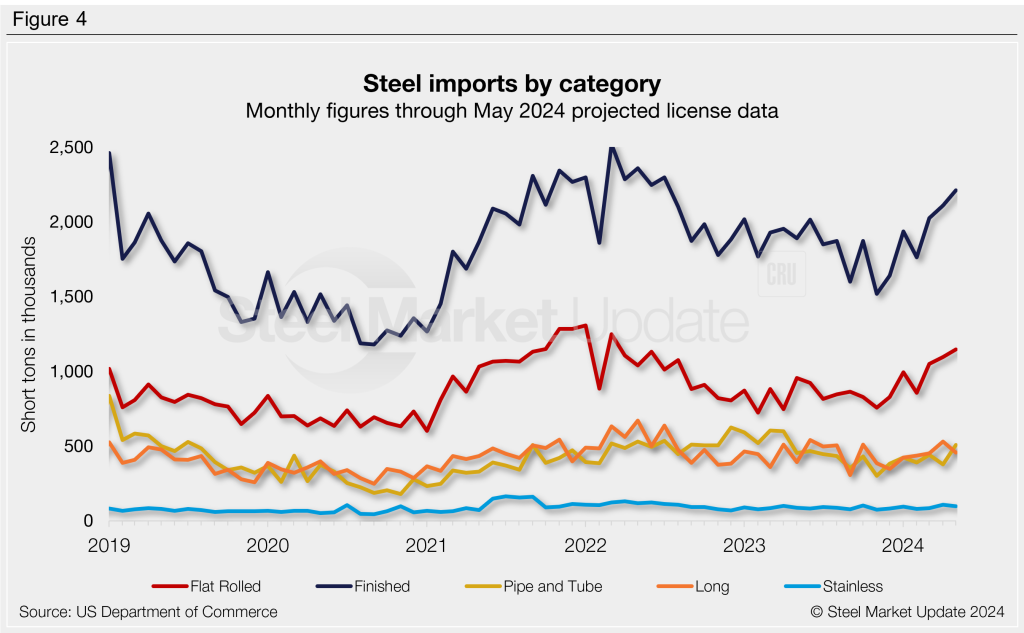
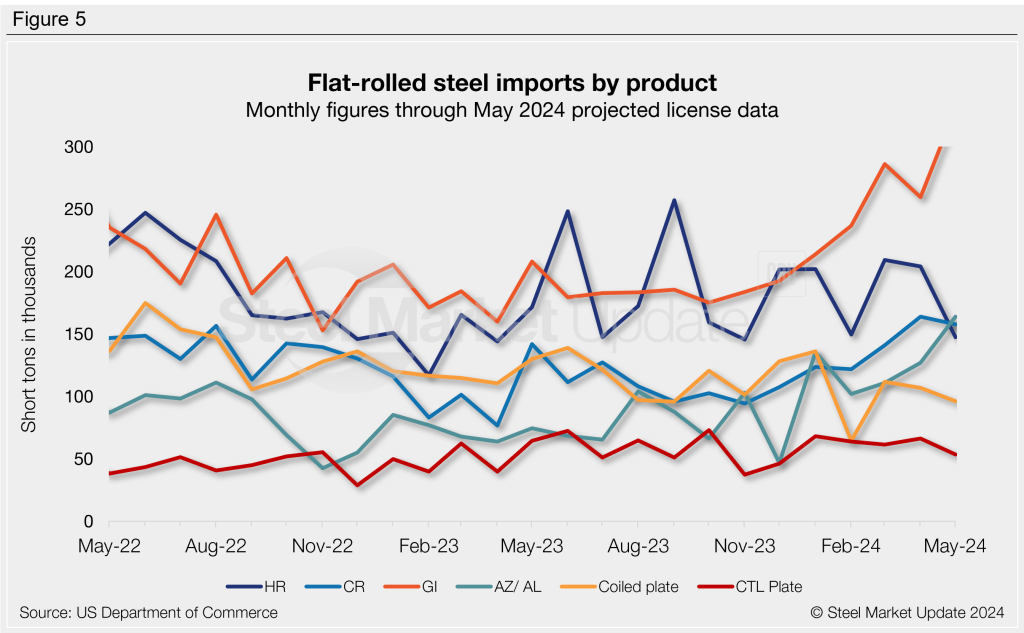
Figure 5 shows flat rolled imports by popular products. After rebounding from February to March, flat rolled products are moving in differing directions in both April and May. Two products increased in both April and May; tin plate (+37% m/m in April and +20% in May) and other metallic coated (+15% m/m in April and +29% in May). Two products showing declines over the last two months were hot rolled (-3% m/m in April and -28% in May) and plate in coils (-5% m/m in April and -10% in May).
Imports by product
The chart below provides further detail into imports by product, highlighting high-volume steel products.