Manufacturers/End Users
August 15, 2024
US light-vehicle sales recover in July after cyberattack fix
Written by David Schollaert
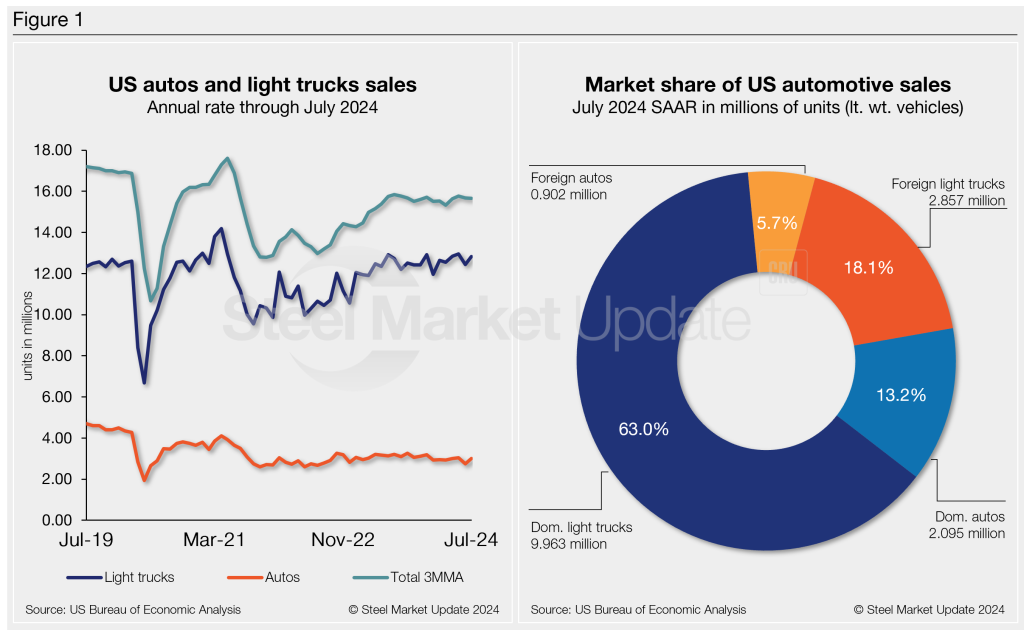
US light-vehicle (LV) sales slipped to an unadjusted 1.273 million units in July, down 2% vs. a year-ago, the US Bureau of Economic Analysis (BEA) reported. The year-on-year (y/y) decline in domestic LV sales came despite a 4.2% month-on-month (m/m) rise.
On an annualized basis, LV sales were 15.8 million units in July, up from 15.3 million units the month prior, and in line with the consensus forecast.
The improvement in monthly results, as expected, reversed last month’s pullback which was weighed down by a cyberattack at CDK Global – a software company that offers dealer management services for over 15,000 dealers in the US and Canada.
Auto sales rose 9.1% y/y, while light trucks increased 3.1% from last year. Light trucks again accounted for 81% of July’s total sales, slightly above its 80% share last year.
July’s average daily selling rate (DSR) was 50,925 – calculated over 25 days – down from July 2023’s 51,917 daily rate.
Year-to-date (YTD), sales have totaled 9.08 million units, 1.4% above 2023’s YTD of 8.95 million.
Below in Figure 1 is the long-term picture of sales of autos and lightweight trucks in the US from 2019 through July 2024. Additionally, it includes the market share sales breakdown of last month’s 15.8 million vehicles at a seasonally adjusted annual rate.
The new-vehicle average transaction price (ATP) continues to be impacted by the lack of base time models. While auto production has largely recovered from the pandemic, inventories have slowly edged higher but remain considerably below 2019 levels.
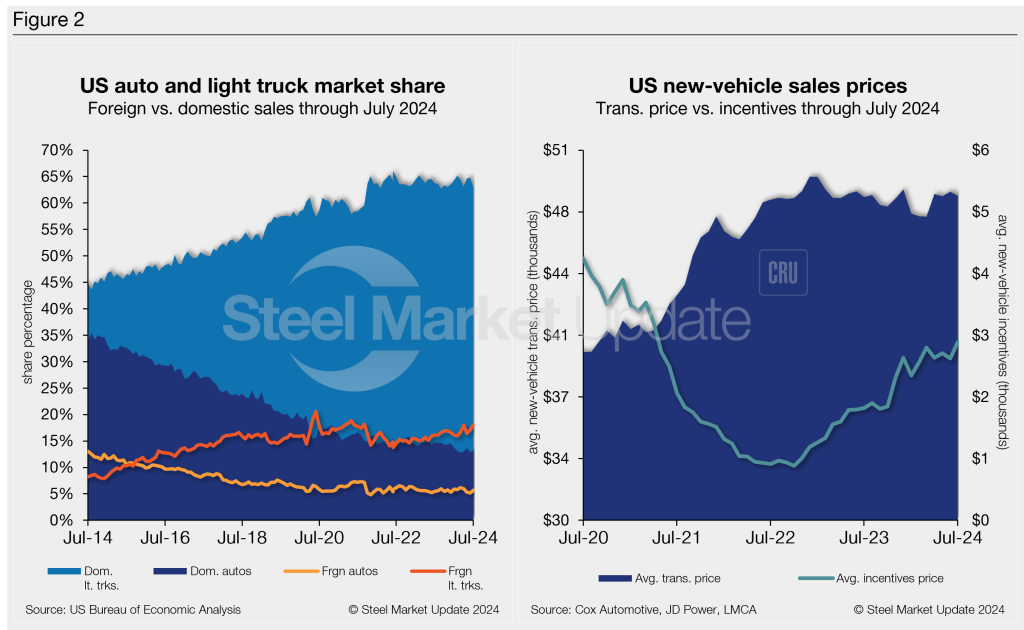
July’s ATP of $48,401 was 0.5% lower m/m and just 0.1% (+$67) higher y/y, according to Cox Automotive data.
Incentives saw a boost of over 10% m/m, hitting a 39-month high of $2,892. With the m/m increase, incentives are roughly 6% of the average transaction price. Incentives are up about 59%, or $1,072, from last year.
The annualized selling rate of light trucks for June was 12.821 million units, up 3.1% vs. the prior month and 0.7% higher y/y. Annualized auto selling rates diverged a bit more over the same period, up 9.1% m/m yet down 6.6% y/y.
Figure 2 details the US auto and light truck market share since 2014 and the divergence between average transaction prices and incentives in the US market since 2020.
Editor’s note: This report is based on data from the US Bureau of Economic Analysis (BEA), LMC Automotive, JD Power, and Cox Automotive for automotive sales in the US, Canada, and Mexico. Specifically, the report describes light-vehicle sales in the US.