Analysis
March 19, 2025
March energy market update
Written by Brett Linton
In this Premium analysis we explore North American oil and natural gas prices, drilling activity, and crude oil stock levels. Trends in energy prices and rig counts serve as leading indicators for oil country tubular goods (OCTG) and line pipe demand.
The Energy Information Administration (EIA) recently released its March Short-Term Energy Outlook (STEO). The latest report projects crude oil prices will rise slightly into the third quarter, then marginally ease in late 2025 through 2026 as increasing production exceeds demand. Natural gas prices are forecast to steadily rise, driven by demand outpacing production growth. Click here to read the full March STEO report covering energy spot prices, production, inventories, and more.
Oil spot prices
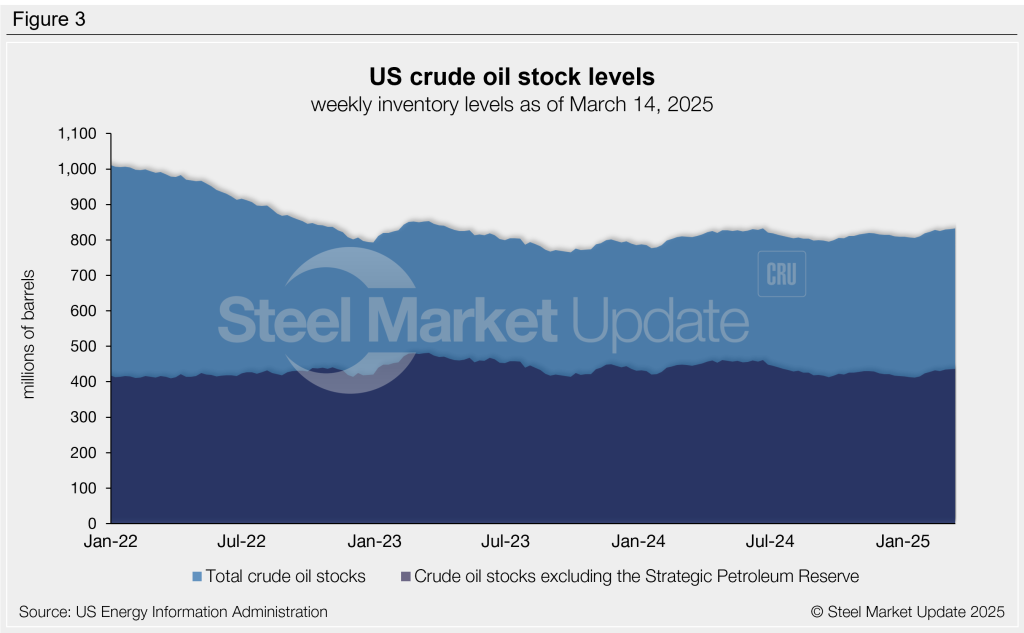
The weekly West Texas Intermediate oil spot market price has tumbled over the past month, now down to a three-year low. In late February, prices slipped below the $70-90 per barrel (b) range generally observed across the previous two years. The latest spot price has eased to $66.95/b as of March 14 (Figure 1).
The March STEO forecasts oil spot prices to recover, averaging $75/b by Q3’25 (up $5/b from the February forecast). Looking further ahead, 2026 prices are now forecast at $66/b, slightly lower than the previous $68/b estimate.
Gas spot prices
Following the multi-decade lows seen in 2024, natural gas spot prices surged from November through February due to increased winter heating demand. In mid-February, prices briefly touched a two-year high of $5.90/mmBtu. The latest natural gas spot price has receded to $4.15/mmBtu as of March 14.
EIA revised its March natural gas forecast upward, citing higher than previously expected consumption. Their 2025 outlook now forecasts prices to average $4.20/mmBtu across the remainder of the year, up 11% from the previous $3.80/mmBtu forecast. Estimates for 2026 have also been raised for the second consecutive month, rising from $4.20/mmBtu in February to $4.50/mmBtu in the latest report.
Rig counts
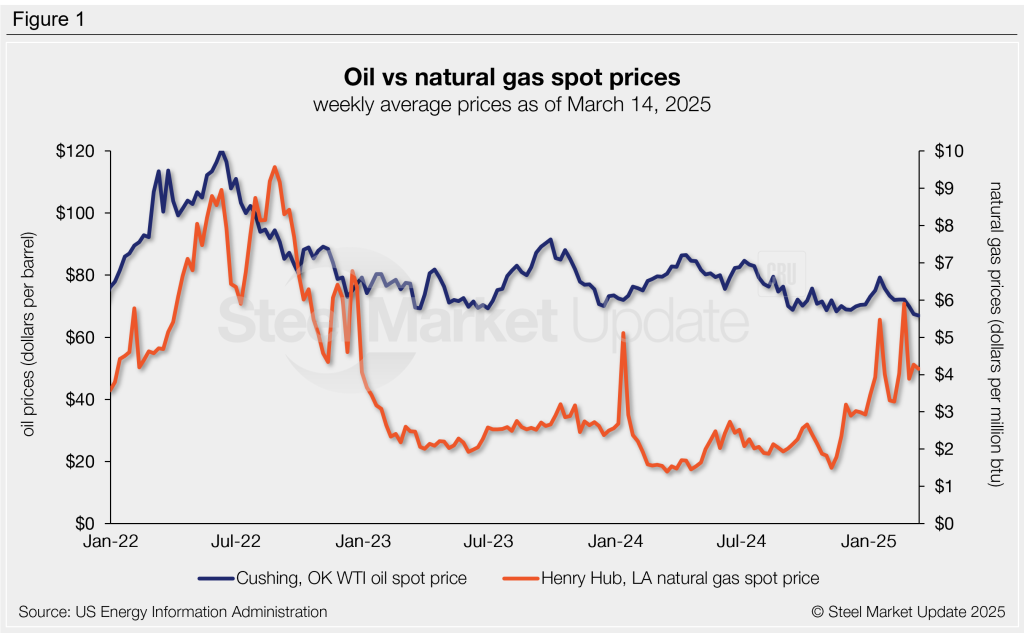
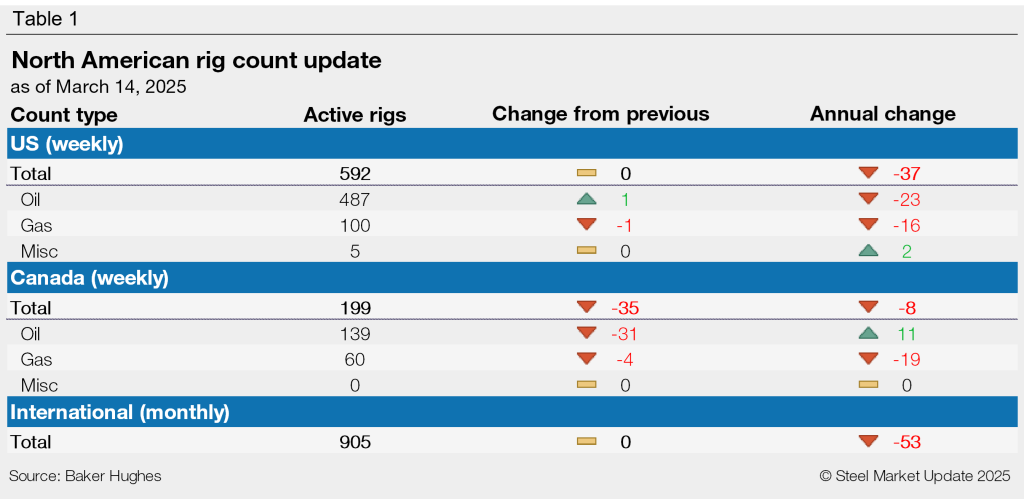
US drilling activity remains at reduced levels, as it has since June 2024 (Figure 2, left). According to Baker Hughes, the latest US rig count stands at 592. That’s marginally higher than the three-year low count of 576 recorded in January.
The latest active Canadian rig count eased to 199 rigs as of March 14, having recently peaked at a near-seven-year high just over a month ago (Figure 2, right). Canadian counts typically soar in January through March, then decline into May as warmer weather and thawing ground conditions limit access to drilling sites.
Crude stock levels
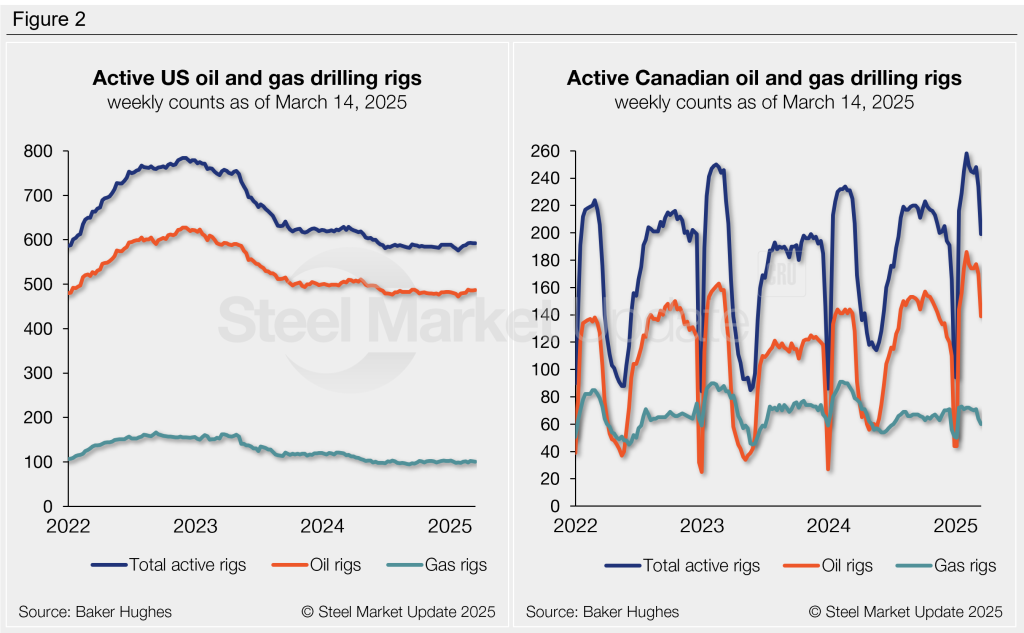
US crude oil stock levels have gradually increased since the start of 2025, rising to an eight-month high 833 million barrels as of March 14. Stock levels are now 3% higher than the beginning of the year and also 3% higher than levels one year ago (Figure 3).