Mexico
March 19, 2025
US light-vehicle sales improve in February
Written by David Schollaert
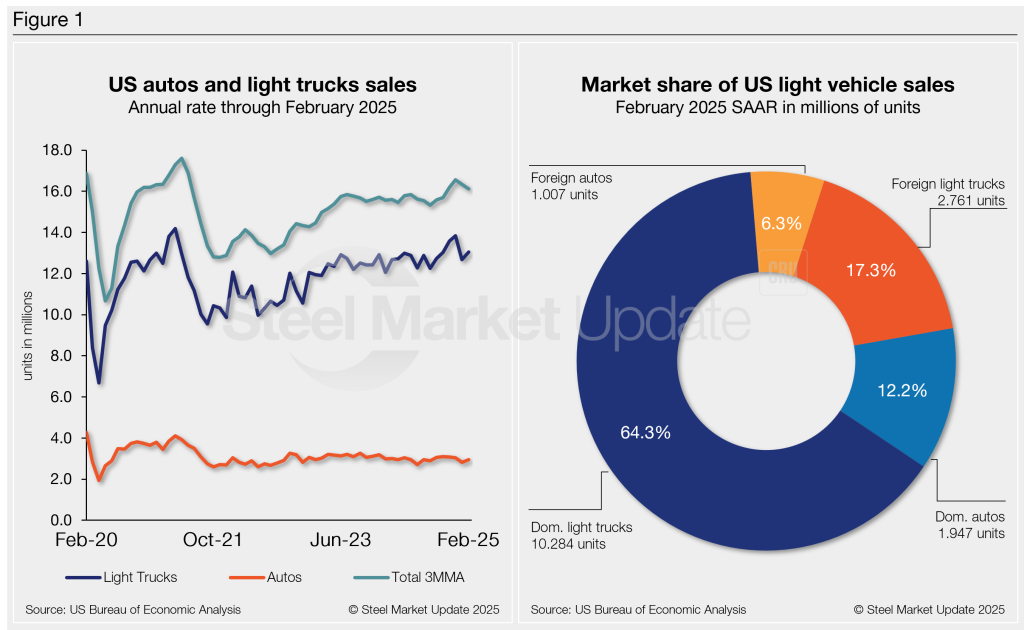
US light-vehicle (LV) sales increased to an unadjusted 1.22 million units in February, a 9.9% gain over January but 0.7% behind year-ago totals, according to US Bureau of Economic Analysis data.
On an annualized basis, LV sales were 16.0 million units in February, up from 15.5 million units the month prior and slightly behind the consensus forecast of 16.1 million.
Market conditions improved last month, reflecting a relatively healthy picture even as costs remain challenging. This is particularly true of higher auto financing rates in the new year.
While rates are expected to ease, potential 25% tariffs on Canada and Mexico will likely bring their share of headwinds. The impact could be extensive, given roughly 80% of US vehicle sales are sourced in North America.
Auto sales fell 4.4% year over year (y/y), while light-truck sales rose just 0.1%. Light trucks accounted for 82% of February’s total sales, above the 81% share a year earlier.
February’s average daily selling rate (DSR) was 50,827 vehicles – calculated over 24 days – up 3.4% from the 49,160-unit daily rate a year earlier.
Figure 1 below shows the long-term picture of US sales of autos and lightweight trucks from 2020 through February 2025. Additionally, it includes the market share sales breakdown of last month’s 16.0 million vehicles at a seasonally adjusted annual rate.
Auto production has fluctuated recently but has recovered from pandemic-driven disruptions. Assemblies are now largely above 2019 levels. Despite improving, higher average transaction prices (ATP) and interest rates continue to weigh on new vehicle sales.
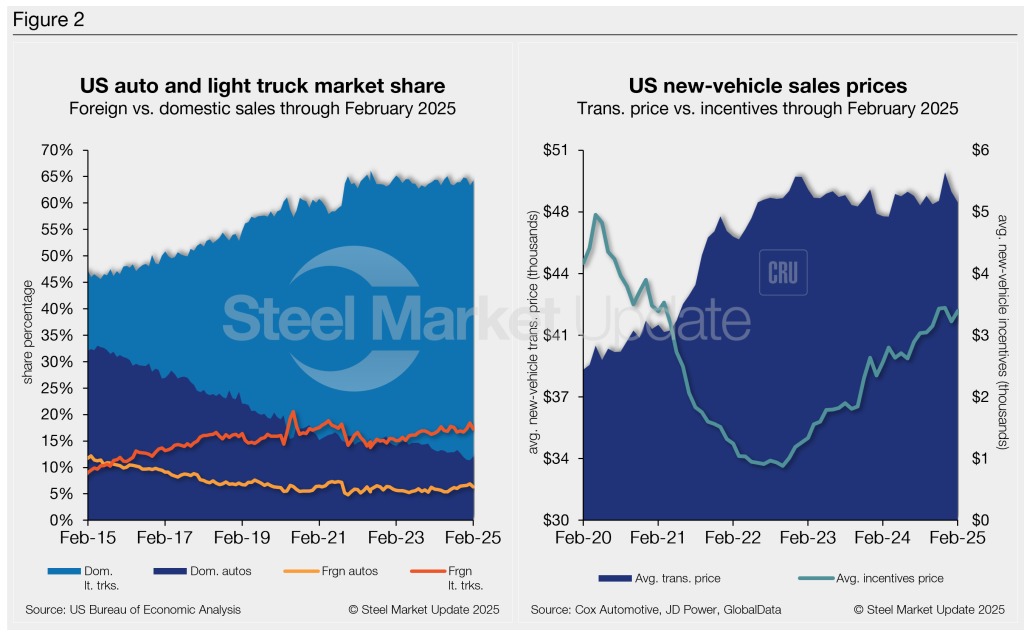
February’s ATP was $48,039, 1.2% (-$602) lower month over month (m/m) but 1.7% (+$795) higher y/y.
Incentives increased 5.1% m/m to $3,392, just below a recent high of $3,442 in December. Incentives now represent roughly 7.1% of the ATP. Compared to last year, incentives are up 32.2%, or $827.
The annualized selling rate of light trucks for January was 13.05 million units, up 3% m/m and up 2.9% y/y. Annualized auto selling rates also ticked up 4.4% m/m but were down 1.5% from last year.
Figure 2 details the US auto and light truck market share since 2015 and the divergence between average transaction prices and incentives in the US market since 2020.
Editor’s note: This report is based on data from the US Bureau of Economic Analysis (BEA), GlobalData, JD Power, and Cox Automotive for automotive sales in the US, Canada, and Mexico. Specifically, the report describes light-vehicle sales in the US.