Mexico
April 7, 2025
US light-vehicle sales accelerate in March
Written by David Schollaert
US light-vehicle (LV) sales increased to an unadjusted 1.59 million units in March, more than a 30% surge over February and 10.7% above year-ago totals, according to US Bureau of Economic Analysis data.
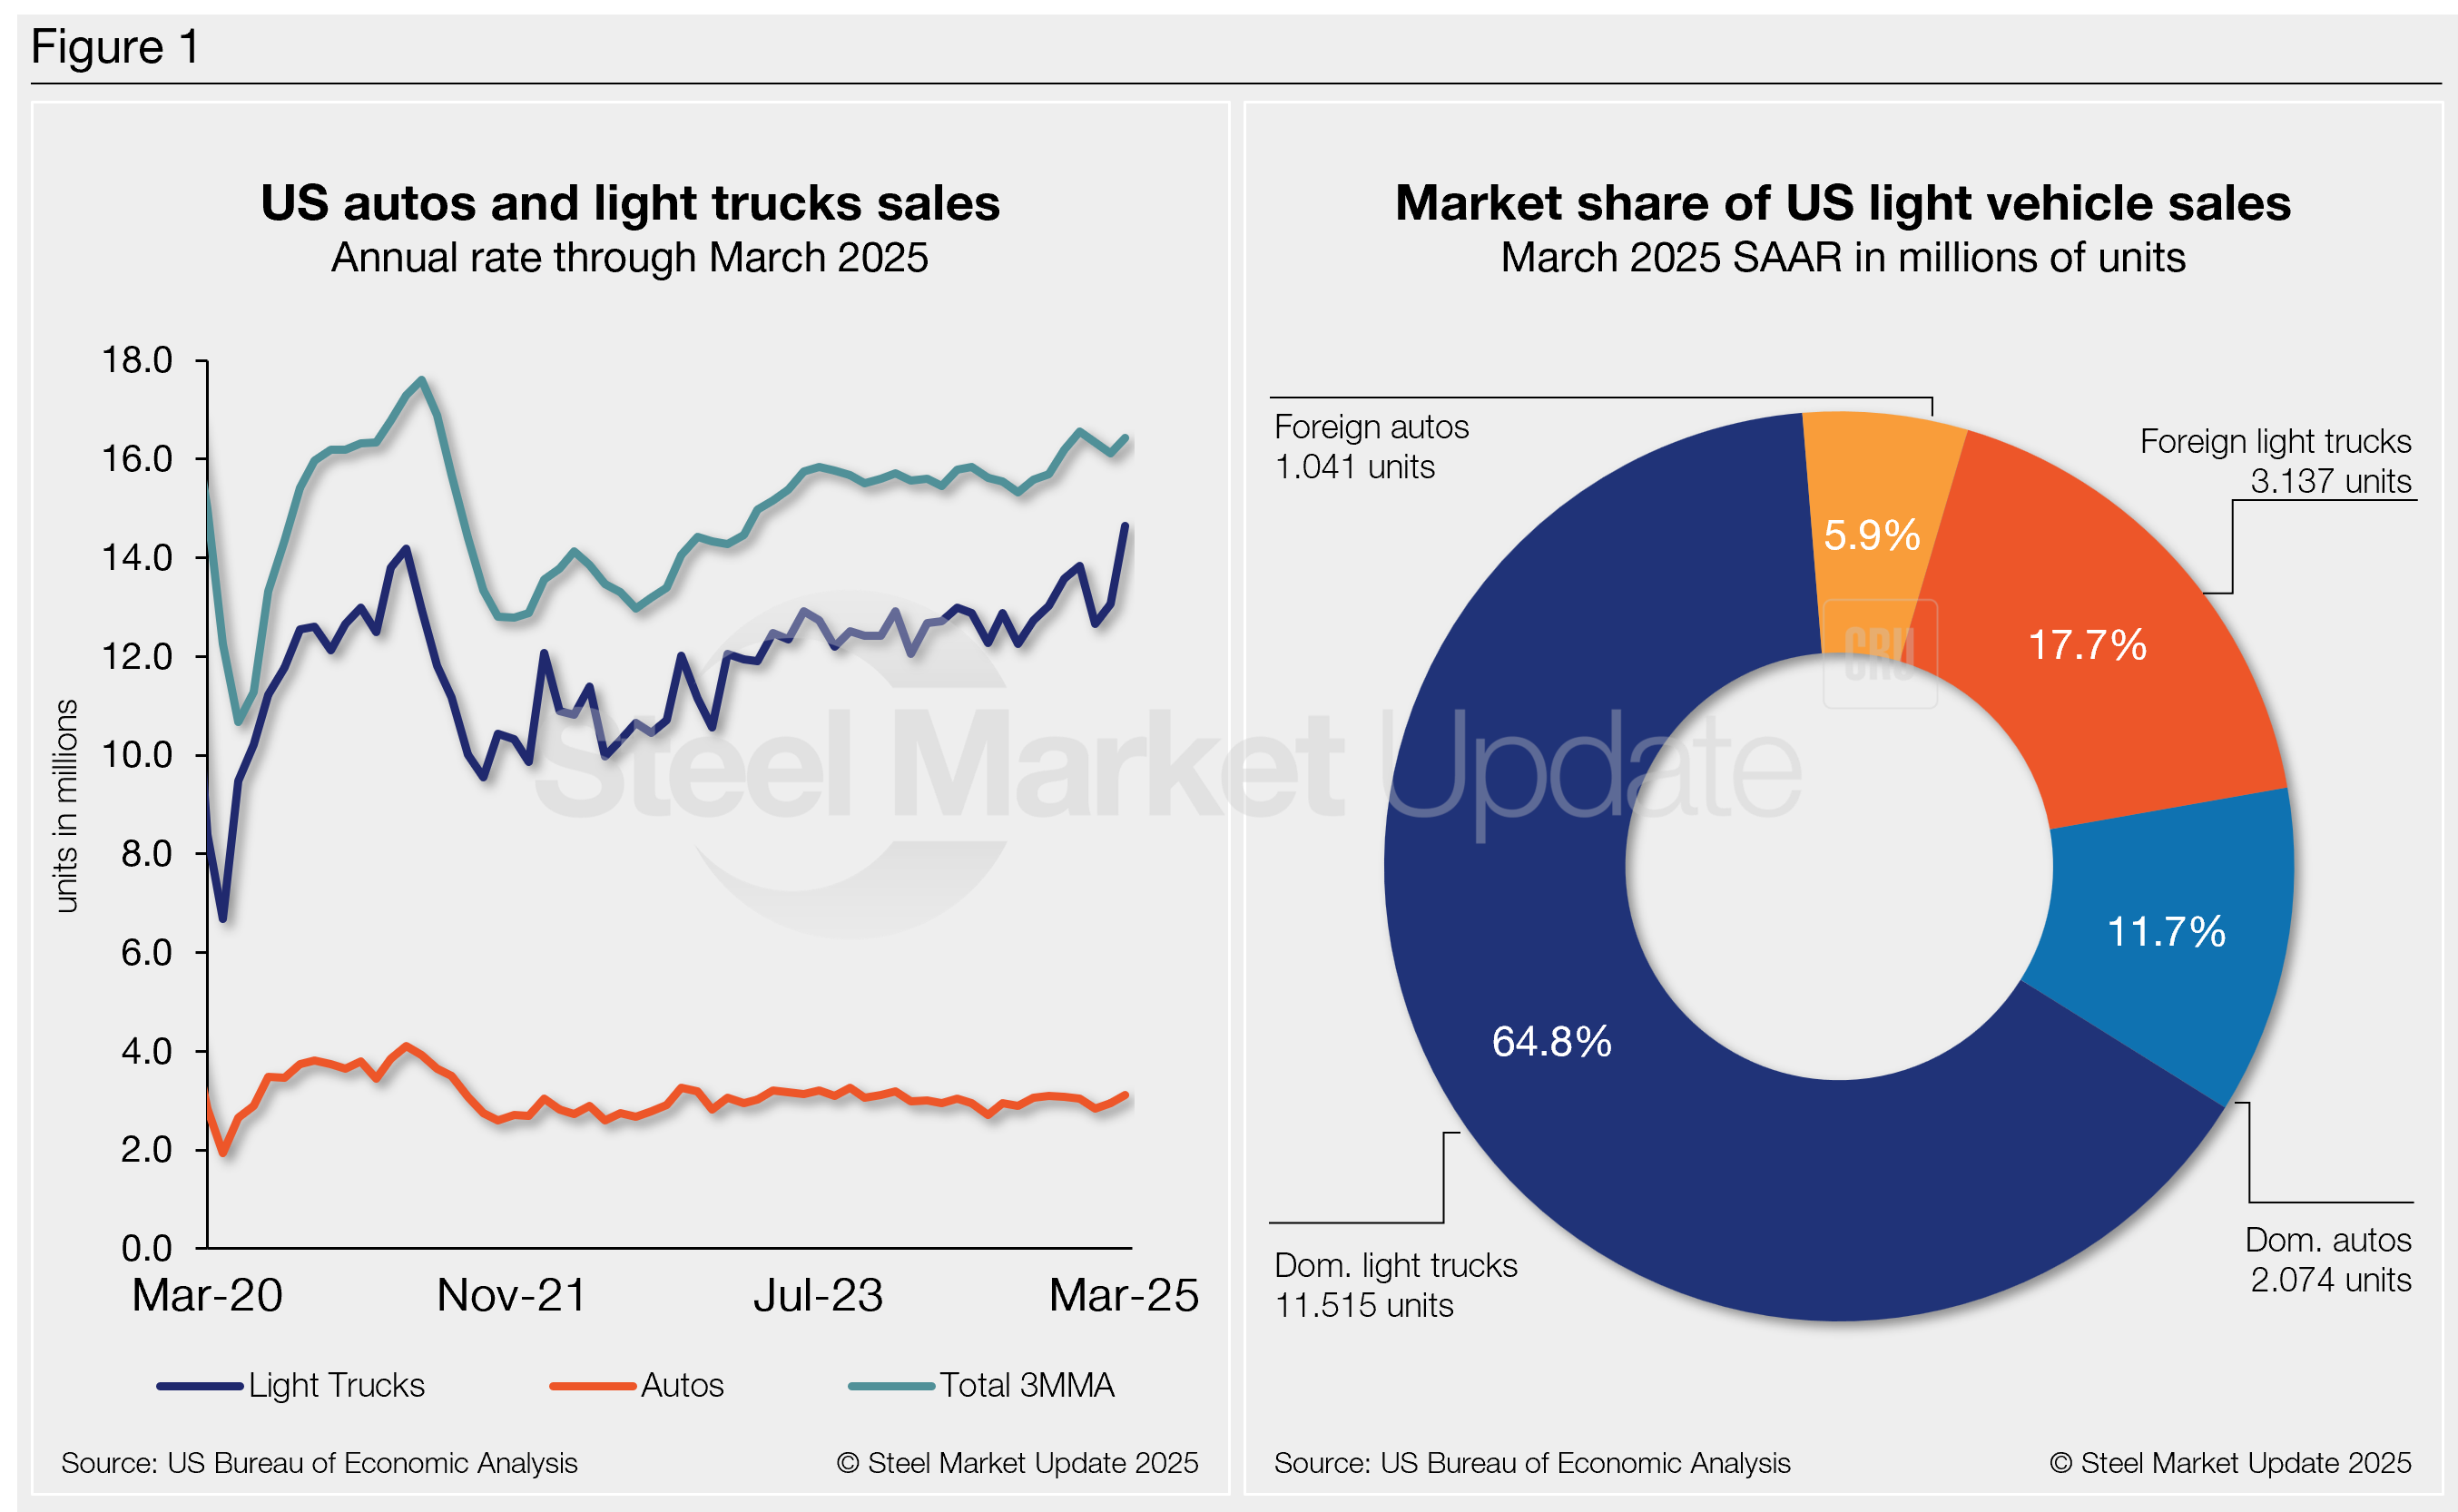
On an annualized basis, LV sales were 17.8 million units in March, up from 16 million units the month prior and notably outpacing the consensus forecast of 16.2 million.
Market conditions improved last month, largely connected to the potential impact of tariffs on vehicle prices. The boost in sales came even as interest rates have not relented. Sales haven’t been this high since early 2021 when interest rates were roughly three points lower.
Auto sales rose 2.9% year over year (y/y), while light-truck sales surged by nearly 12.6%. Light trucks accounted for 82% of March’s total sales, above the 80% share a year earlier.
March’s average daily selling rate (DSR) was 60,977 vehicles – calculated over 26 days – up 15% from the 53,042-unit daily rate a year earlier.
Figure 1 below shows the long-term picture of US sales of autos and lightweight trucks from 2020 through March 2025. Additionally, it includes the market share sales breakdown of last month’s 17.8 million vehicles at a seasonally adjusted annual rate.
Auto production has fluctuated recently but has recovered from pandemic-driven disruptions. Assemblies are now largely above 2019 levels. Despite improving, higher average transaction prices (ATP) and interest rates continue to weigh on new vehicle sales.
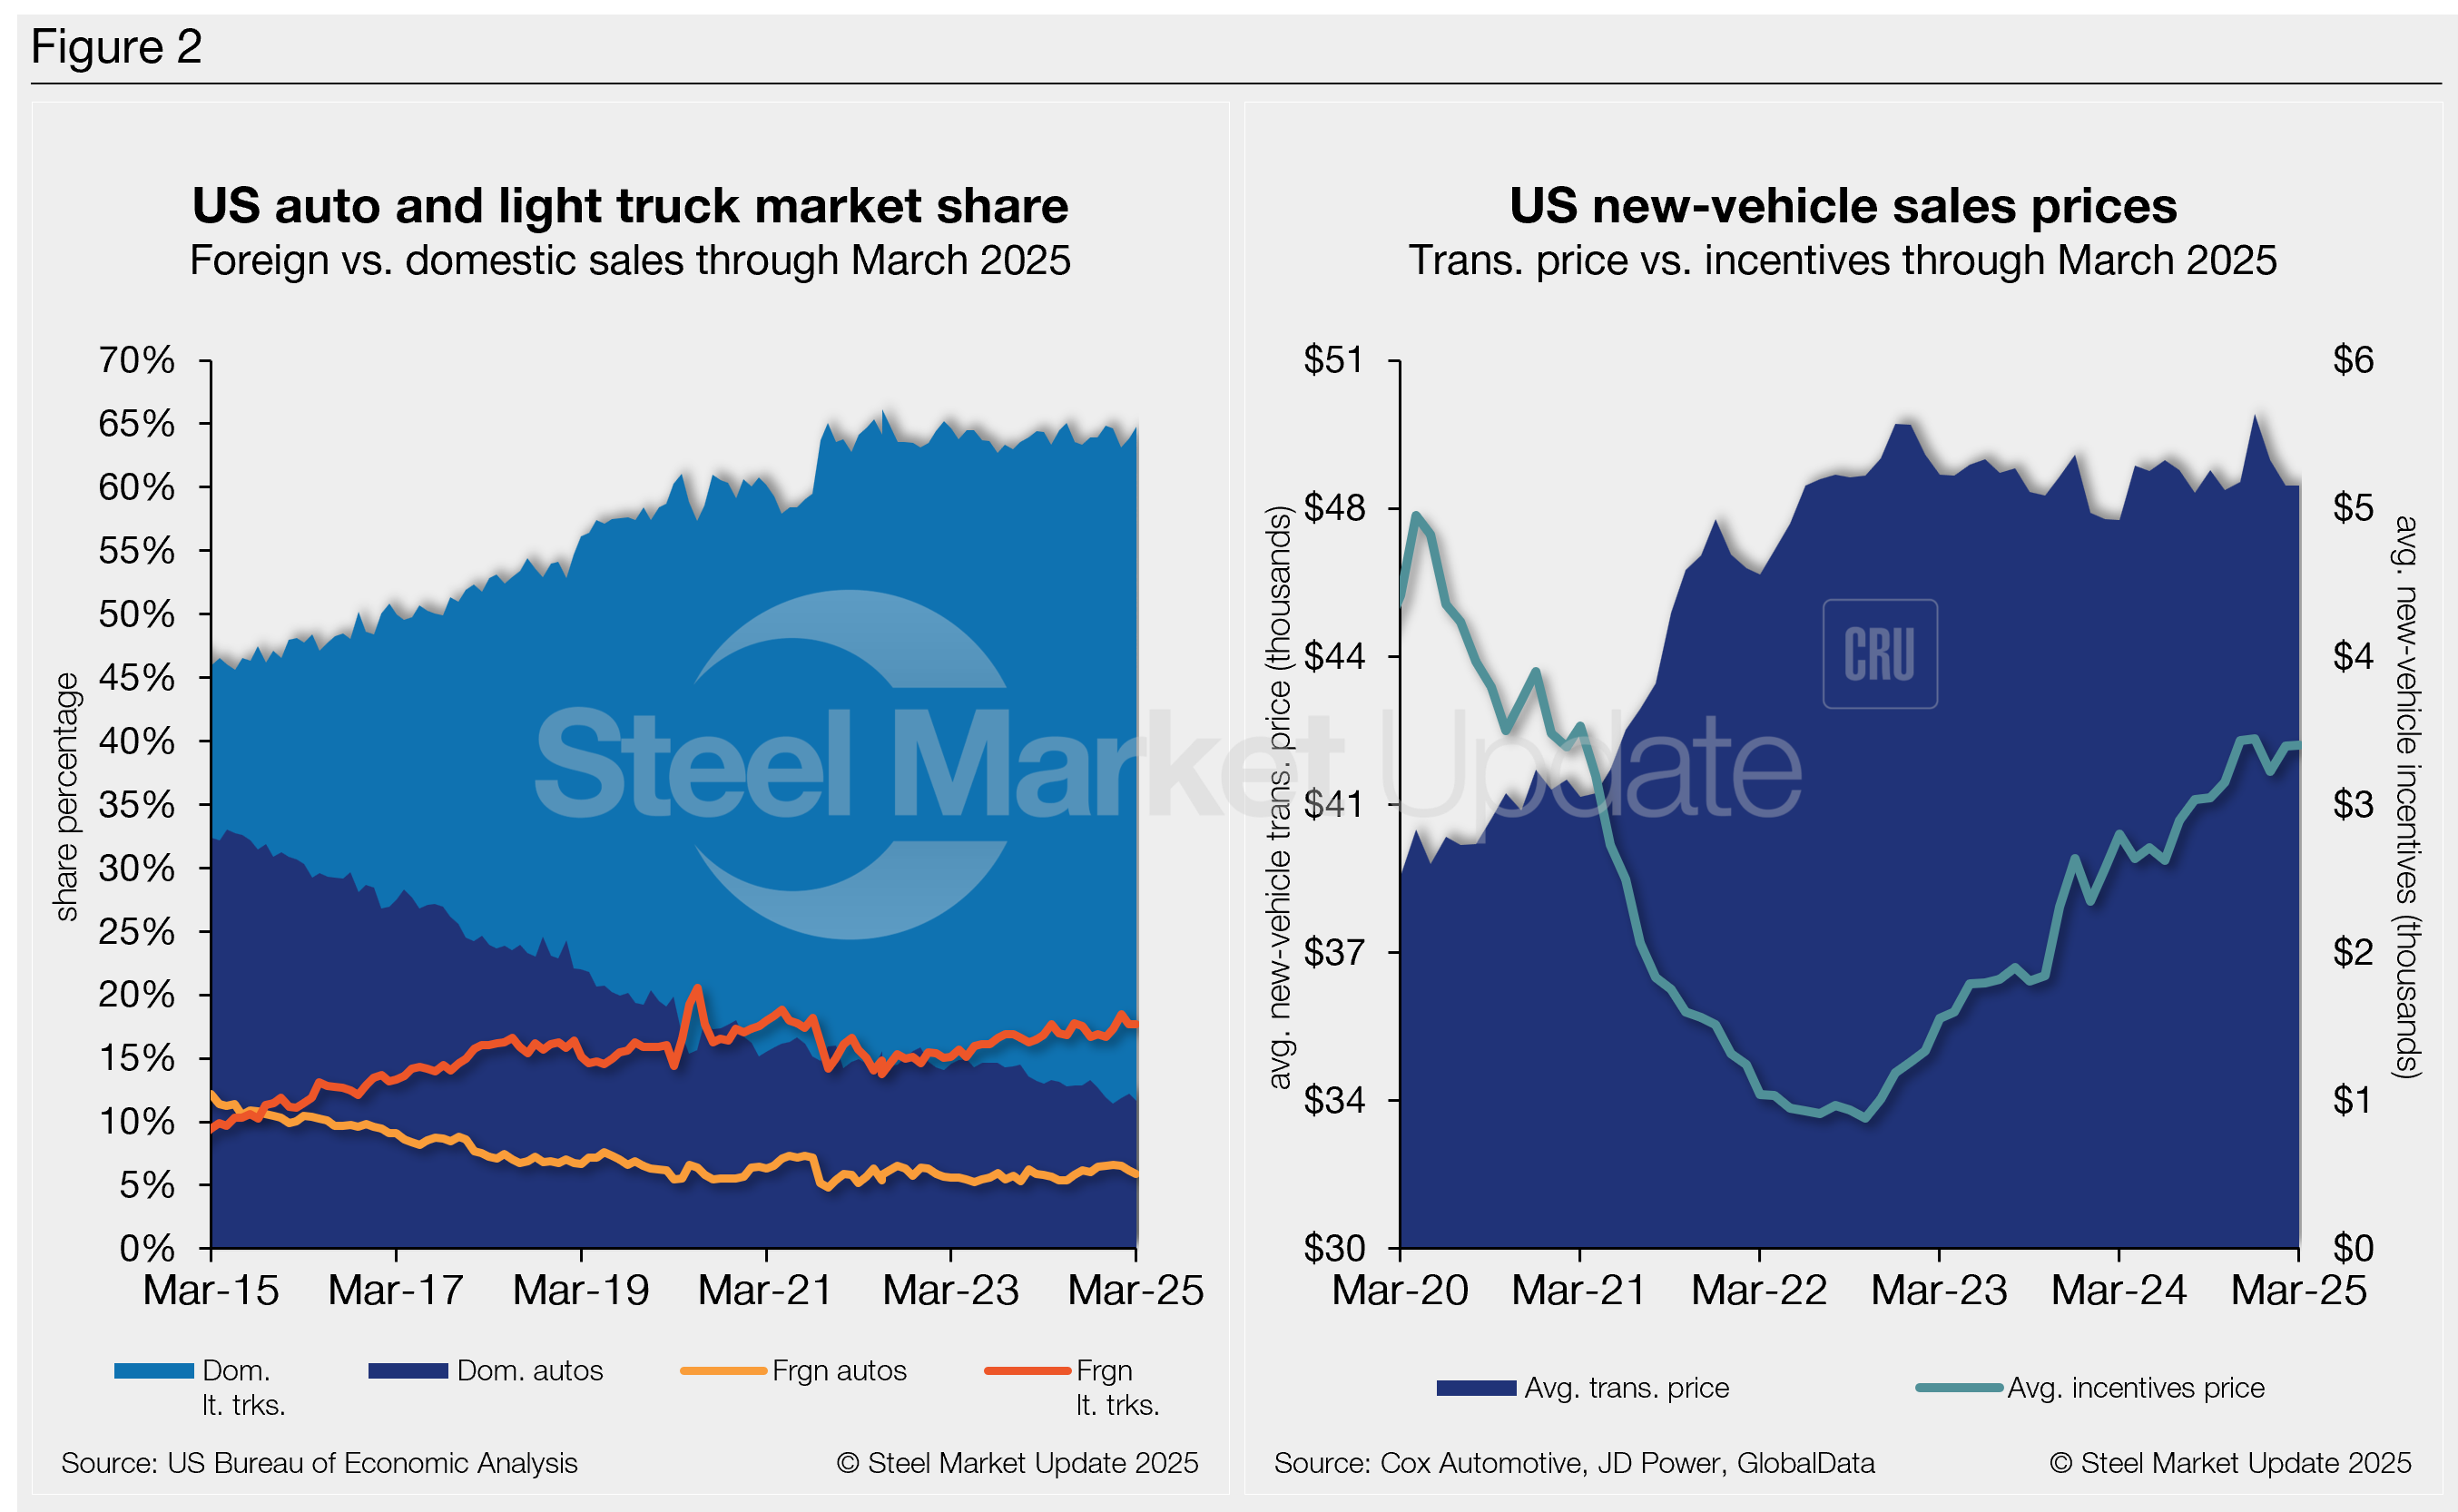
March’s ATP was $48,039, largely flat month over month (m/m) but 1.7% (+$821) higher y/y.
Incentives increased just 0.2% m/m to $3,400, just below a recent high of $3,442 in December. Incentives now represent roughly 7.1% of the ATP. Compared to last year, incentives are up 21.4%, or $600.
The annualized selling rate of light trucks for March was 14.7 million units, up 12.2% m/m and up 15.2% y/y. Annualized auto selling rates also ticked up 5.5% m/m and 5.3% from last year.
Figure 2 details the US auto and light truck market share since 2015 and the divergence between average transaction prices and incentives in the US market since 2020.
Editor’s note
This report is based on data from the US Bureau of Economic Analysis (BEA), GlobalData, JD Power, and Cox Automotive for automotive sales in the US, Canada, and Mexico. Specifically, the report describes light-vehicle sales in the US.