Analysis
May 22, 2025
Global steel production retreats from March peak
Written by Brett Linton
Global raw steel production dipped from March to April, according to the latest release from the World Steel Association.
Around the globe, steel mills produced an estimated 155.7 million metric tons (mt) of raw steel last month. Production is 6% less than March’s two-year high of 166.2 million mt, but in line with year-ago levels.
On a 12-month moving average (12MMA) basis, global production has averaged 152.8 million mt per month over the past year (Figure 1). April output was 2% above this rate. Annual mill output has generally remained in the 152-154 million mt range for the past two and a half years, similar to pre-pandemic levels.
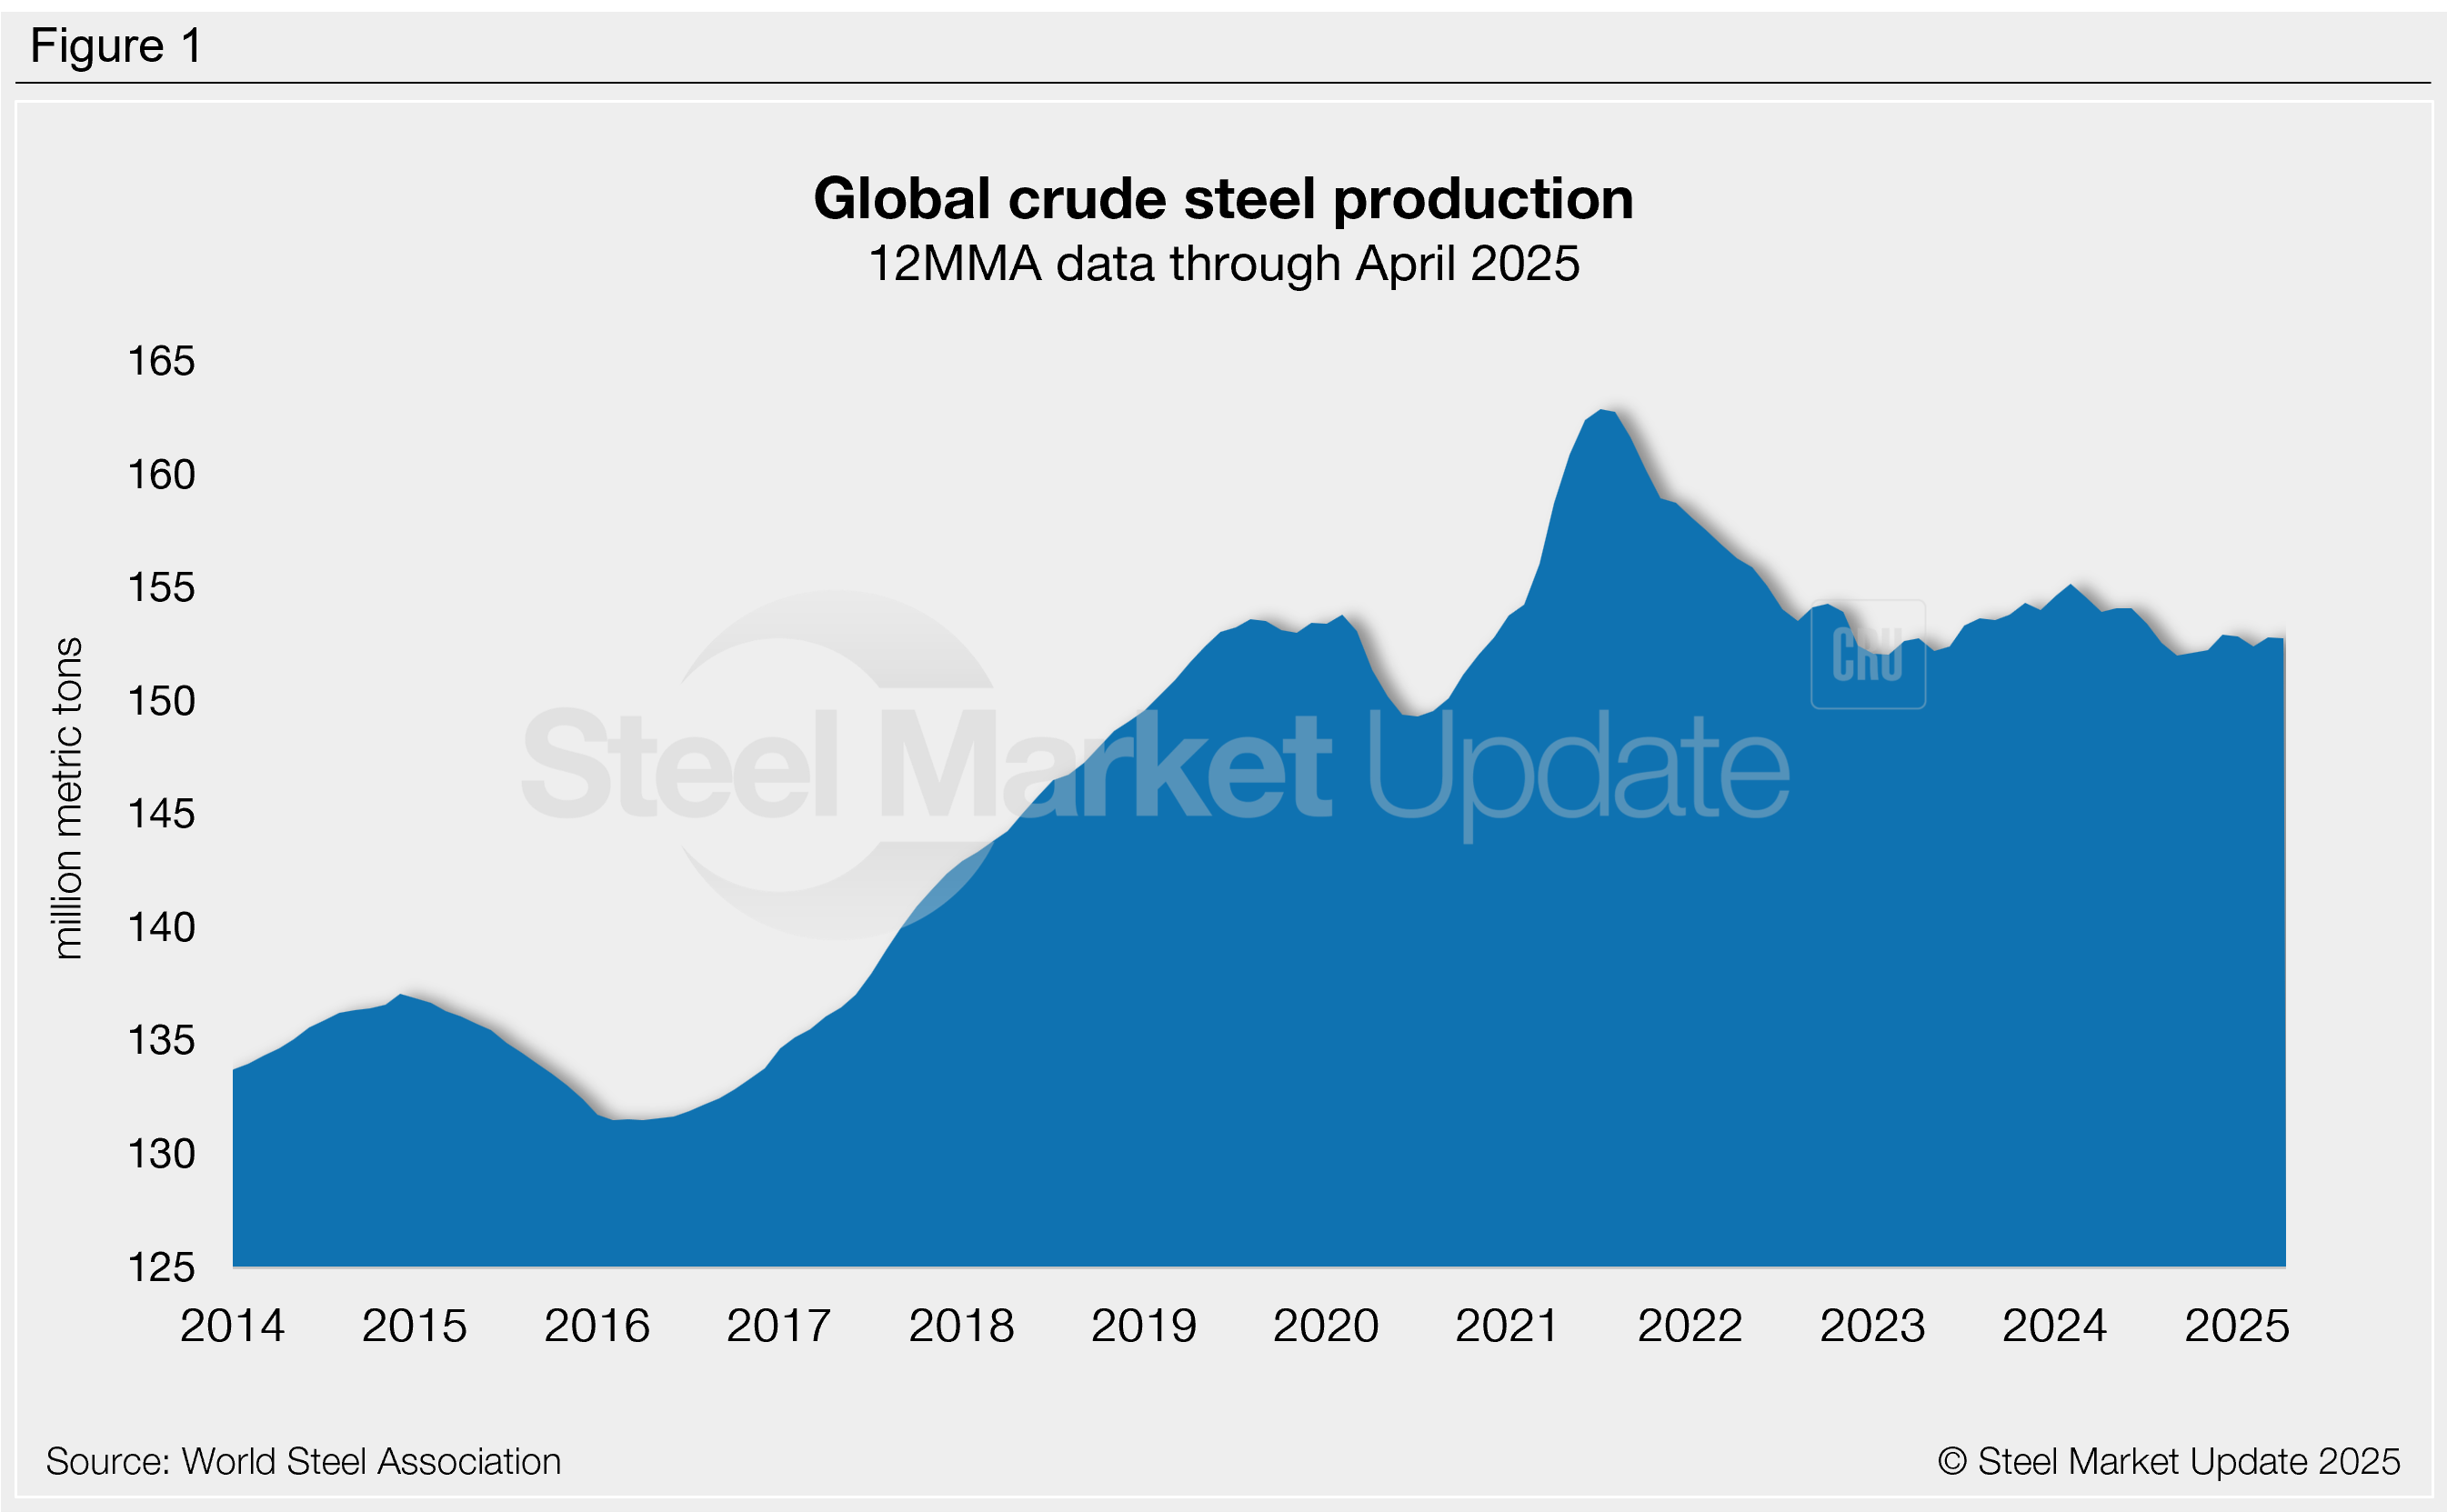
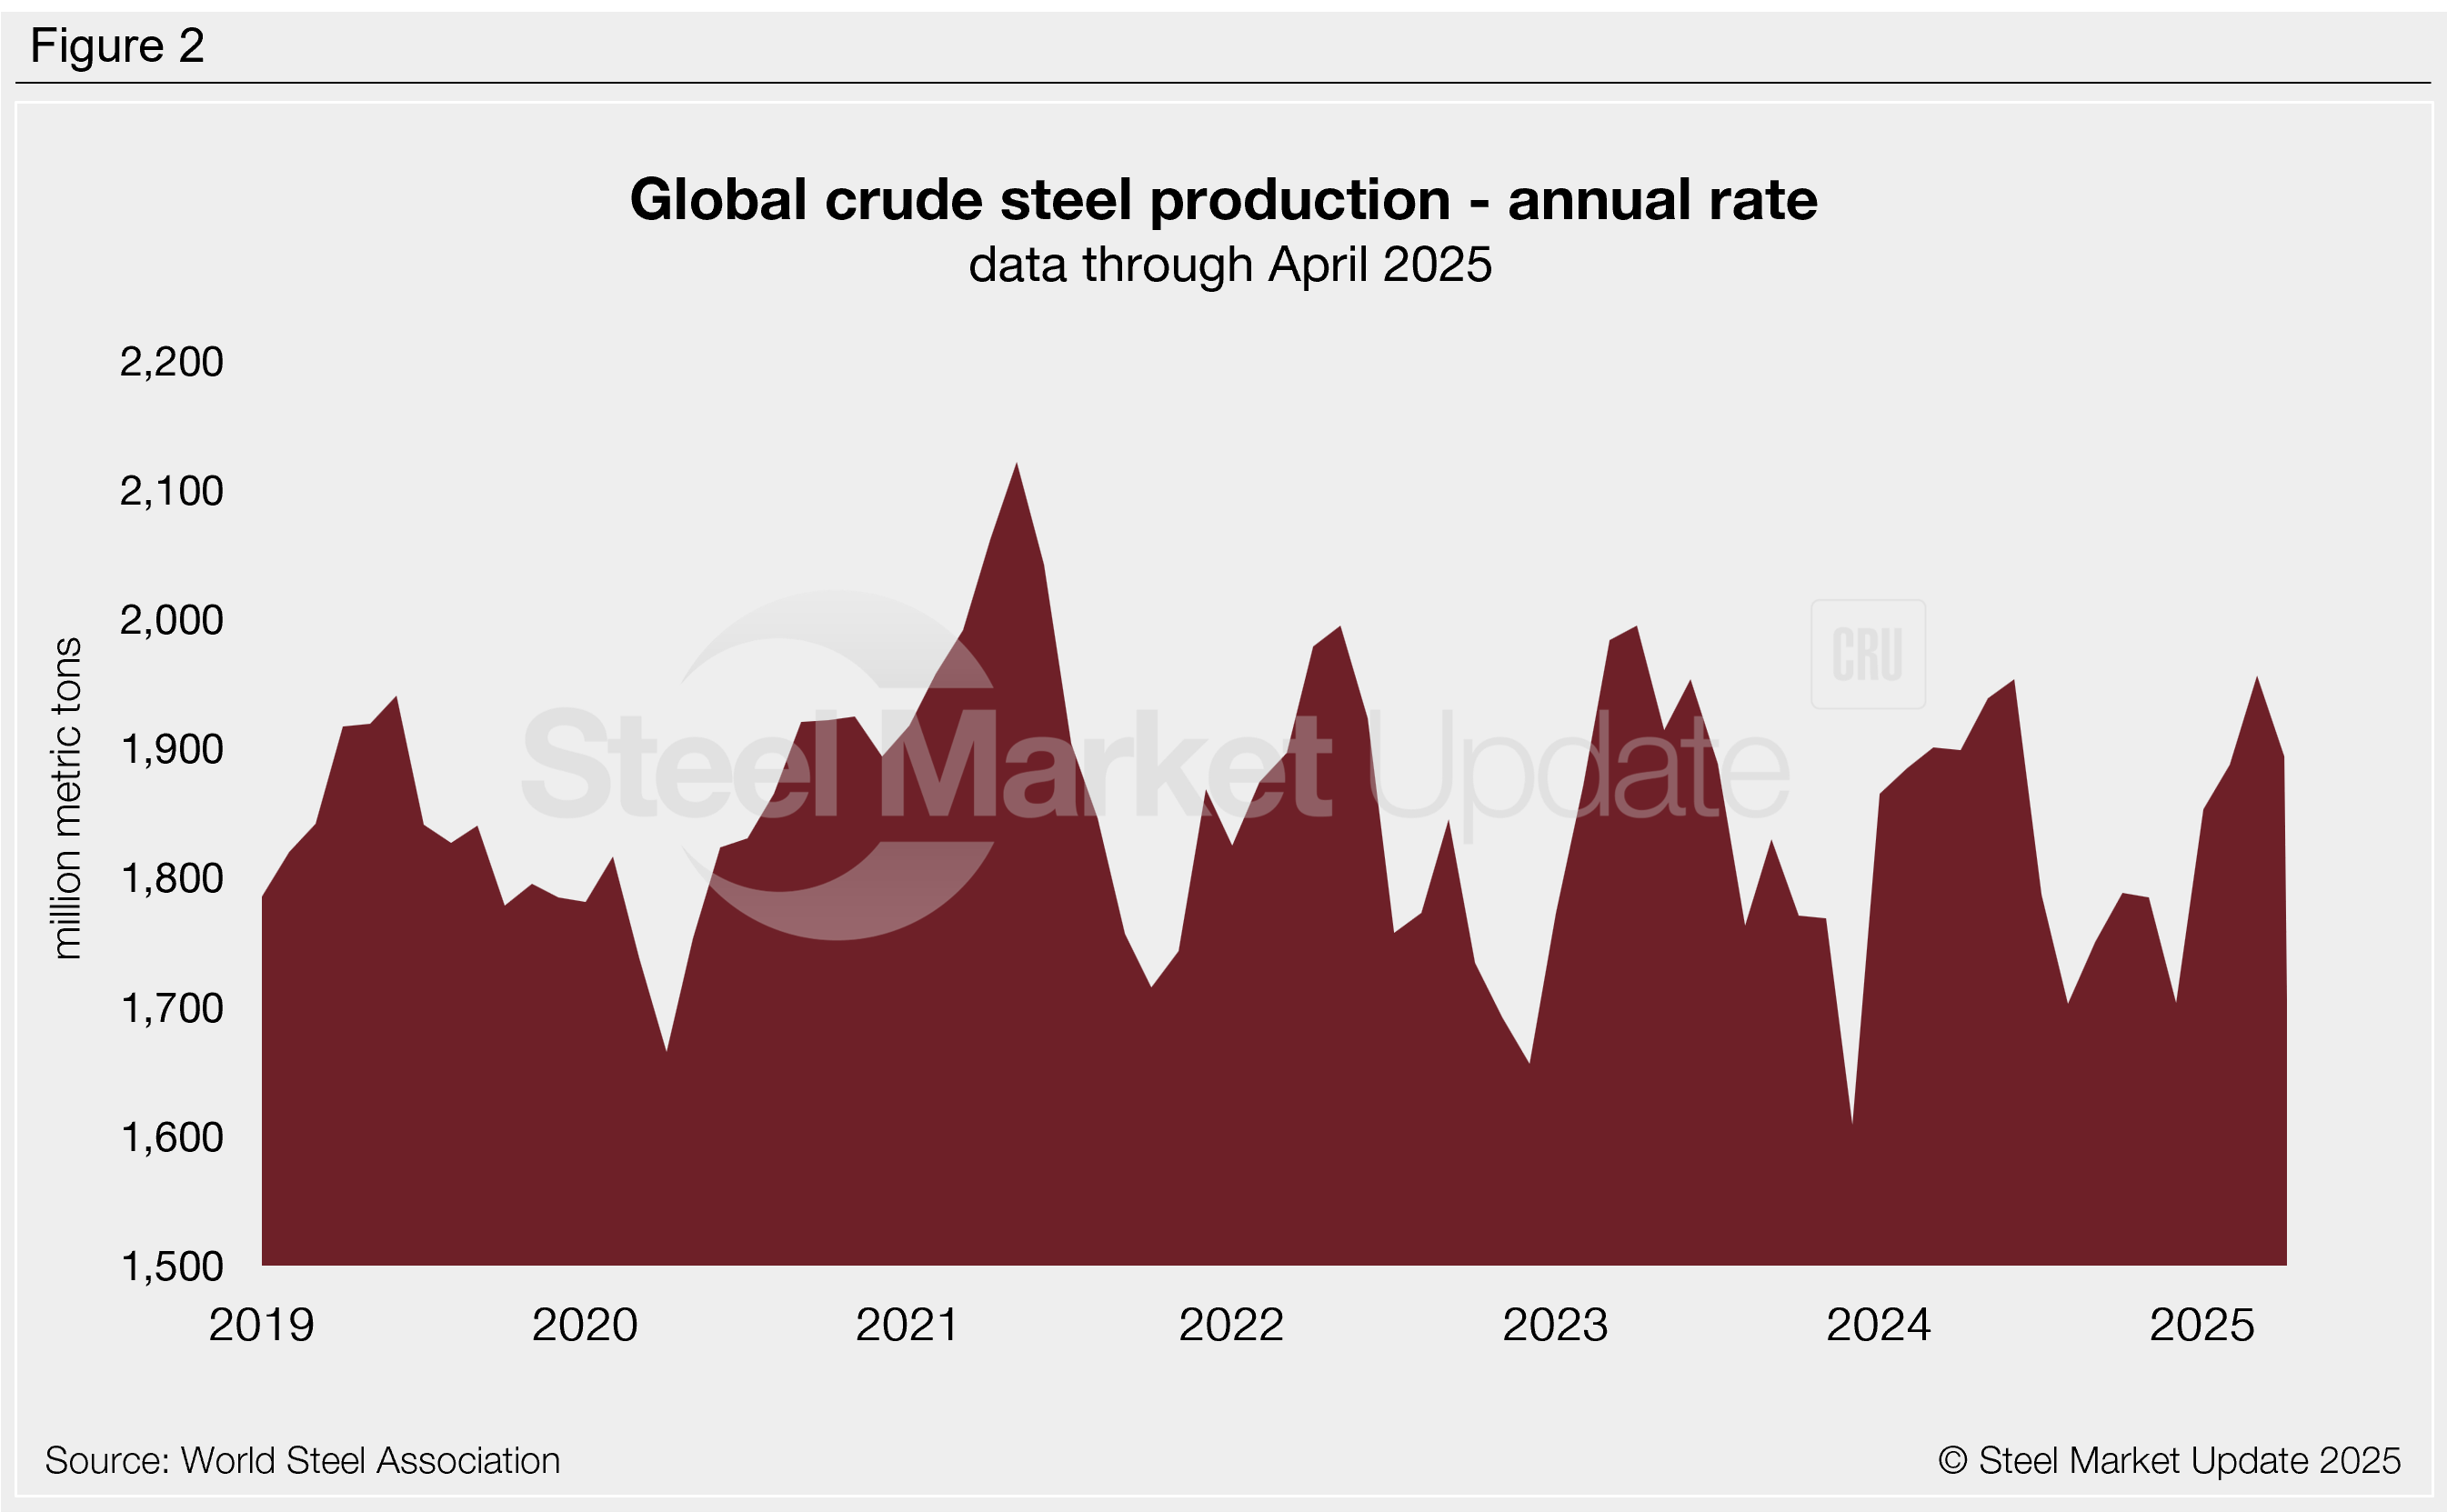
Mills produced an average of 5.19 million mt per day in April, down 3% from March but similar to levels seen one year ago. Across 2024, daily production had climbed as high as 5.35 million mt per day (June) and was as low as 4.67 million mt per day (August and December). This year it has ranged from 5.01-5.36 million mt per day. Annualizing April’s daily rate yields an annual production volume of 1.89 billion mt, one of the stronger rates seen in the last 10 months (Figure 2).
Regional breakdown
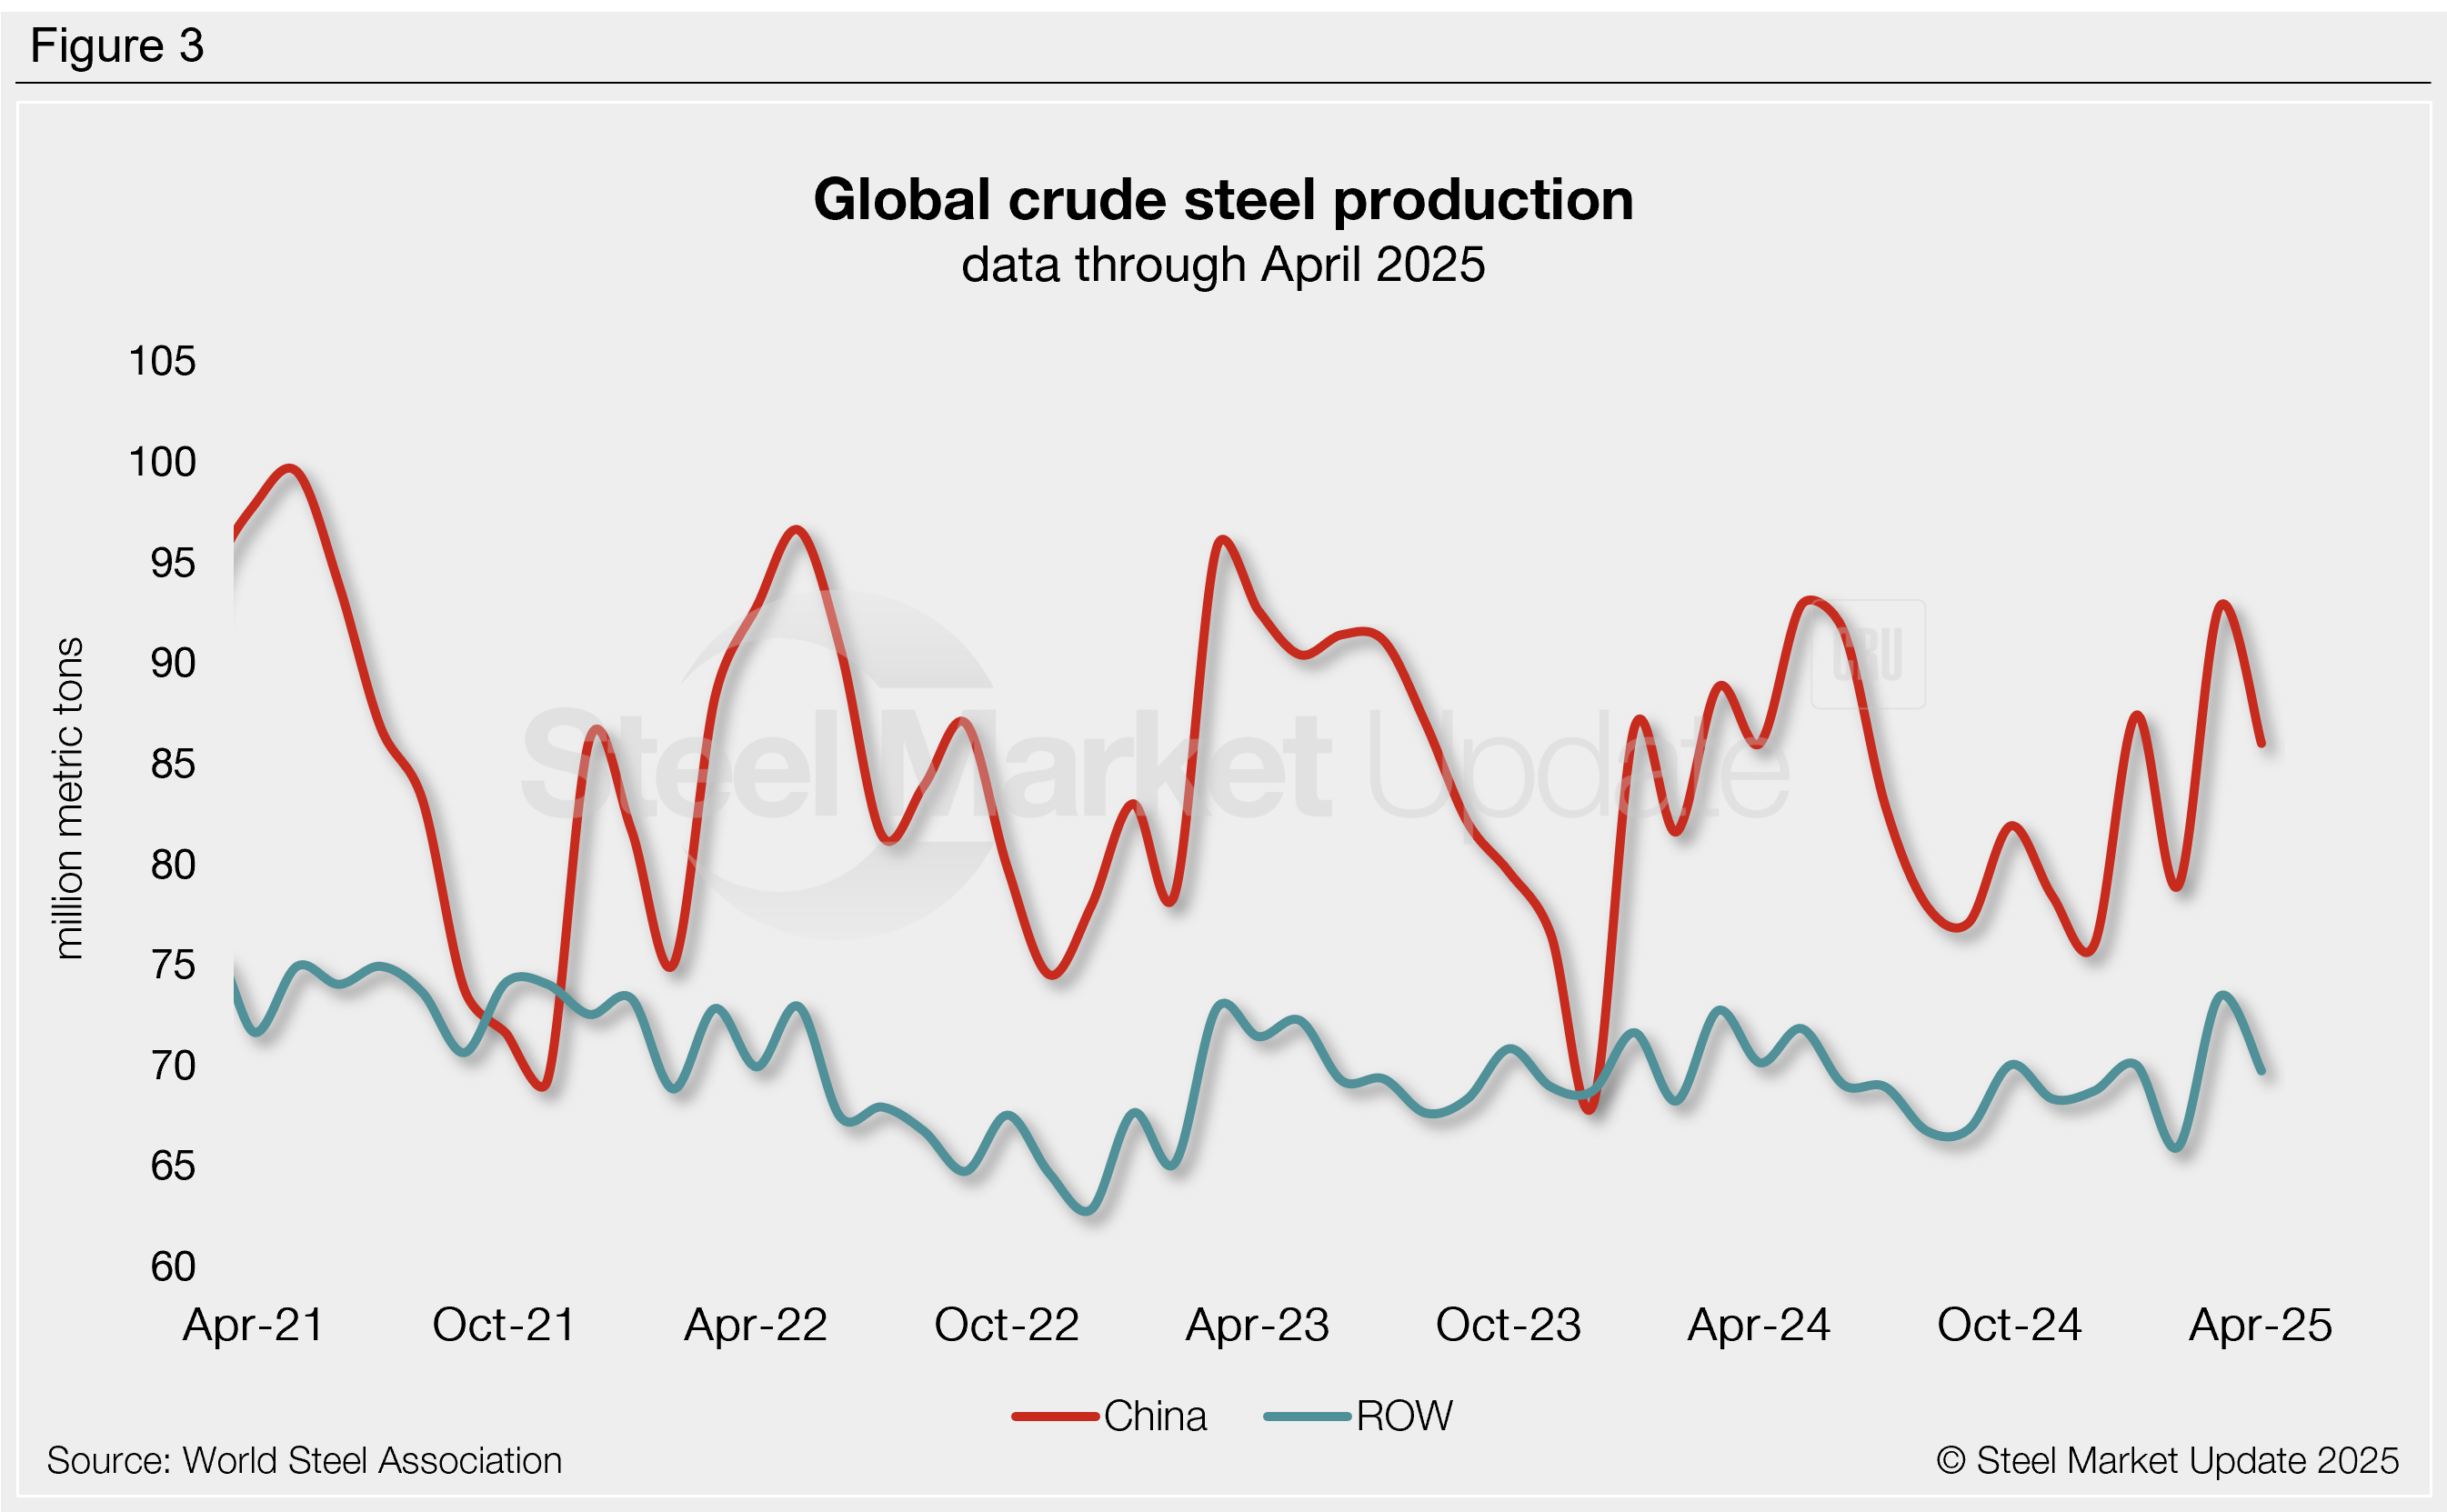
The world’s top steel producer, China, accounted for 86.0 million mt (55%) of April’s total output (Figure 3). Chinese production was down 7% from March’s 10-month high and similar to levels one year ago. In 2024, Chinese mill output averaged 83.5 million mt per month, peaking in May at 92.9 million mt. Over the past three years, Chinese mills have consistently accounted for 50%-57% of total global production.
Steel output from the rest of the world (ROW) totaled 69.7 million mt in April, 5% lower than the previous month and 1% less than April 2024. ROW production averaged 69.4 million mt per month throughout 2024, peaking in March at 72.7 million mt.
Top producing countries
Looking at production by country, India retained its position as the second-largest steelmaker in April, producing 12.9 million mt. Next up was the United States (6.6 million mt), followed by Japan (6.6 million mt), Russia (estimated at 5.8 million mt), South Korea (5.0 million mt), Iran (3.3 million mt), Turkey (3.0 million mt), Germany (3.0 million mt), and Brazil (2.6 million mt).
Comparing year-to-date (YTD) output for each of these countries to the same period of last year shows slight shifts in market share. German mills have produced 12% less steel in the first four months of 2025 than they did in the same time frame of 2024. Production in India increased 7% in that same period. Other notable shifts in YTD production were evident in Iran (-8%), Japan (-5%), Russia (-5%), and South Korea (-3%).