Pipe and Tube

September 16, 2025
September energy market update
Written by Brett Linton
In this Premium analysis we examine North American oil and natural gas prices, drill rig activity, and crude oil stock levels through September. Trends in energy prices and rig counts serve as leading indicators for oil country tubular goods (OCTG) and line pipe demand.
The Energy Information Administration (EIA) recently released its Short-Term Energy Outlook (STEO) for September. The latest report continues to forecast declining crude oil prices, which are expected to fall sharply into 2026 as rising OPEC+ output inflates inventories. Natural gas prices are expected to rise due to flat production and increasing export demand. Gasoline prices and household fuel spending are expected to decline, even as consumption edges higher. Electricity generation continues to expand, led by solar growth. View the full September STEO report here for detailed insights on energy prices, production, inventories, and more.
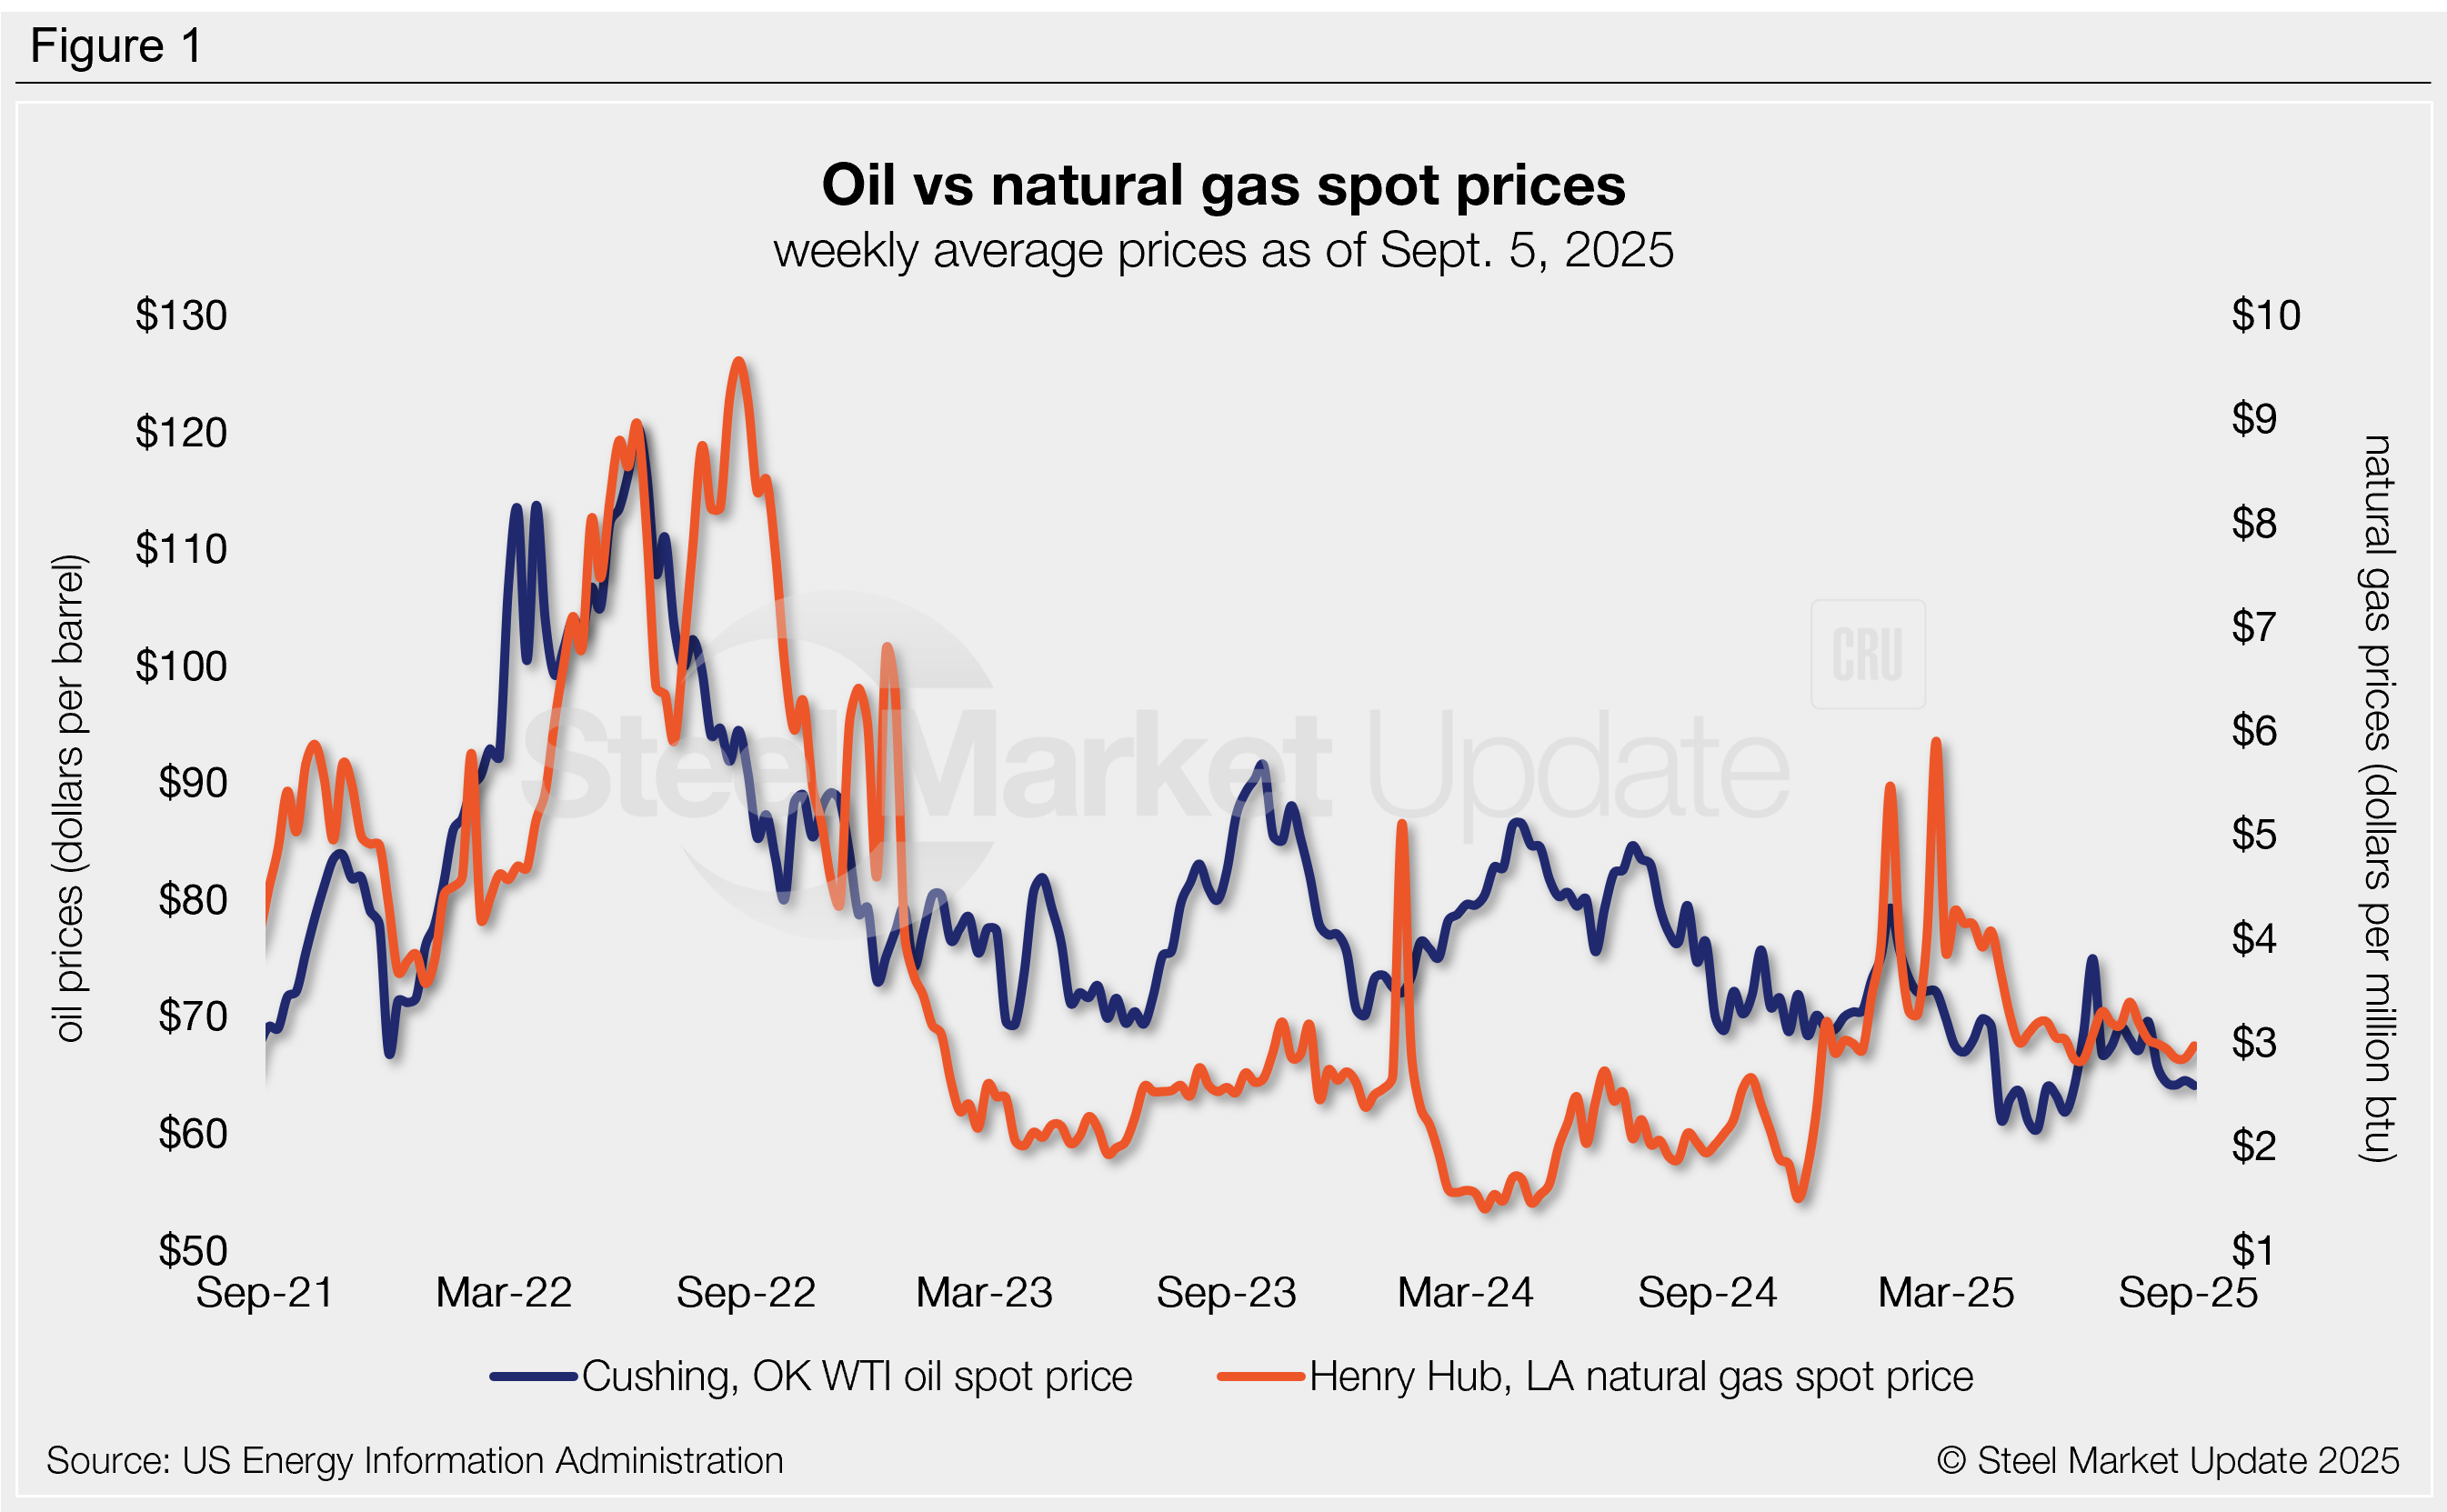
Oil spot prices
Following the blip seen in June and July, the weekly West Texas Intermediate oil spot market price has shifted back lower in recent months. As of Sept. 5, the spot price fell to a three-month low of $64.09 per barrel (b) (Figure 1). Compare this to the multi-year low of $60.99/b seen back in May. For all but one week since February, oil prices have remained below the $70-90/b range they generally held over the previous two years.
The September STEO forecasts oil spot prices to average $59/b in the fourth quarter and for early 2026 to average $50/b.
Gas spot prices
Natural gas spot prices have been relatively steady since May, holding around $3.00/mmBtu (million metric British thermal units). As of Sept. 5, the weekly spot price was $2.97/mmBtu.
EIA expects natural gas prices to increase further through the end of the year, forecasting a fourth-quarter average of $3.70/mmBtu and for 2026 to average $4.30/mmBtu.
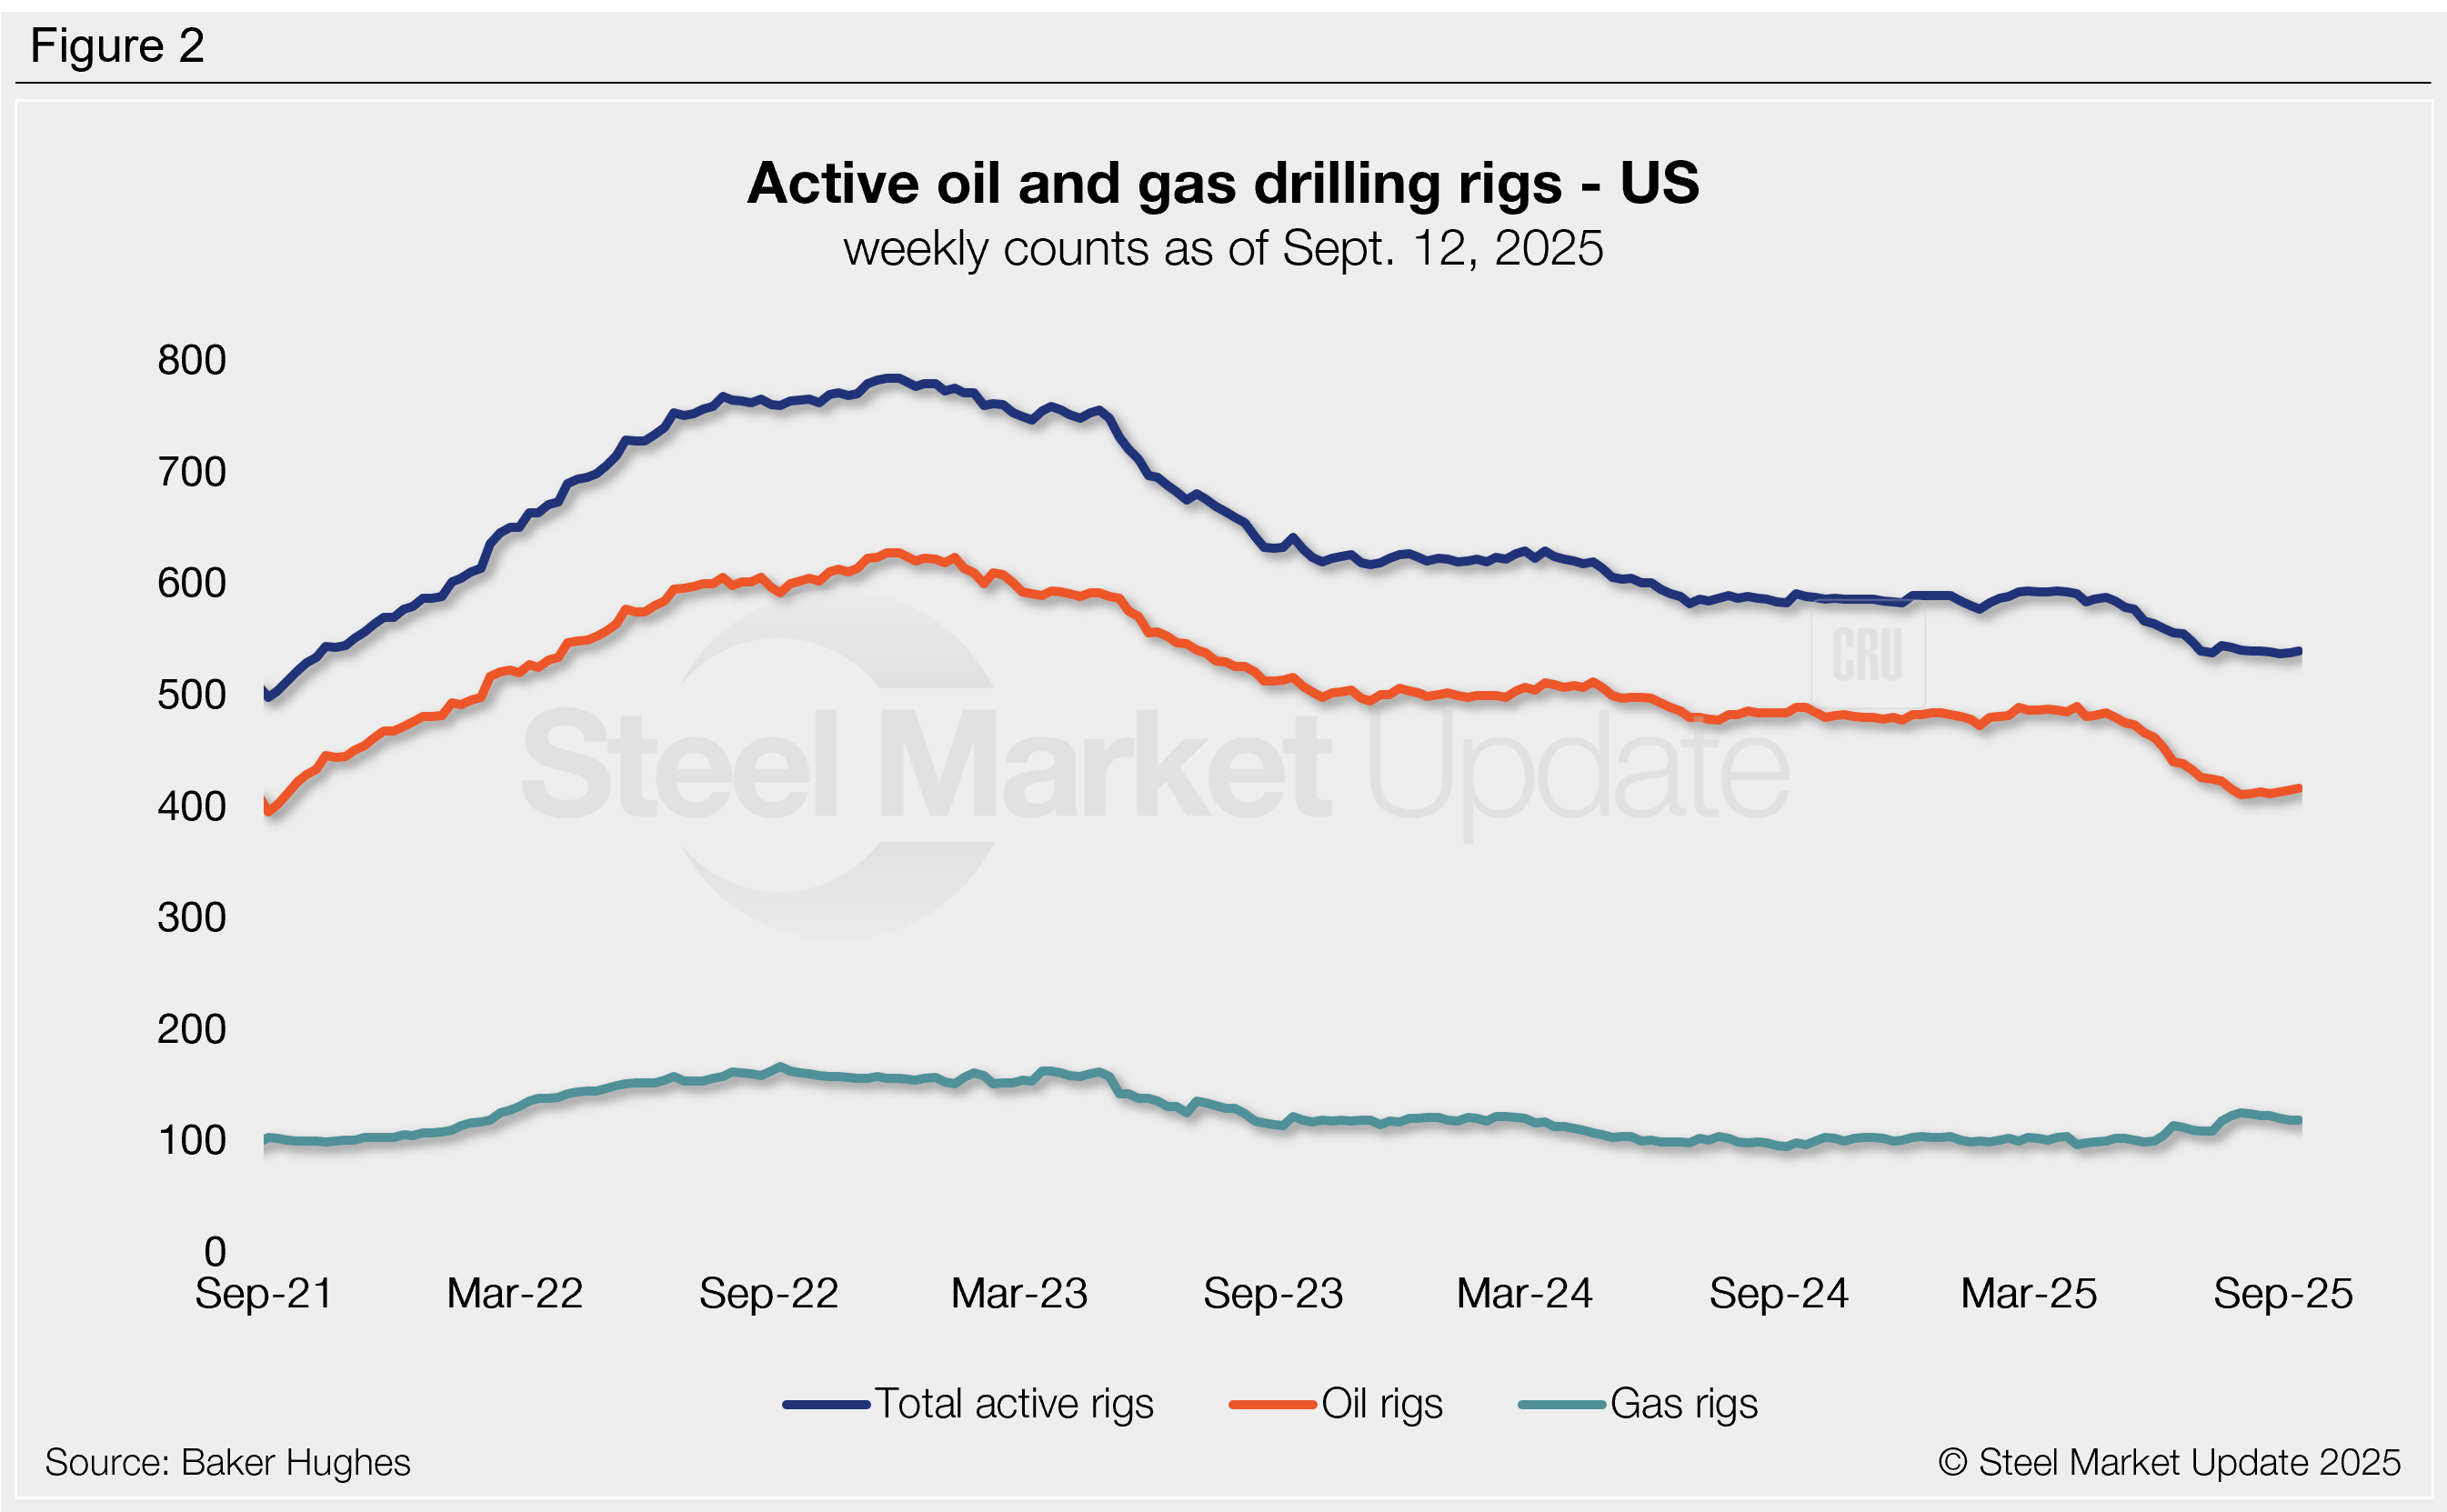
Rig counts
US drilling activity continues to hover just above historic lows, remaining at reduced levels for over a year. The latest count rose by two rigs last week to 539, only three rigs higher than the near-four-year low seen two weeks prior (Figure 2). This total included 416 oil rigs, 118 gas rigs, and five miscellaneous rigs. Compared to the same week of 2024, there were 51 fewer rigs in operation this week.
EIA expects US drilling activity to shift toward gas-producing regions in 2026, with crude output edging lower and natural gas production holding flat.
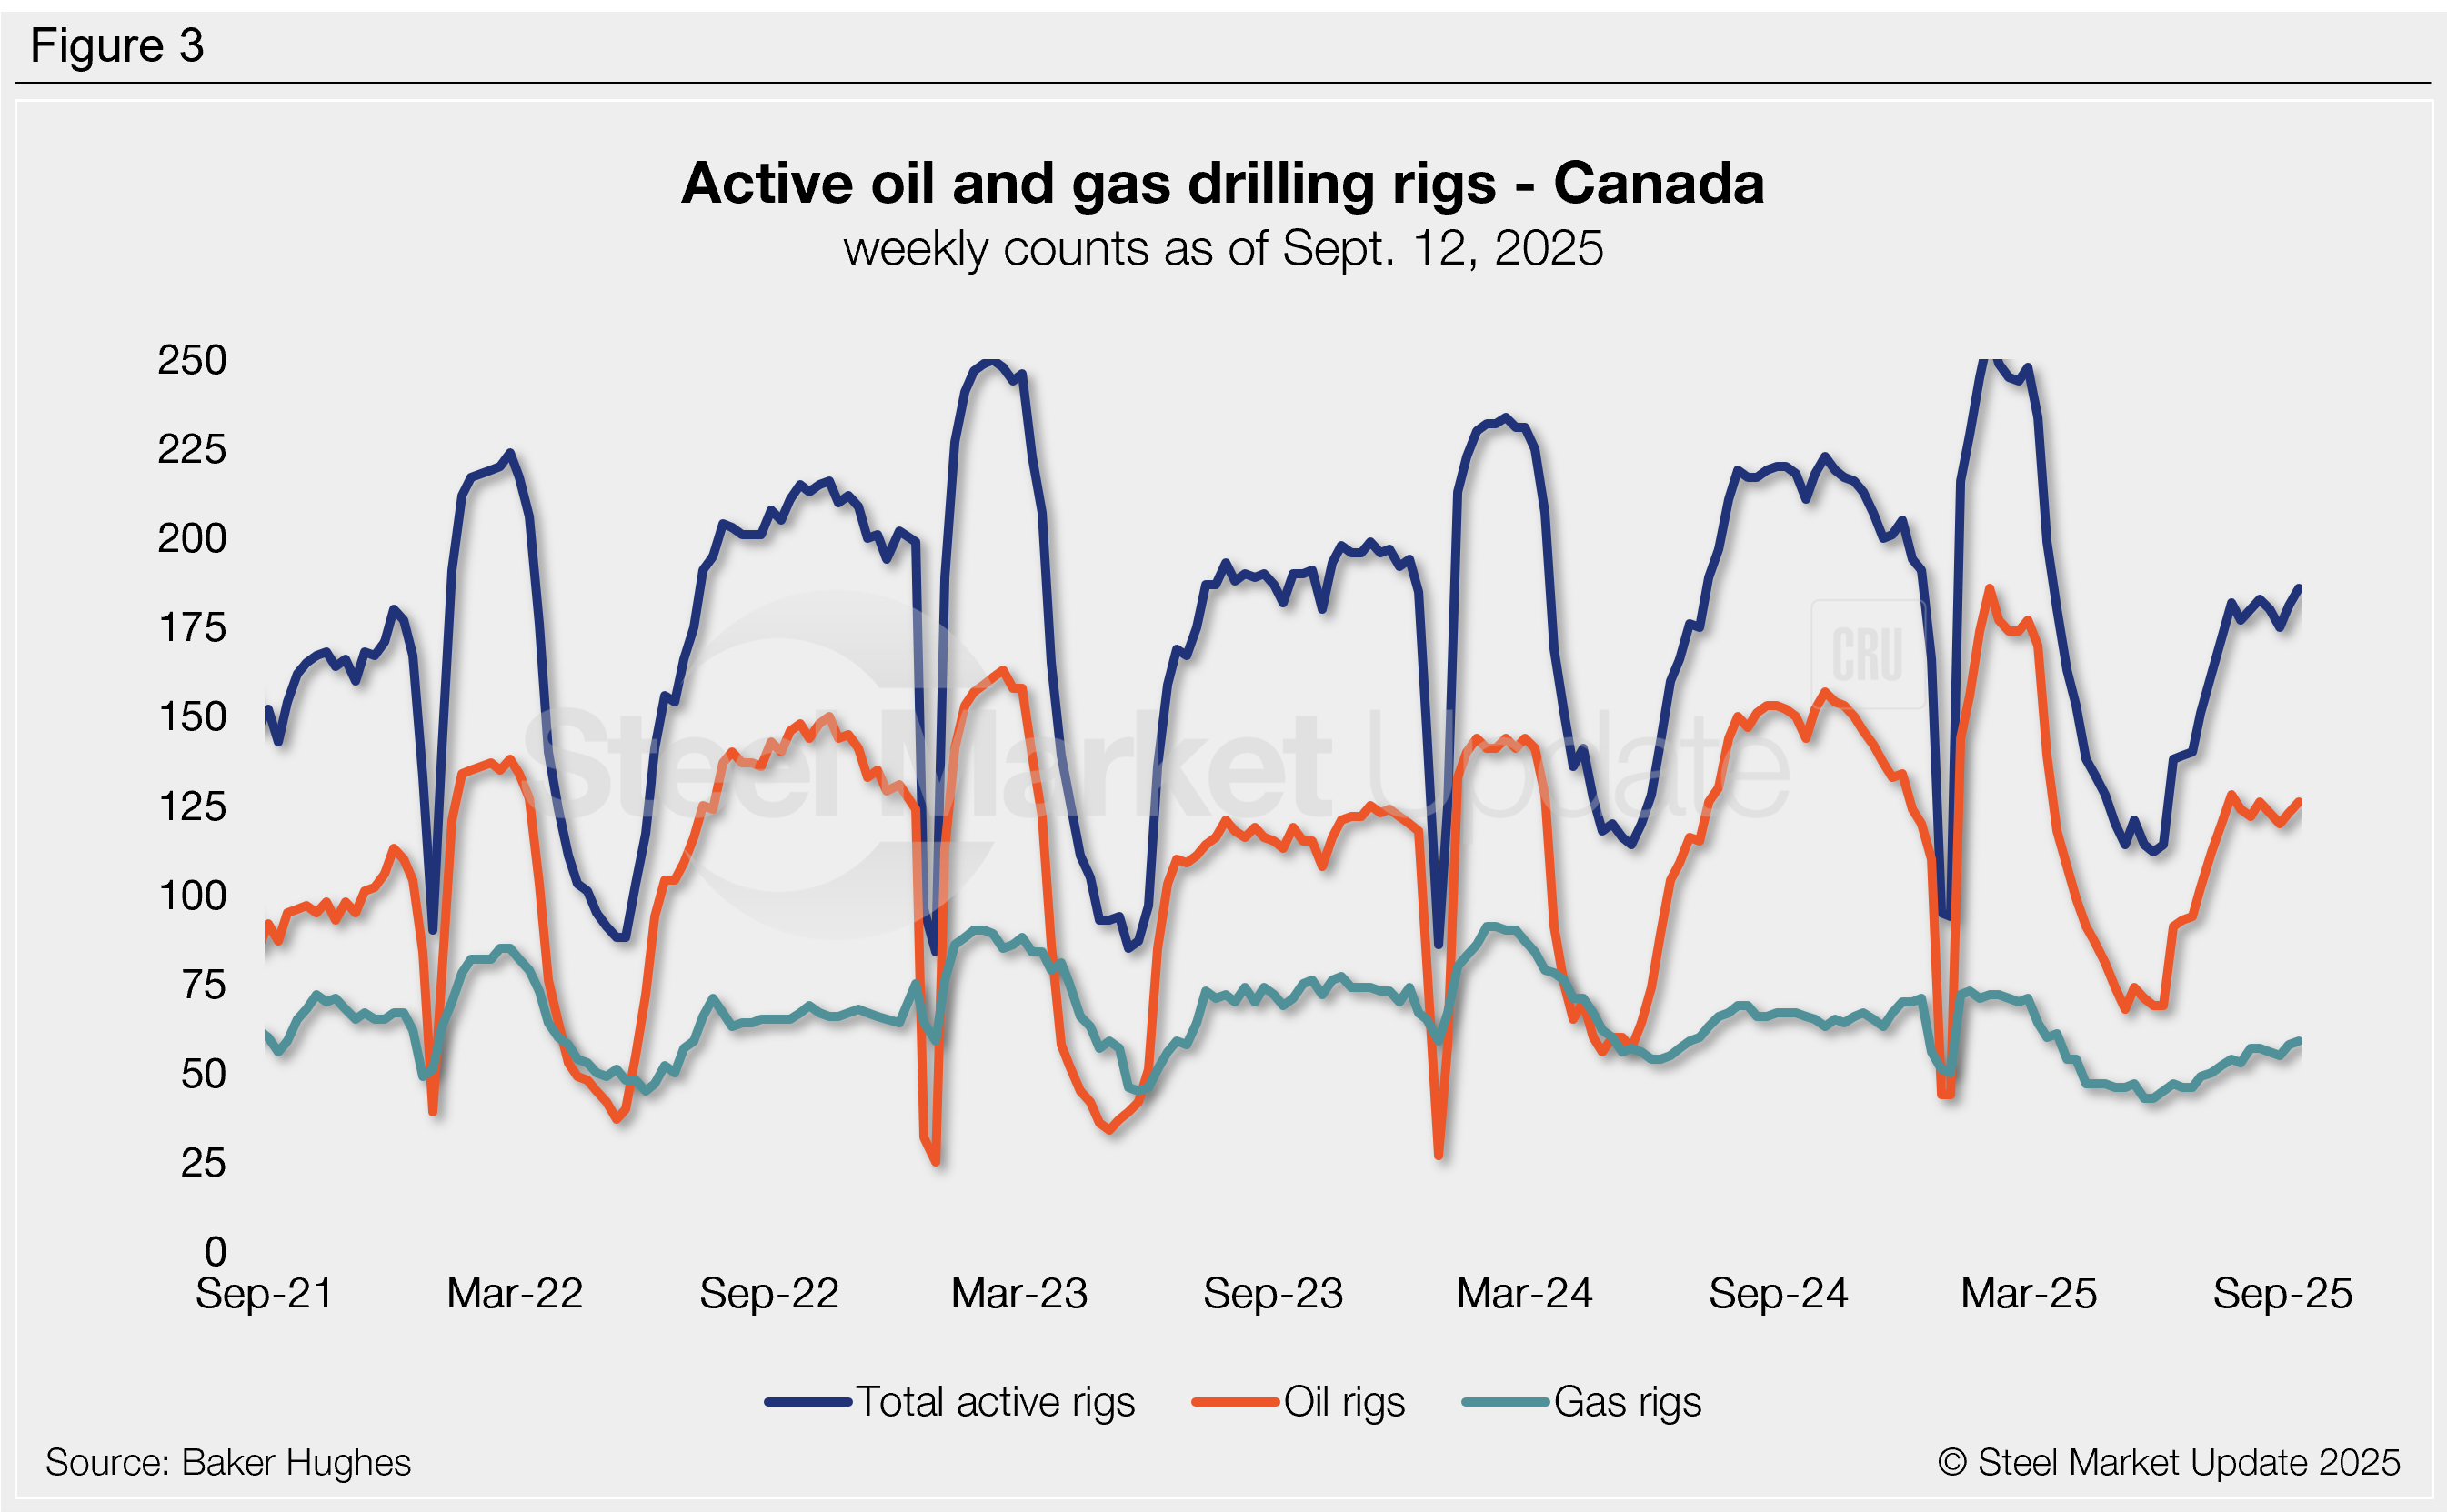
Canadian counts remain comparatively healthy, rising by five rigs to a six-month high of 186 last week (Figure 3). This count consisted of 126 oil rigs, 59 gas rigs, and one miscellaneous rig. Despite recent increases, Canadian counts are down 32 rigs compared to those seen one year prior.
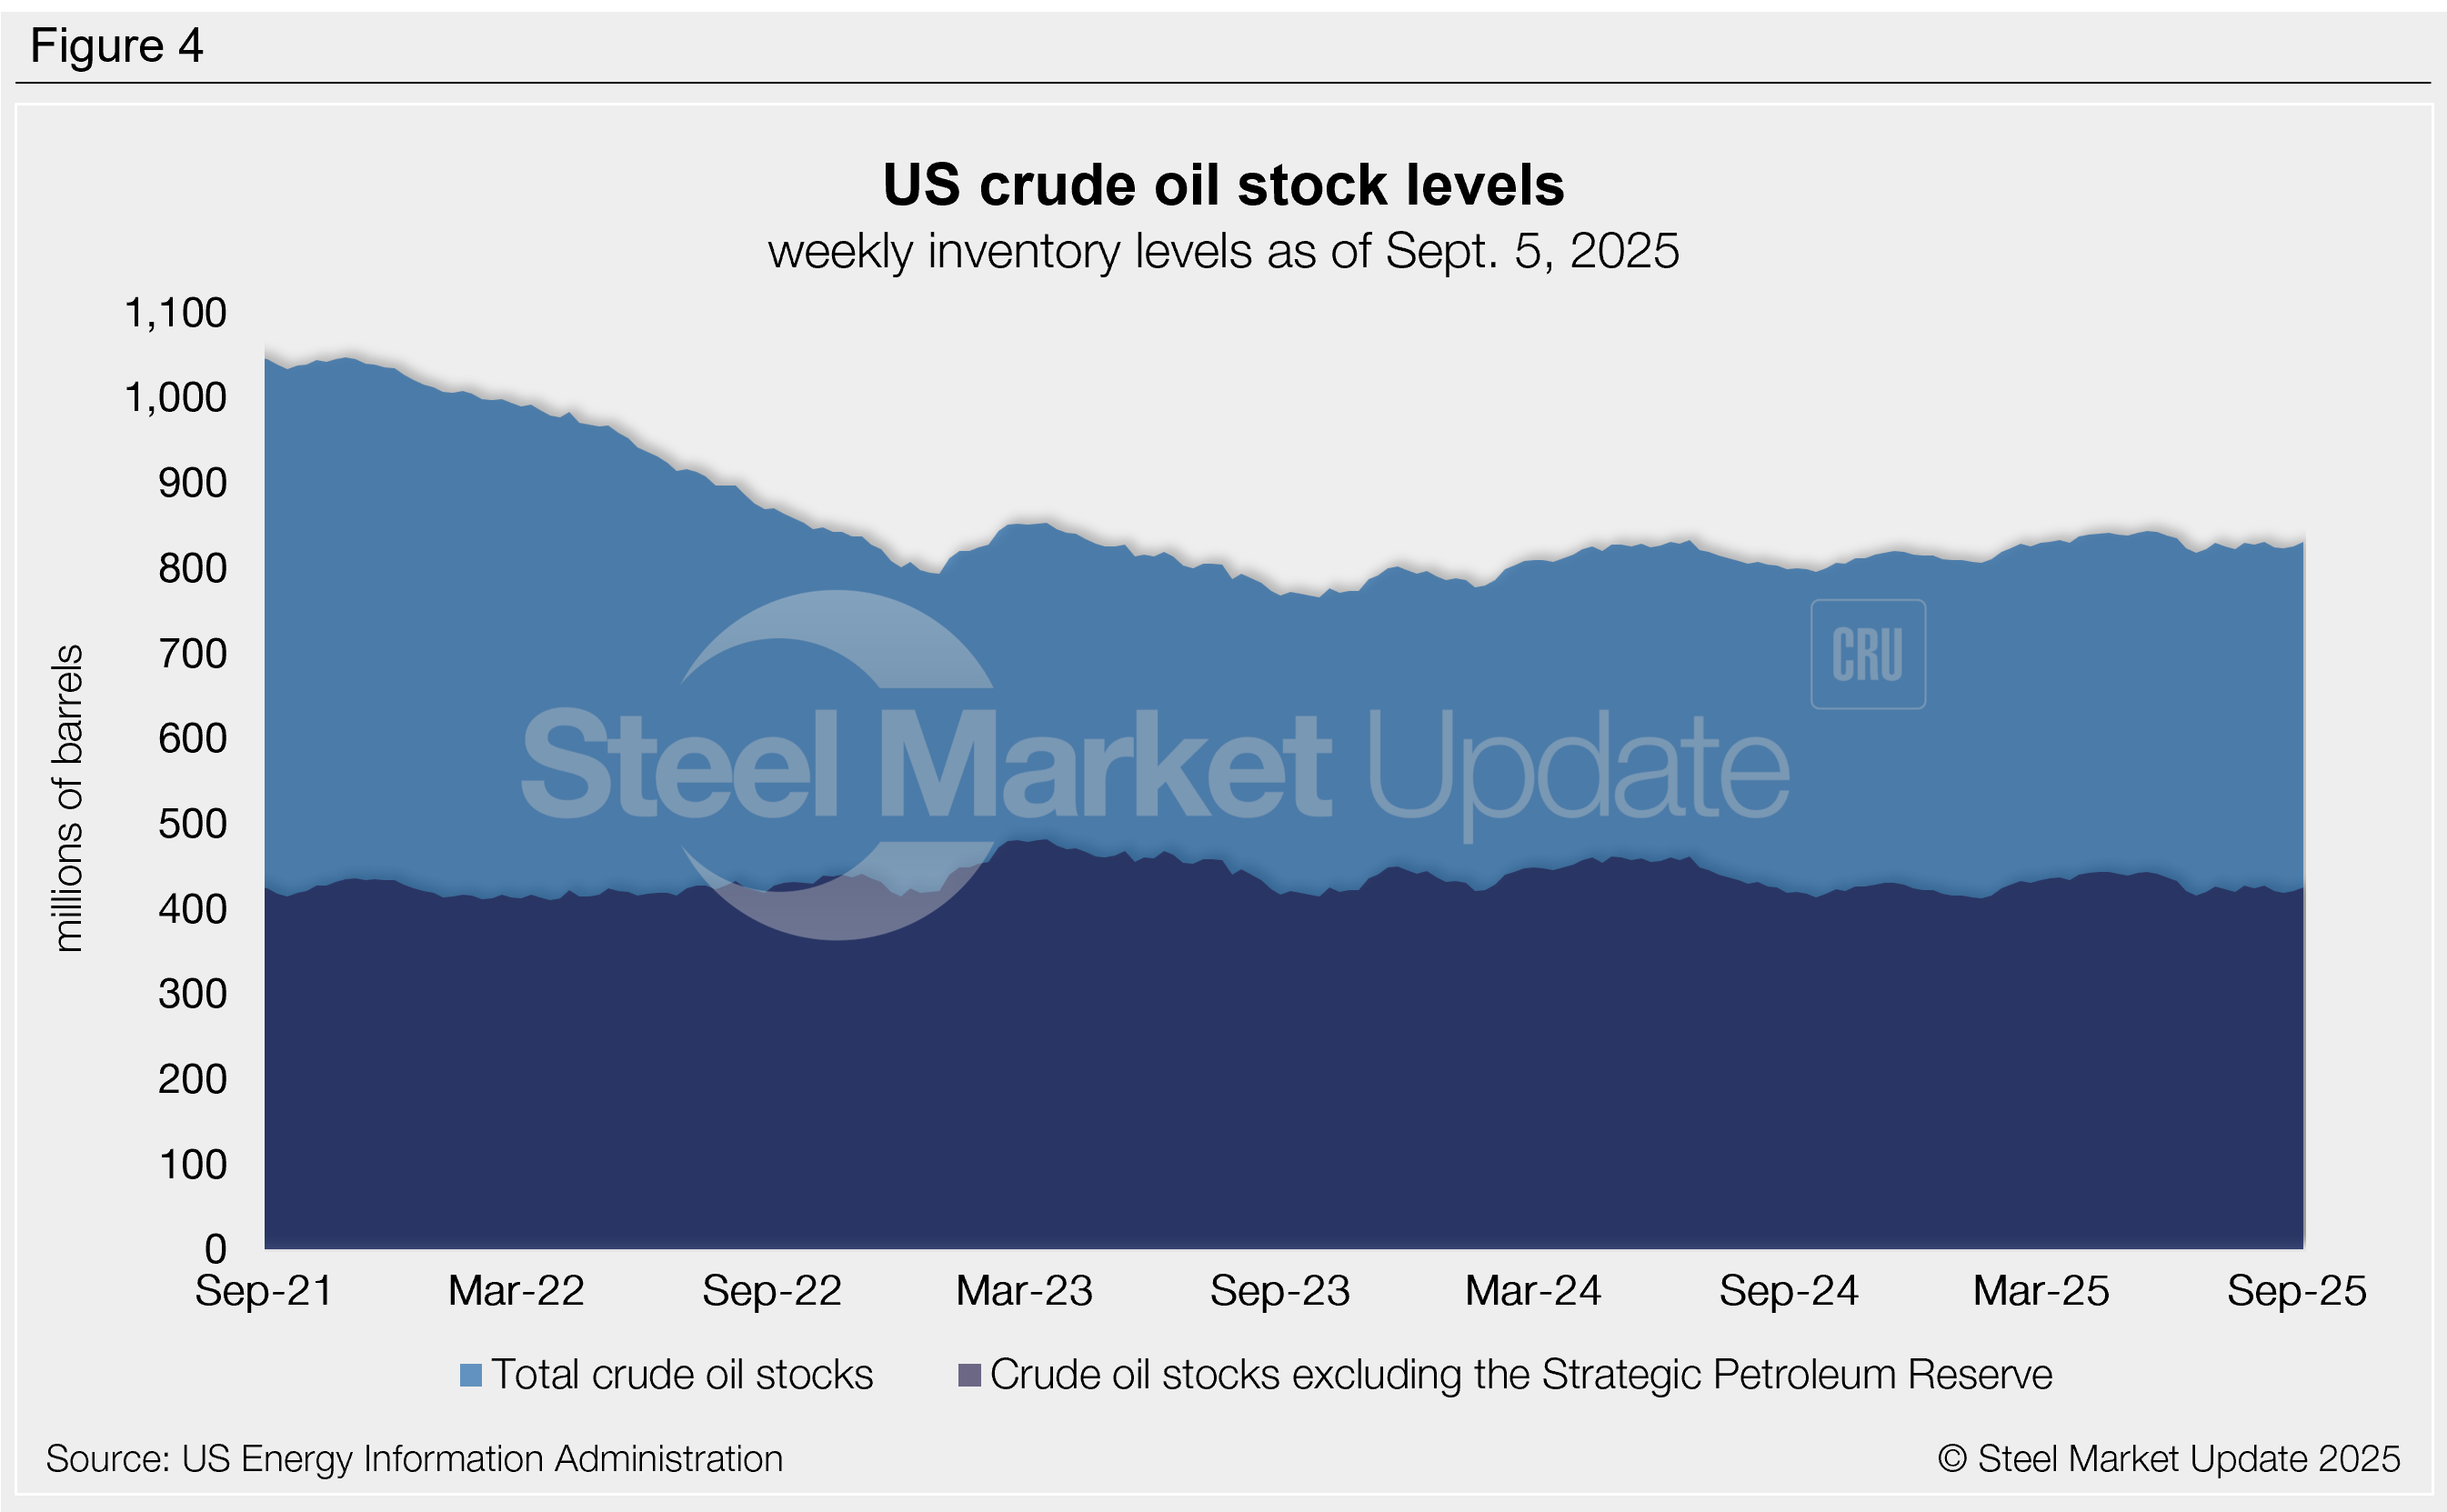
Crude stock levels
US crude oil stock levels have remained relatively stable since the start of the year. As of Sept. 6, stocks totaled 830 million barrels, one of the higher levels recorded over the past three months. Compare this to the two-year high of 844 million barrels seen back in May. Stocks are 3% higher than they were at the beginning of the year and 4% higher than the same time last year (Figure 4).