Long Products
March 13, 2026
Steel imports remain low in January and February
Written by Brett Linton
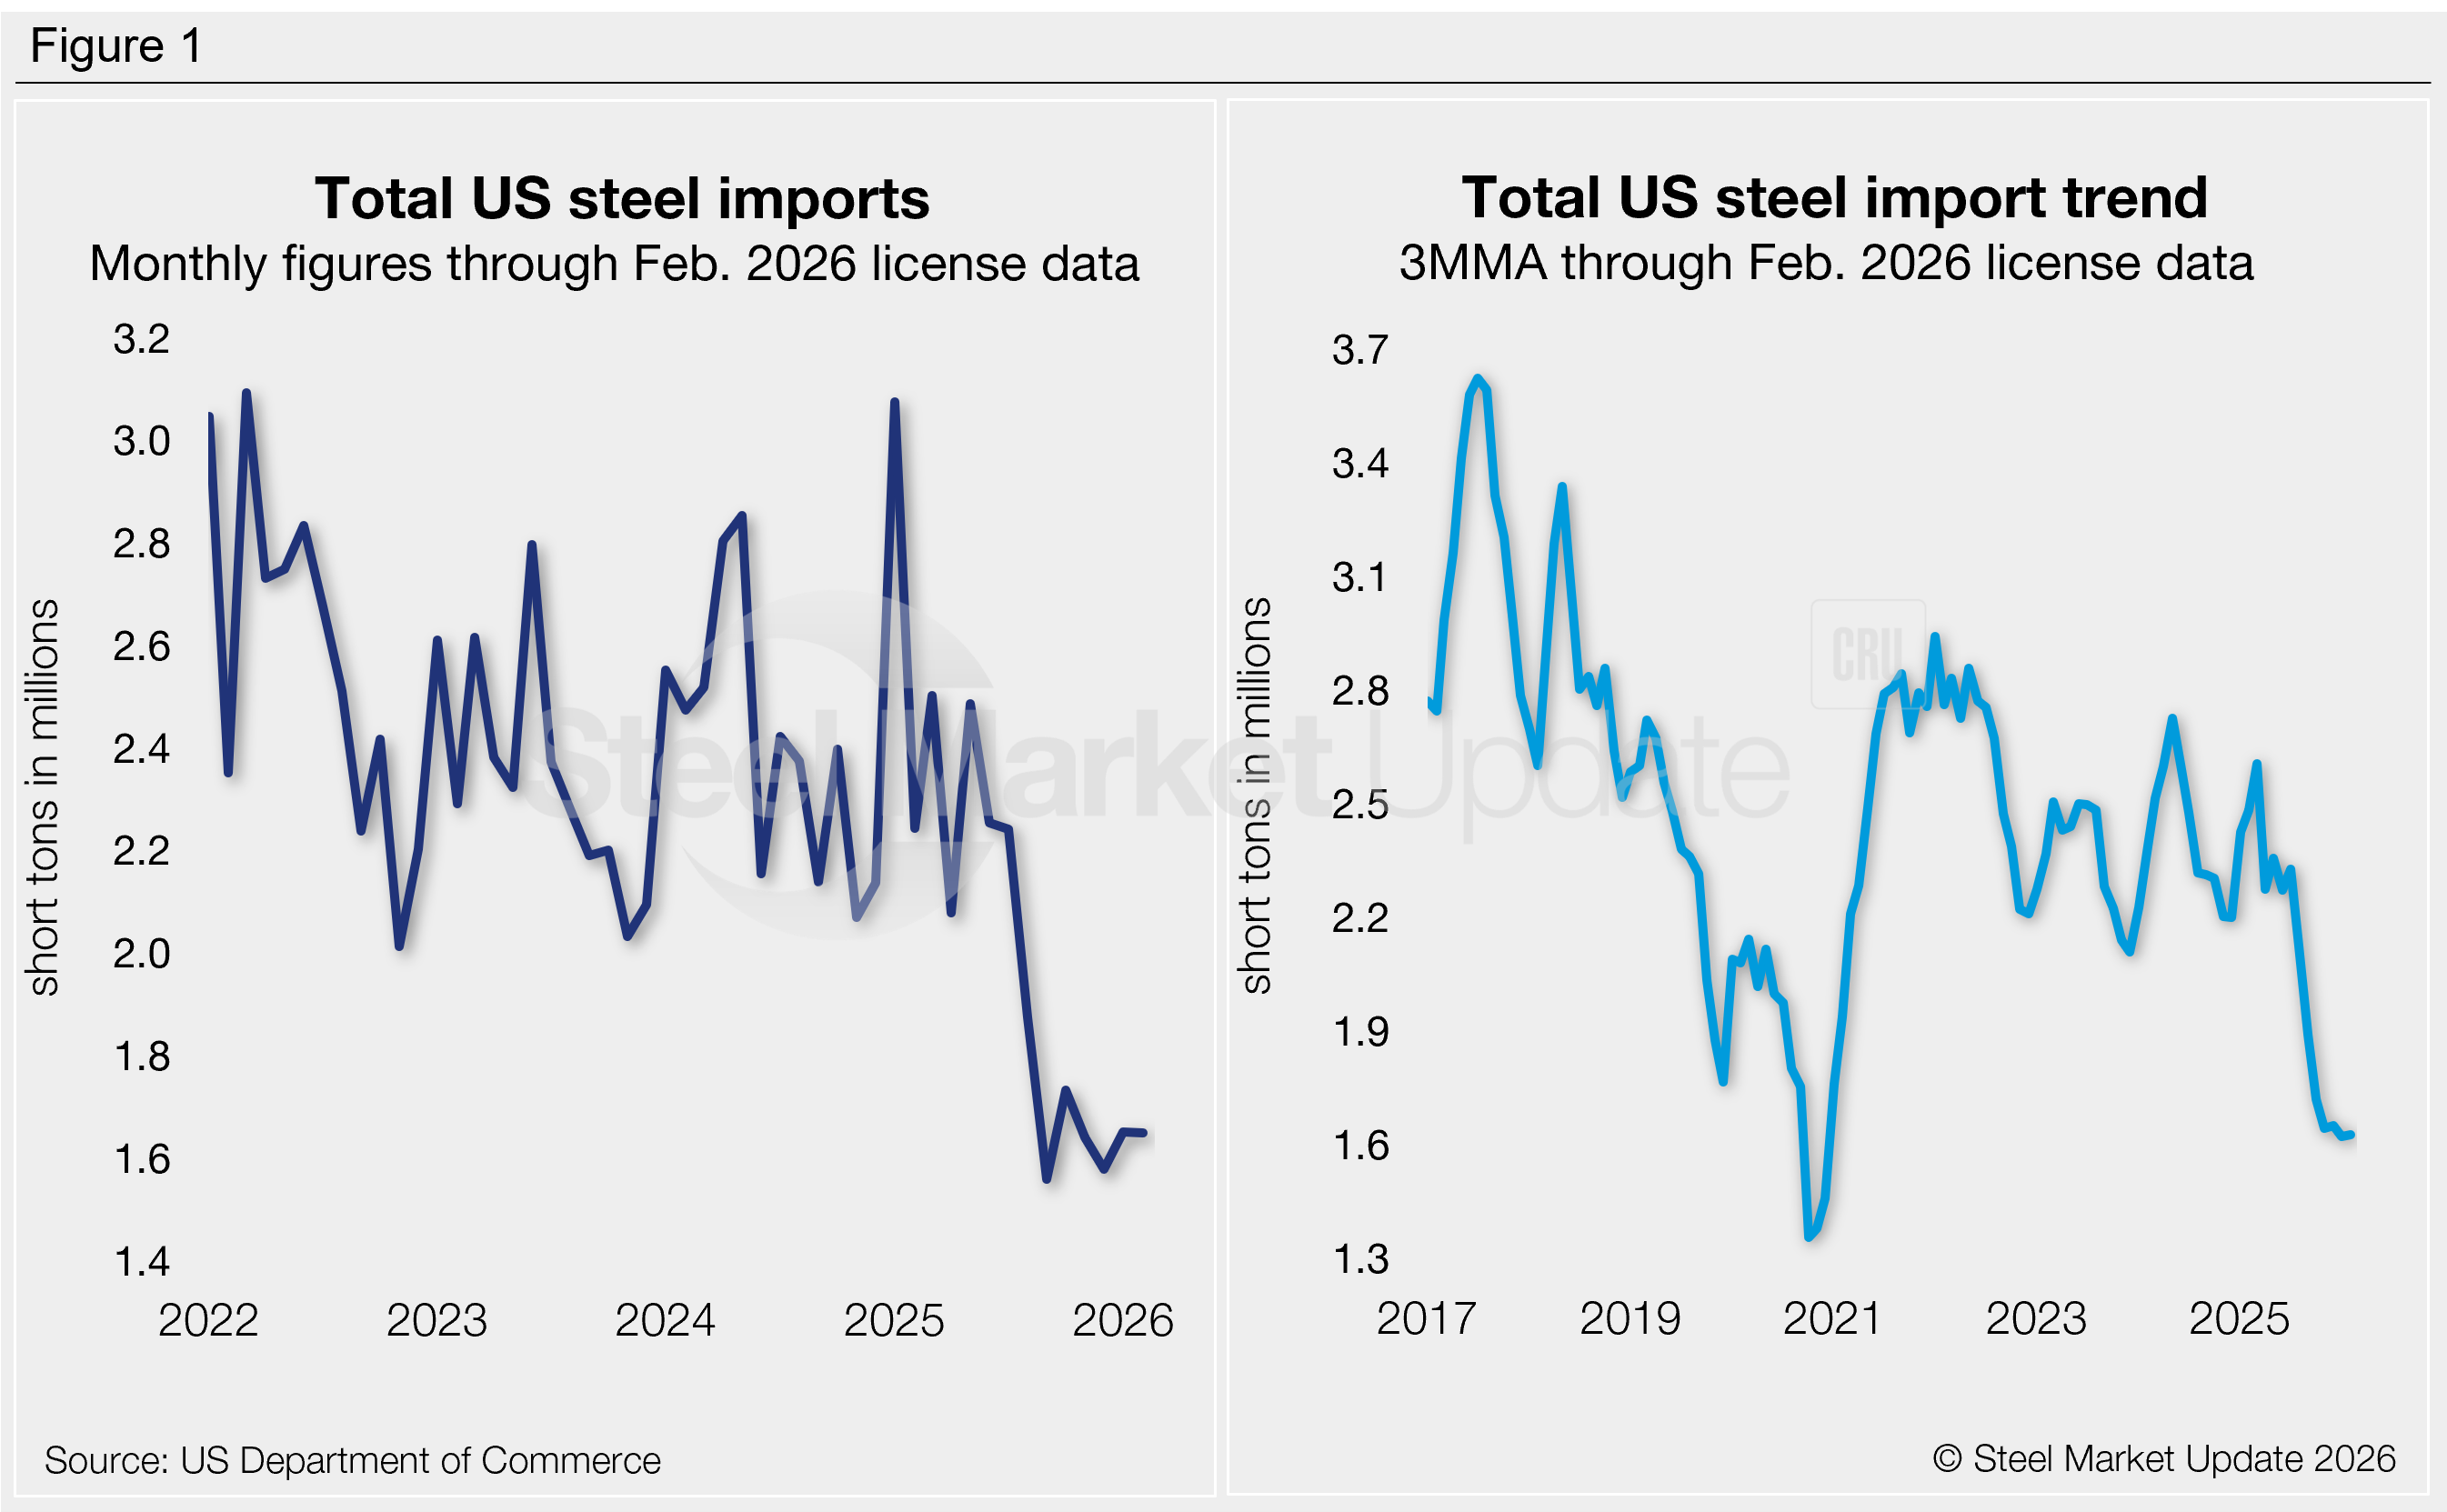
Steel imports remained close to multi-year lows in January and February, according to US Commerce Department data released this week. Final January figures inched up 5% month-over-month (m/m) and February license data is almost identical. In the last six months, we have witnessed imports shrink to some of the lowest volumes recorded in the last five years.
The total volume of steel products imported into the country in January was 1.65 million short tons (st), just ~90,000 st above the near five-year low set last September. February license data collected through March 10 is almost identical to January levels.
Recall that in January 2025 imports spiked to a two-and-a-half-year high of 3.08 million st. Trade balanced out through the first half of last year, then significantly slowed after July and have not recovered since (Figure 1, left).
Imports by country
Focusing on final January figures, two-thirds of the steel that entered the country came from just seven countries: South Korea (17%), Mexico (14%), Canada (13%), Brazil (11%), Taiwan (4%), Turkey (4%), and Vietnam (4%). Other major suppliers included Germany, India, Romania, Japan, Argentina, China, Spain, and Austria, each contributing 2-3% of the total. Combined, these 15 countries accounted for 86% of all January imports.
Zooming out, the bulk of the decline seen in recent months can be primarily traced to four countries: Canada, Brazil, Mexico, and Vietnam. Comparing import volumes in the second half of 2024 to the same period of 2025 shows reductions from 24-45%.
To explore steel import data by country, category, or specific product, visit the International Trade Administration’s Steel Import Monitor.
Import trends
To better highlight trends, import data can be analyzed as a three-month moving average (3MMA) to smooth out monthly variations (Figure 1, right). On this basis, 3MMA imports have trended lower since April 2025. Through February license data, the 3MMA is down to 1.63 million st, the second-lowest rate since late 2020.
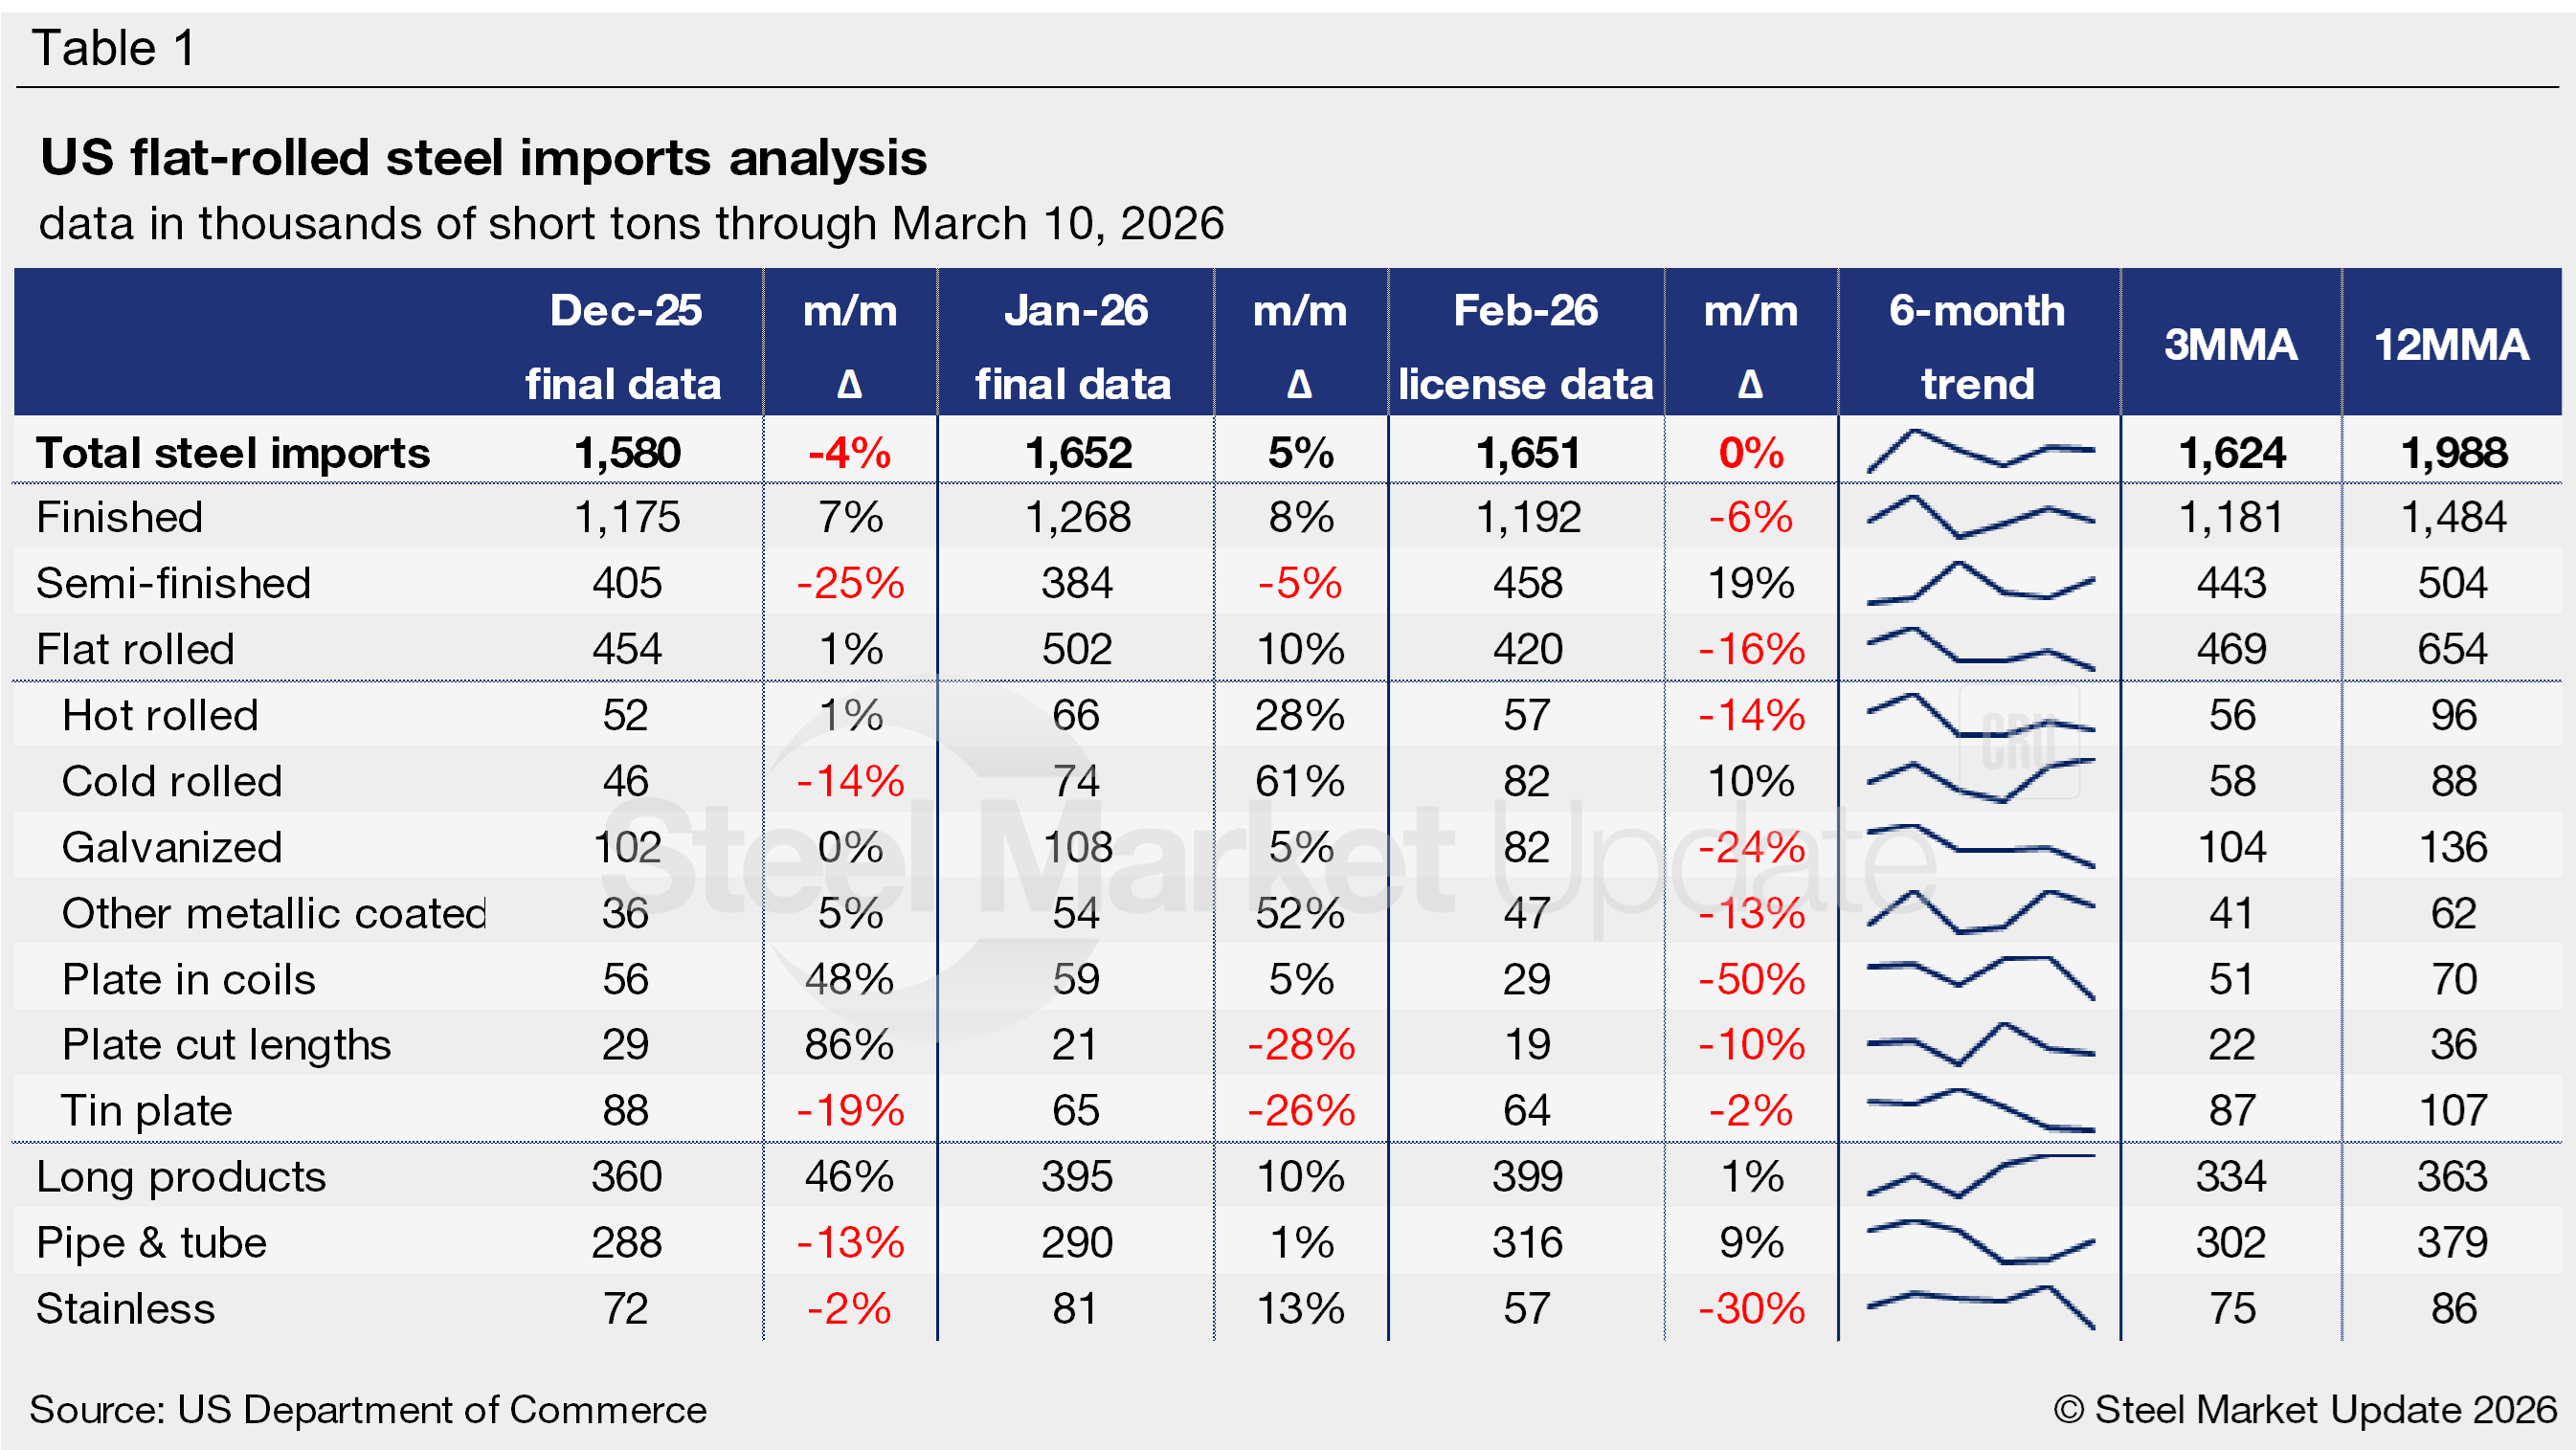
Imports by product
Table 1 highlights high-volume steel product imports (click to expand). Note that the 3MMA and 12MMA columns are calculated through final January data and do not include February licenses. For deeper analysis, visit our Steel Imports page.
Finished vs. semi-finished imports
Imports of finished steel vs. semi-finished products (mostly slabs to be further processed by a mill) have moved in differing directions in recent months (Figure 2).
Semi-finished trade slipped 5% from December to January to 384,000 st. This marks the third-lowest monthly rate seen in the past year but is not radically low by historical standards. February licenses are back up 19%.
Finished imports increased 8% in January to 1.27 million st. This is similar to trade levels of the prior four months, but substantially lower than recent years (2024 averaged 1.89 million st). February licenses are down 6%.
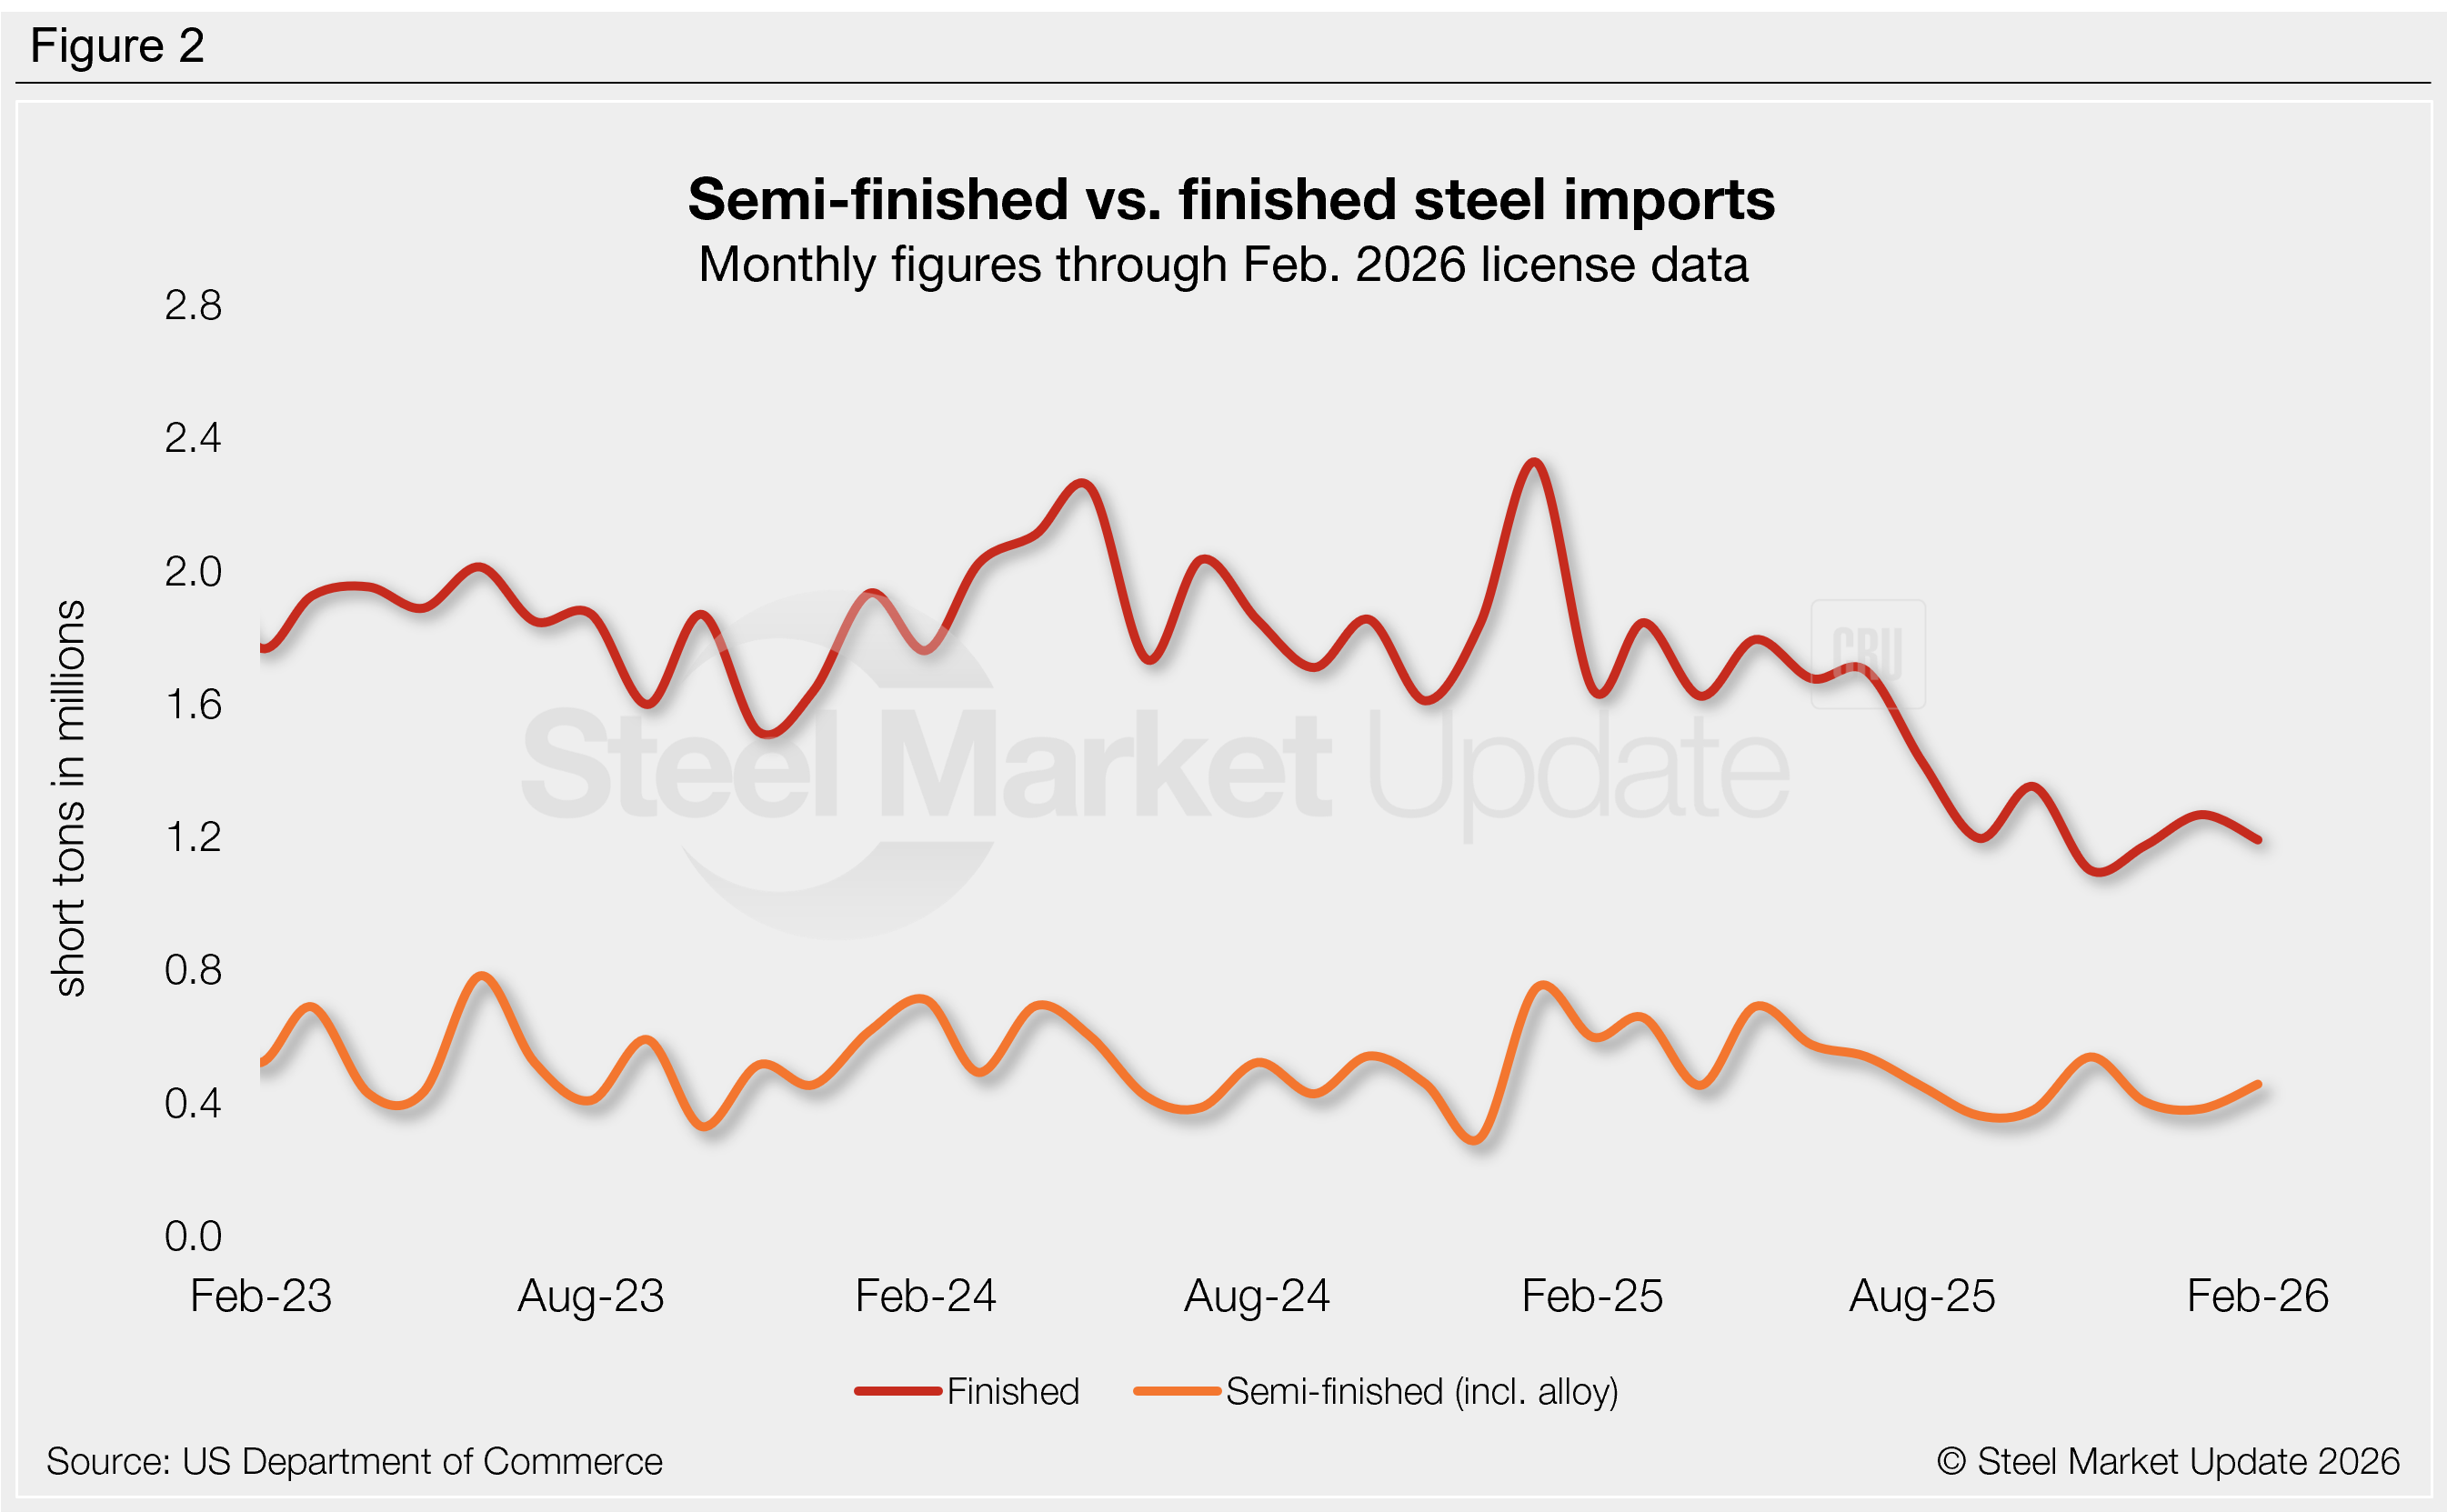
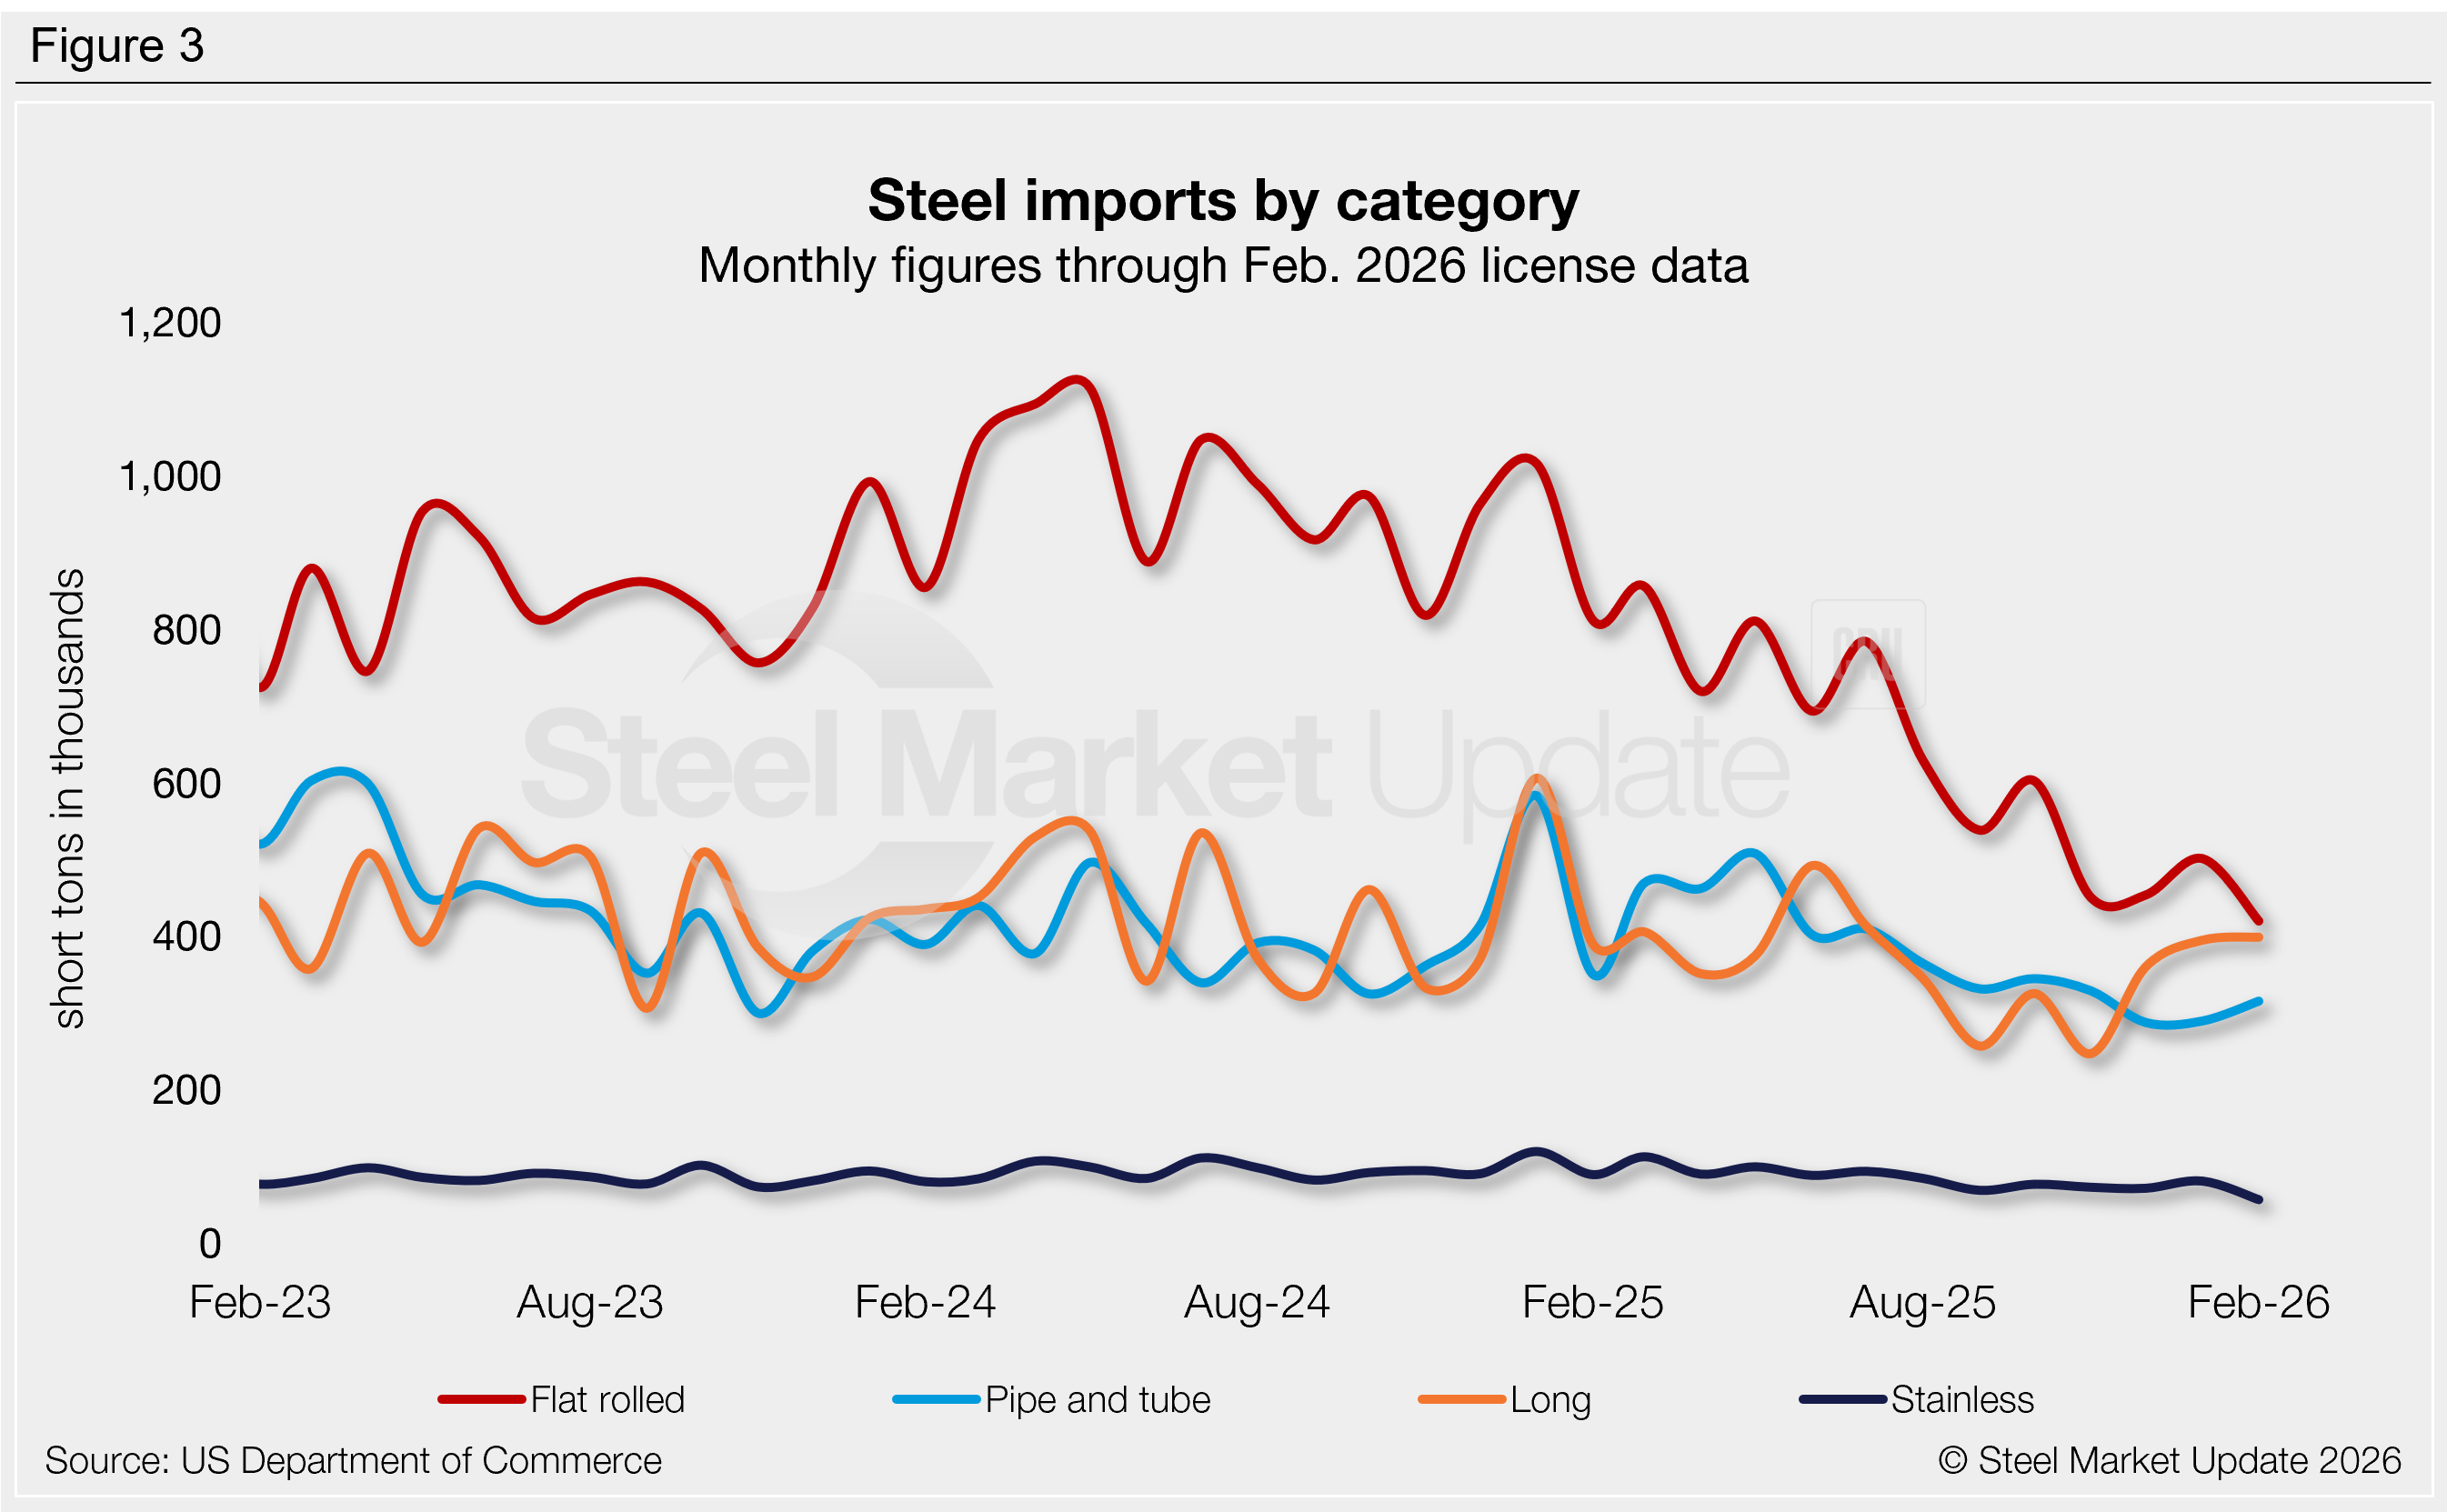
Figure 3 shows monthly imports of popular steel product categories. Notable shifts include:
- Flat-rolled imports recovered 10% m/m in January st but remain historically weak, just 51,000 st higher than November’s multi-year low of (the lowest seen in our limited seven-year data history). February licenses are down 16% m/m, potentially falling to a new low.
- Imports of long products increased 10% in January to a six-month high. February license data is up another 1%.
- Pipe and tube imports inched up 1% in January, previously at the lowest monthly rate seen since early 2021. February licenses up another 9%.
- Imports of stainless products increased 13% m/m January. February licenses are down 30%, potentially a five-year low.
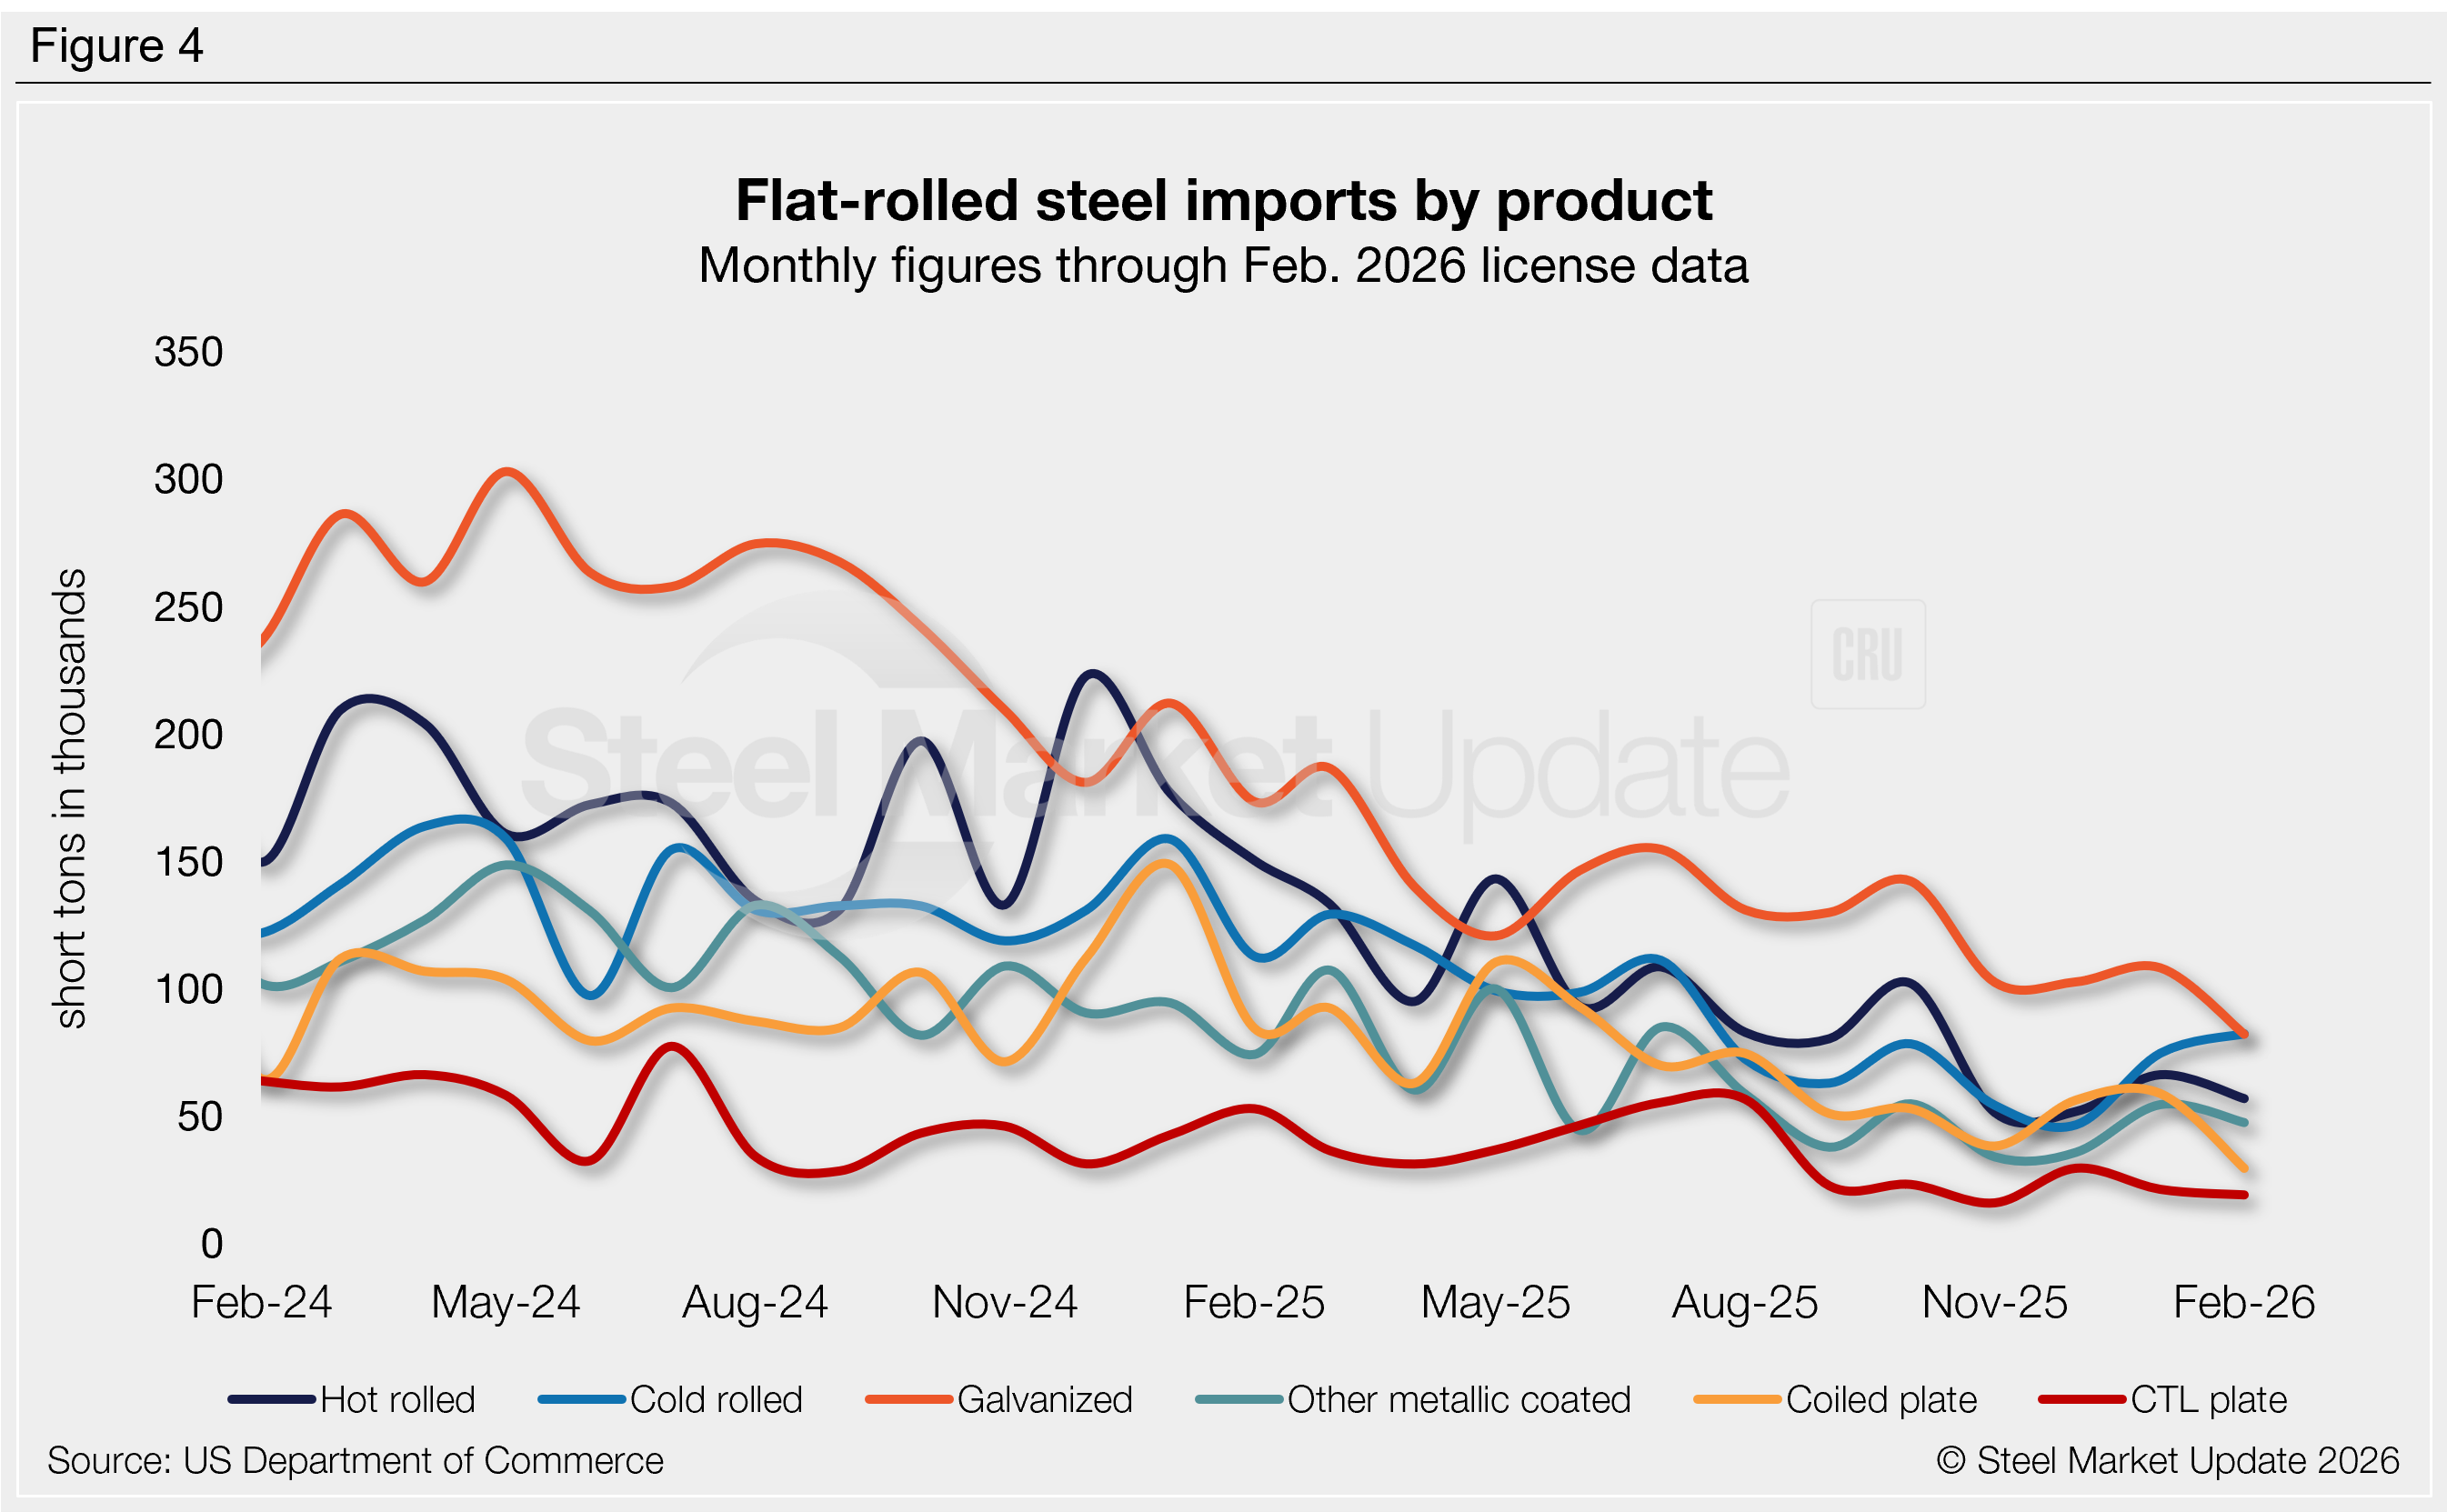
Flat-rolled imports
Figure 4 tracks flat-rolled imports for six popular sheet products. January trade increased for most products, while February figures are mostly down. Key highlights:
- Hot-rolled coil imports rebounded 28% in January, February licenses show a potential 14% decline, currently just 5,000 st above the multi-year low set last November.
- Imports of cold-rolled coil jumped 61% m/m in January, recovering from a multi-year low. February licenses are up another 10% to a seven-month high.
- Galvanized imports increased 5% in January, marginally higher than the multi-year low seen last November. February licenses are back down 24% m/m to a potential 15-year low.
- Other-metallic coated (mostly Galvalume) imports recovered 52% m/m in January. February licenses are potentially back down 13%.
- Imports of coiled plate increased 5% m/m in January to a five-month high. February licenses are back down 50%, potentially the lowest rate seen in our 17-year data history.
- Cut-to-length (CTL) plate imports slipped 28% m/m in January and are potentially down another 10% in February, marginally above the multi-year low set last November.