

Market Data

March 18, 2026
Apparent steel supply inched up in January
Written by Brett Linton
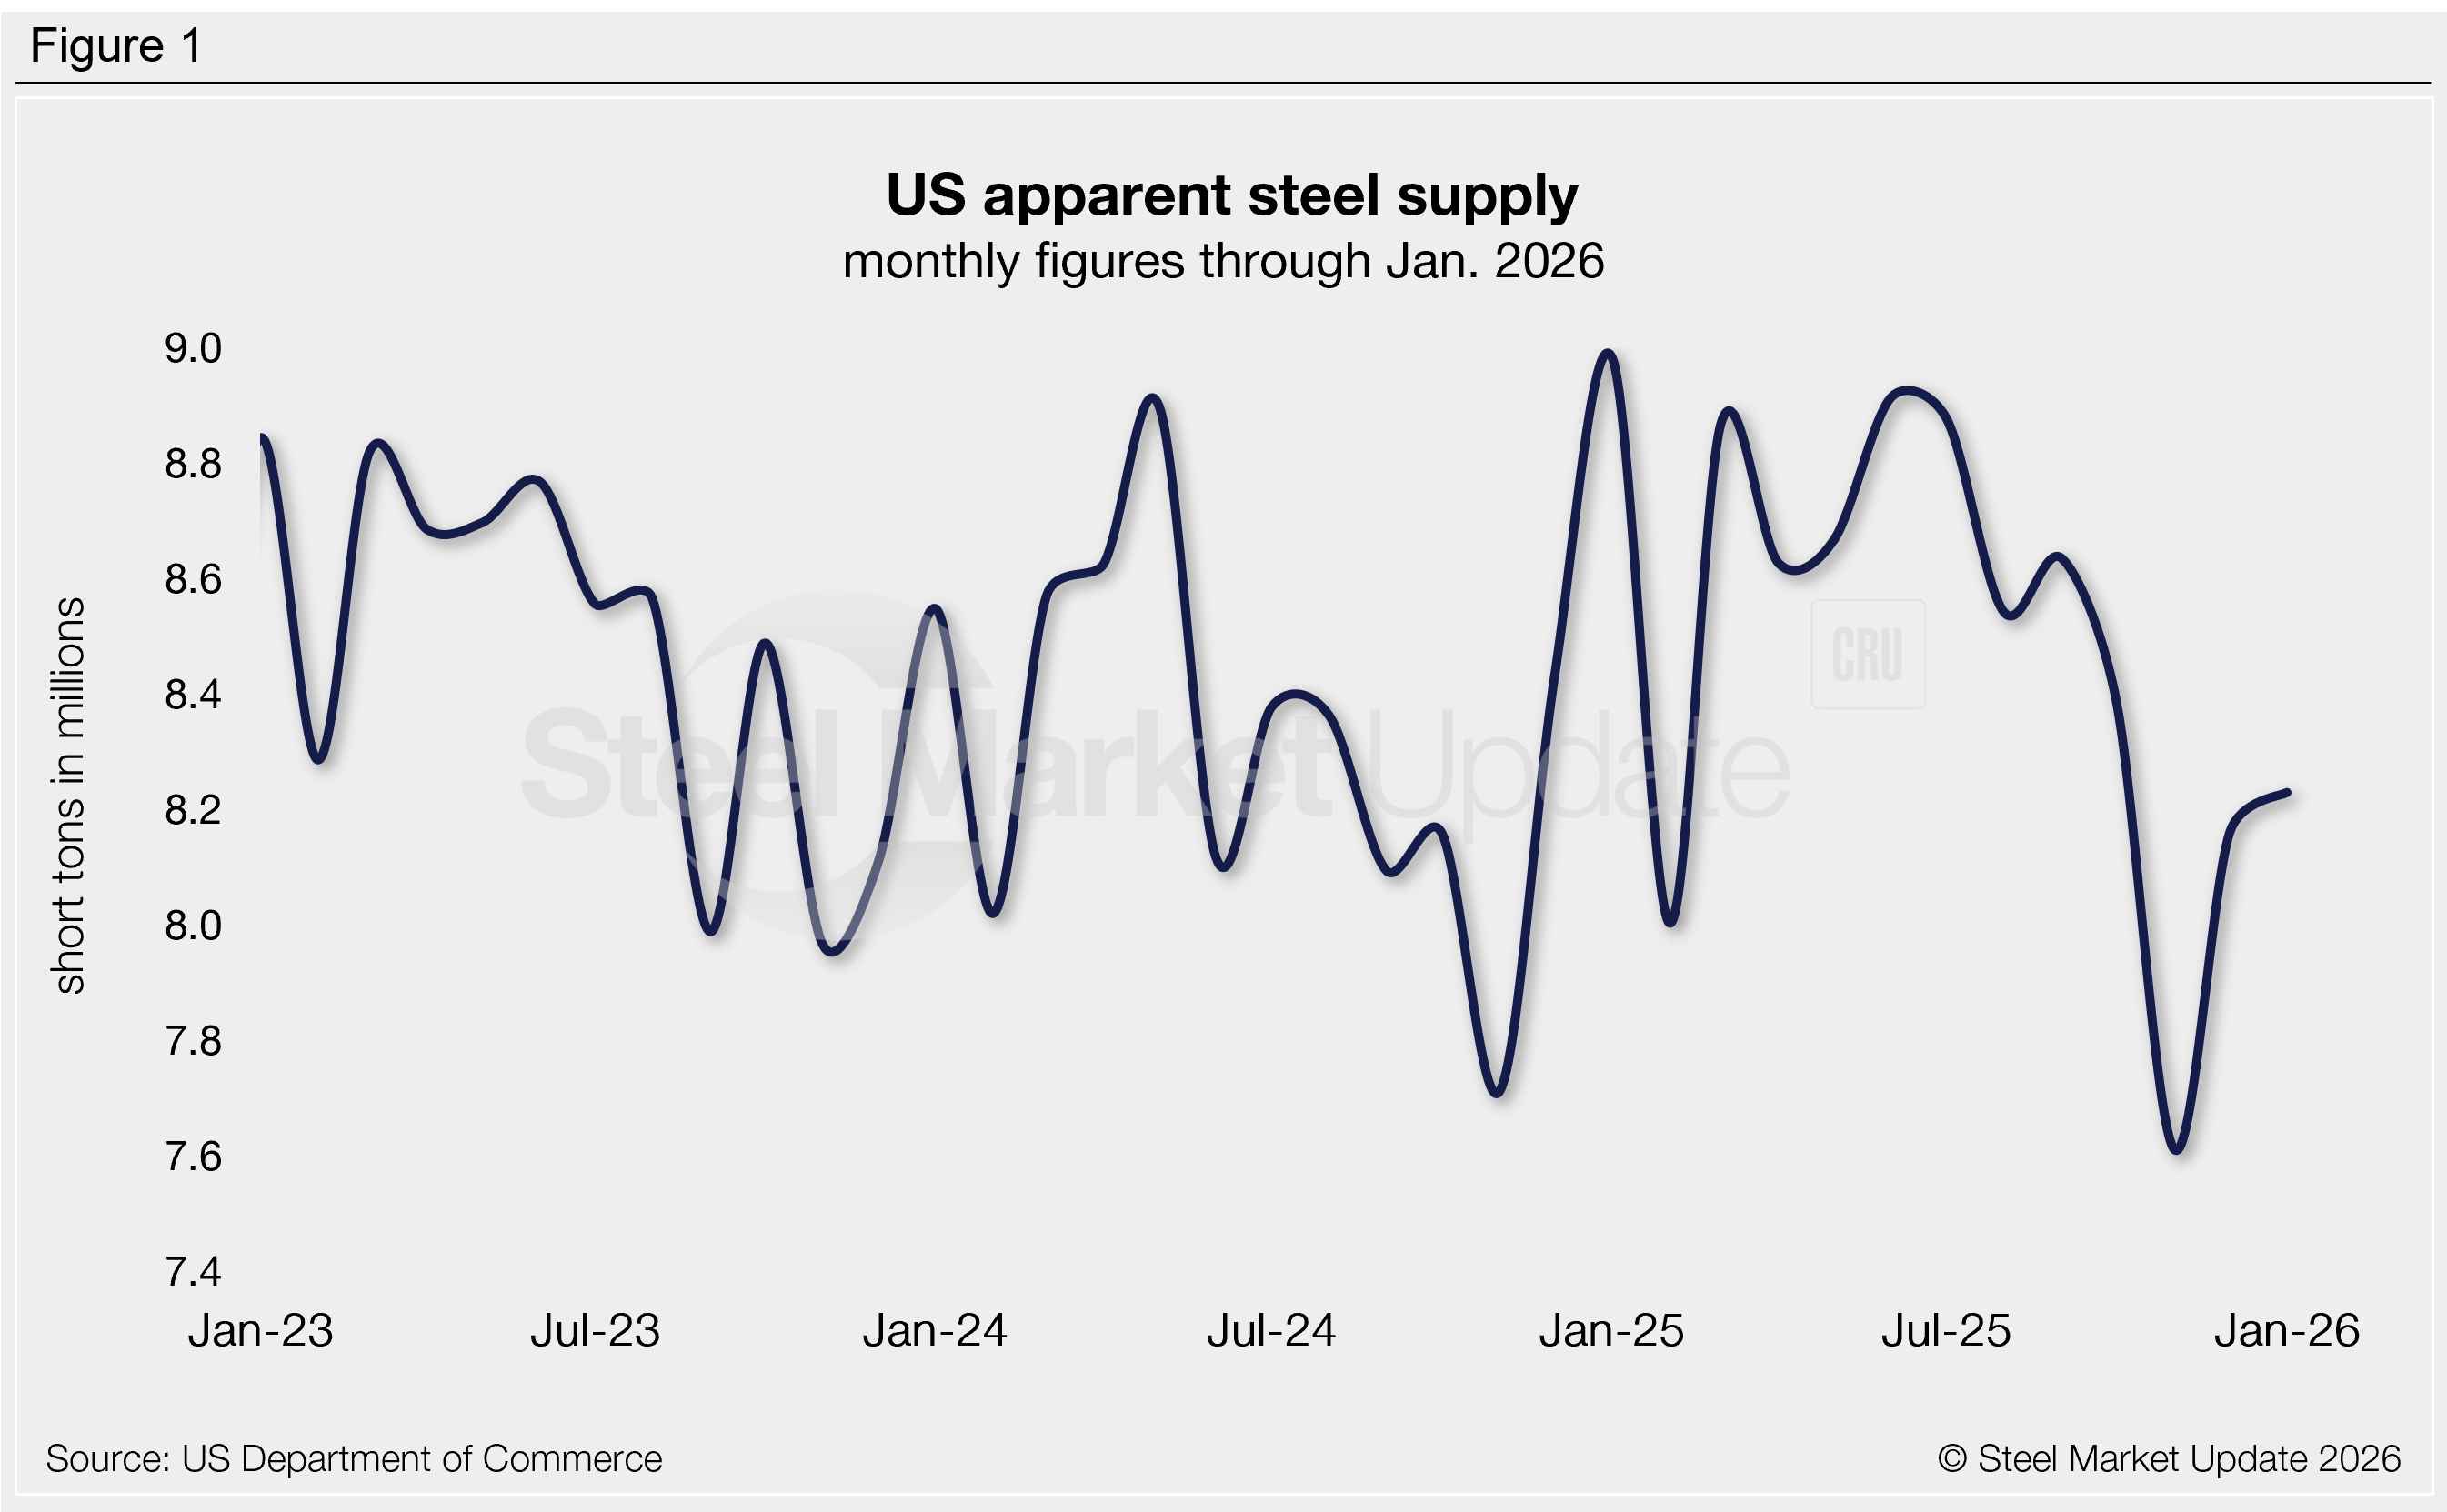
The volume of finished steel that entered the US market increased 1% from December to January, according to SMU’s analysis of recently released US Department of Commerce and American Iron and Steel Institute (AISI) data. Although up month over month (m/m), January supply remains on the low side compared to recent years, just 8% higher than the near five-year low set two months prior.
This apparent steel supply measure is calculated by combining domestic mill shipments and finished US steel imports, then subtracting total US exports.
January supply increased 70,000 short tons (st) from December to 8.23 million st. This growth was attributed to a rise in both domestic shipments and finished imports, most of which was negated by an increase in exports.
Prior to last November, supply had fluctuated within a relatively stable range for over three years, averaging 8.45 million st per month in that time (Figure 1). For comparison, the highest supply rate in our 15-year data history was 10.90 million st (2014) and the lowest was 6.52 million st (2020).
Trends
To better highlight trends, supply can be calculated on a three-month moving average (3MMA) basis to smooth out monthly fluctuations.
The January 3MMA declined for the sixth-consecutive month to 8.00 million st, a 14-month low (Figure 2). This rate was marginally above the four-year low of 7.99 million st set in November 2024.
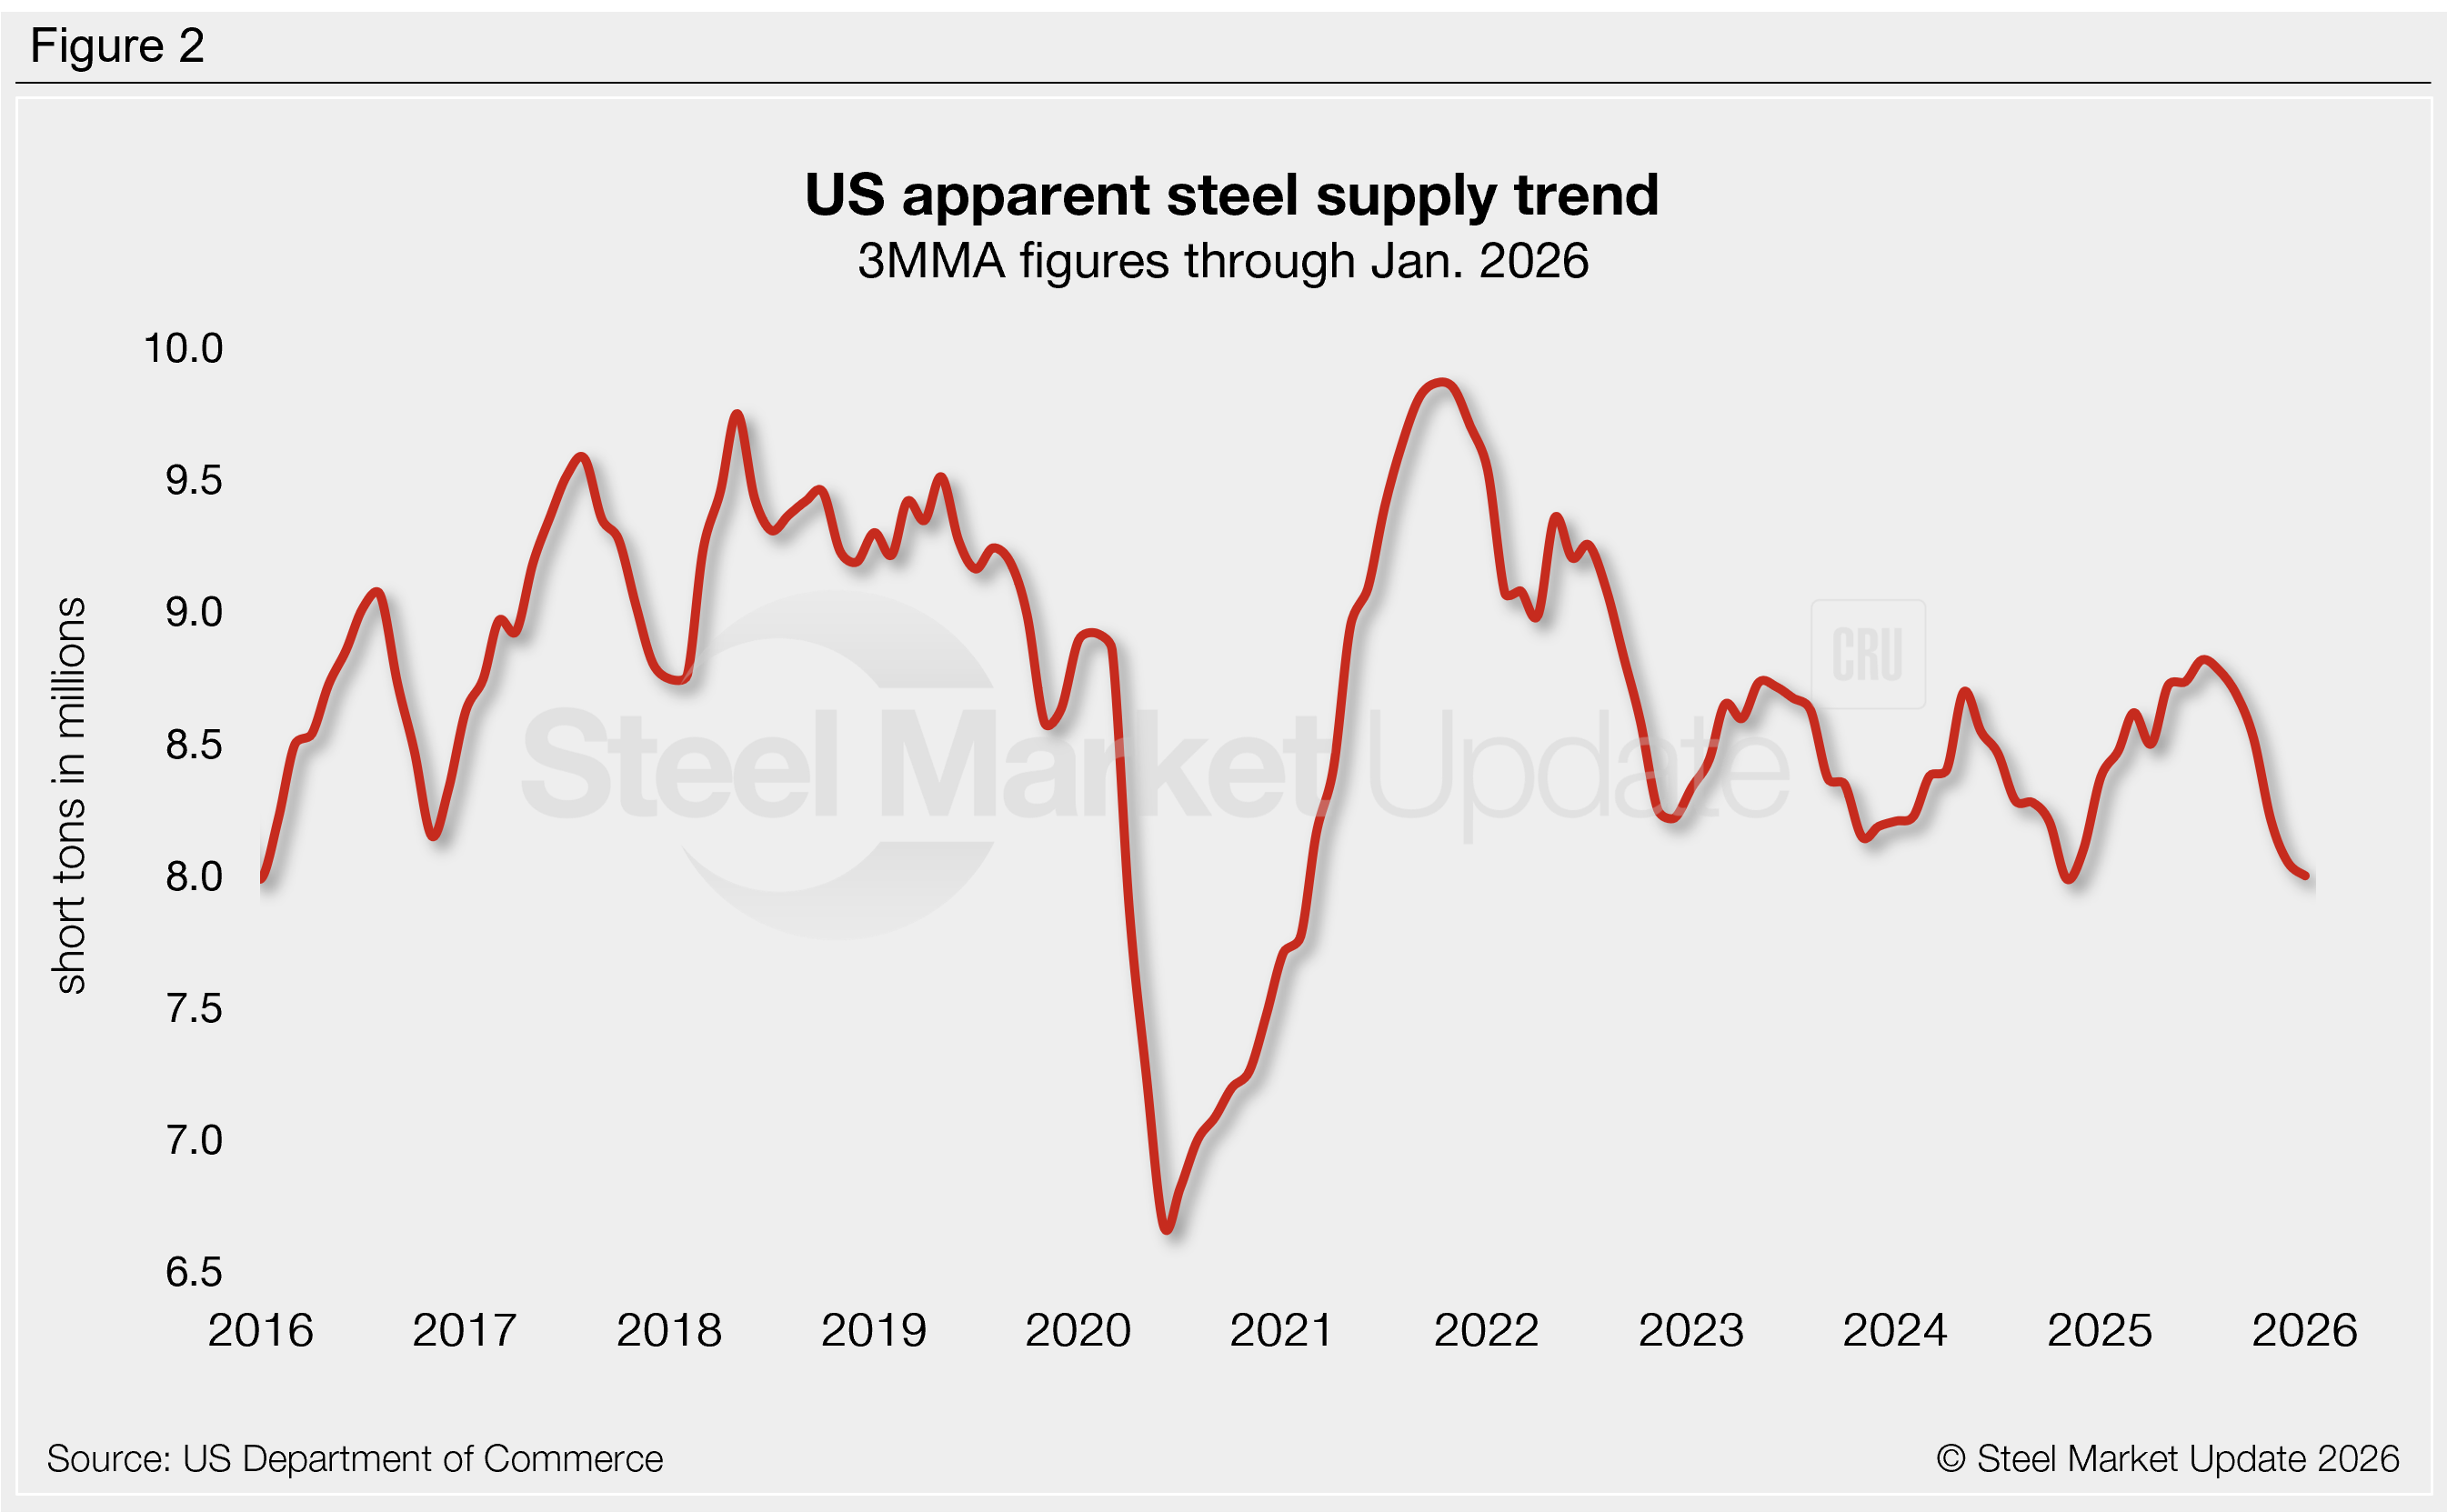
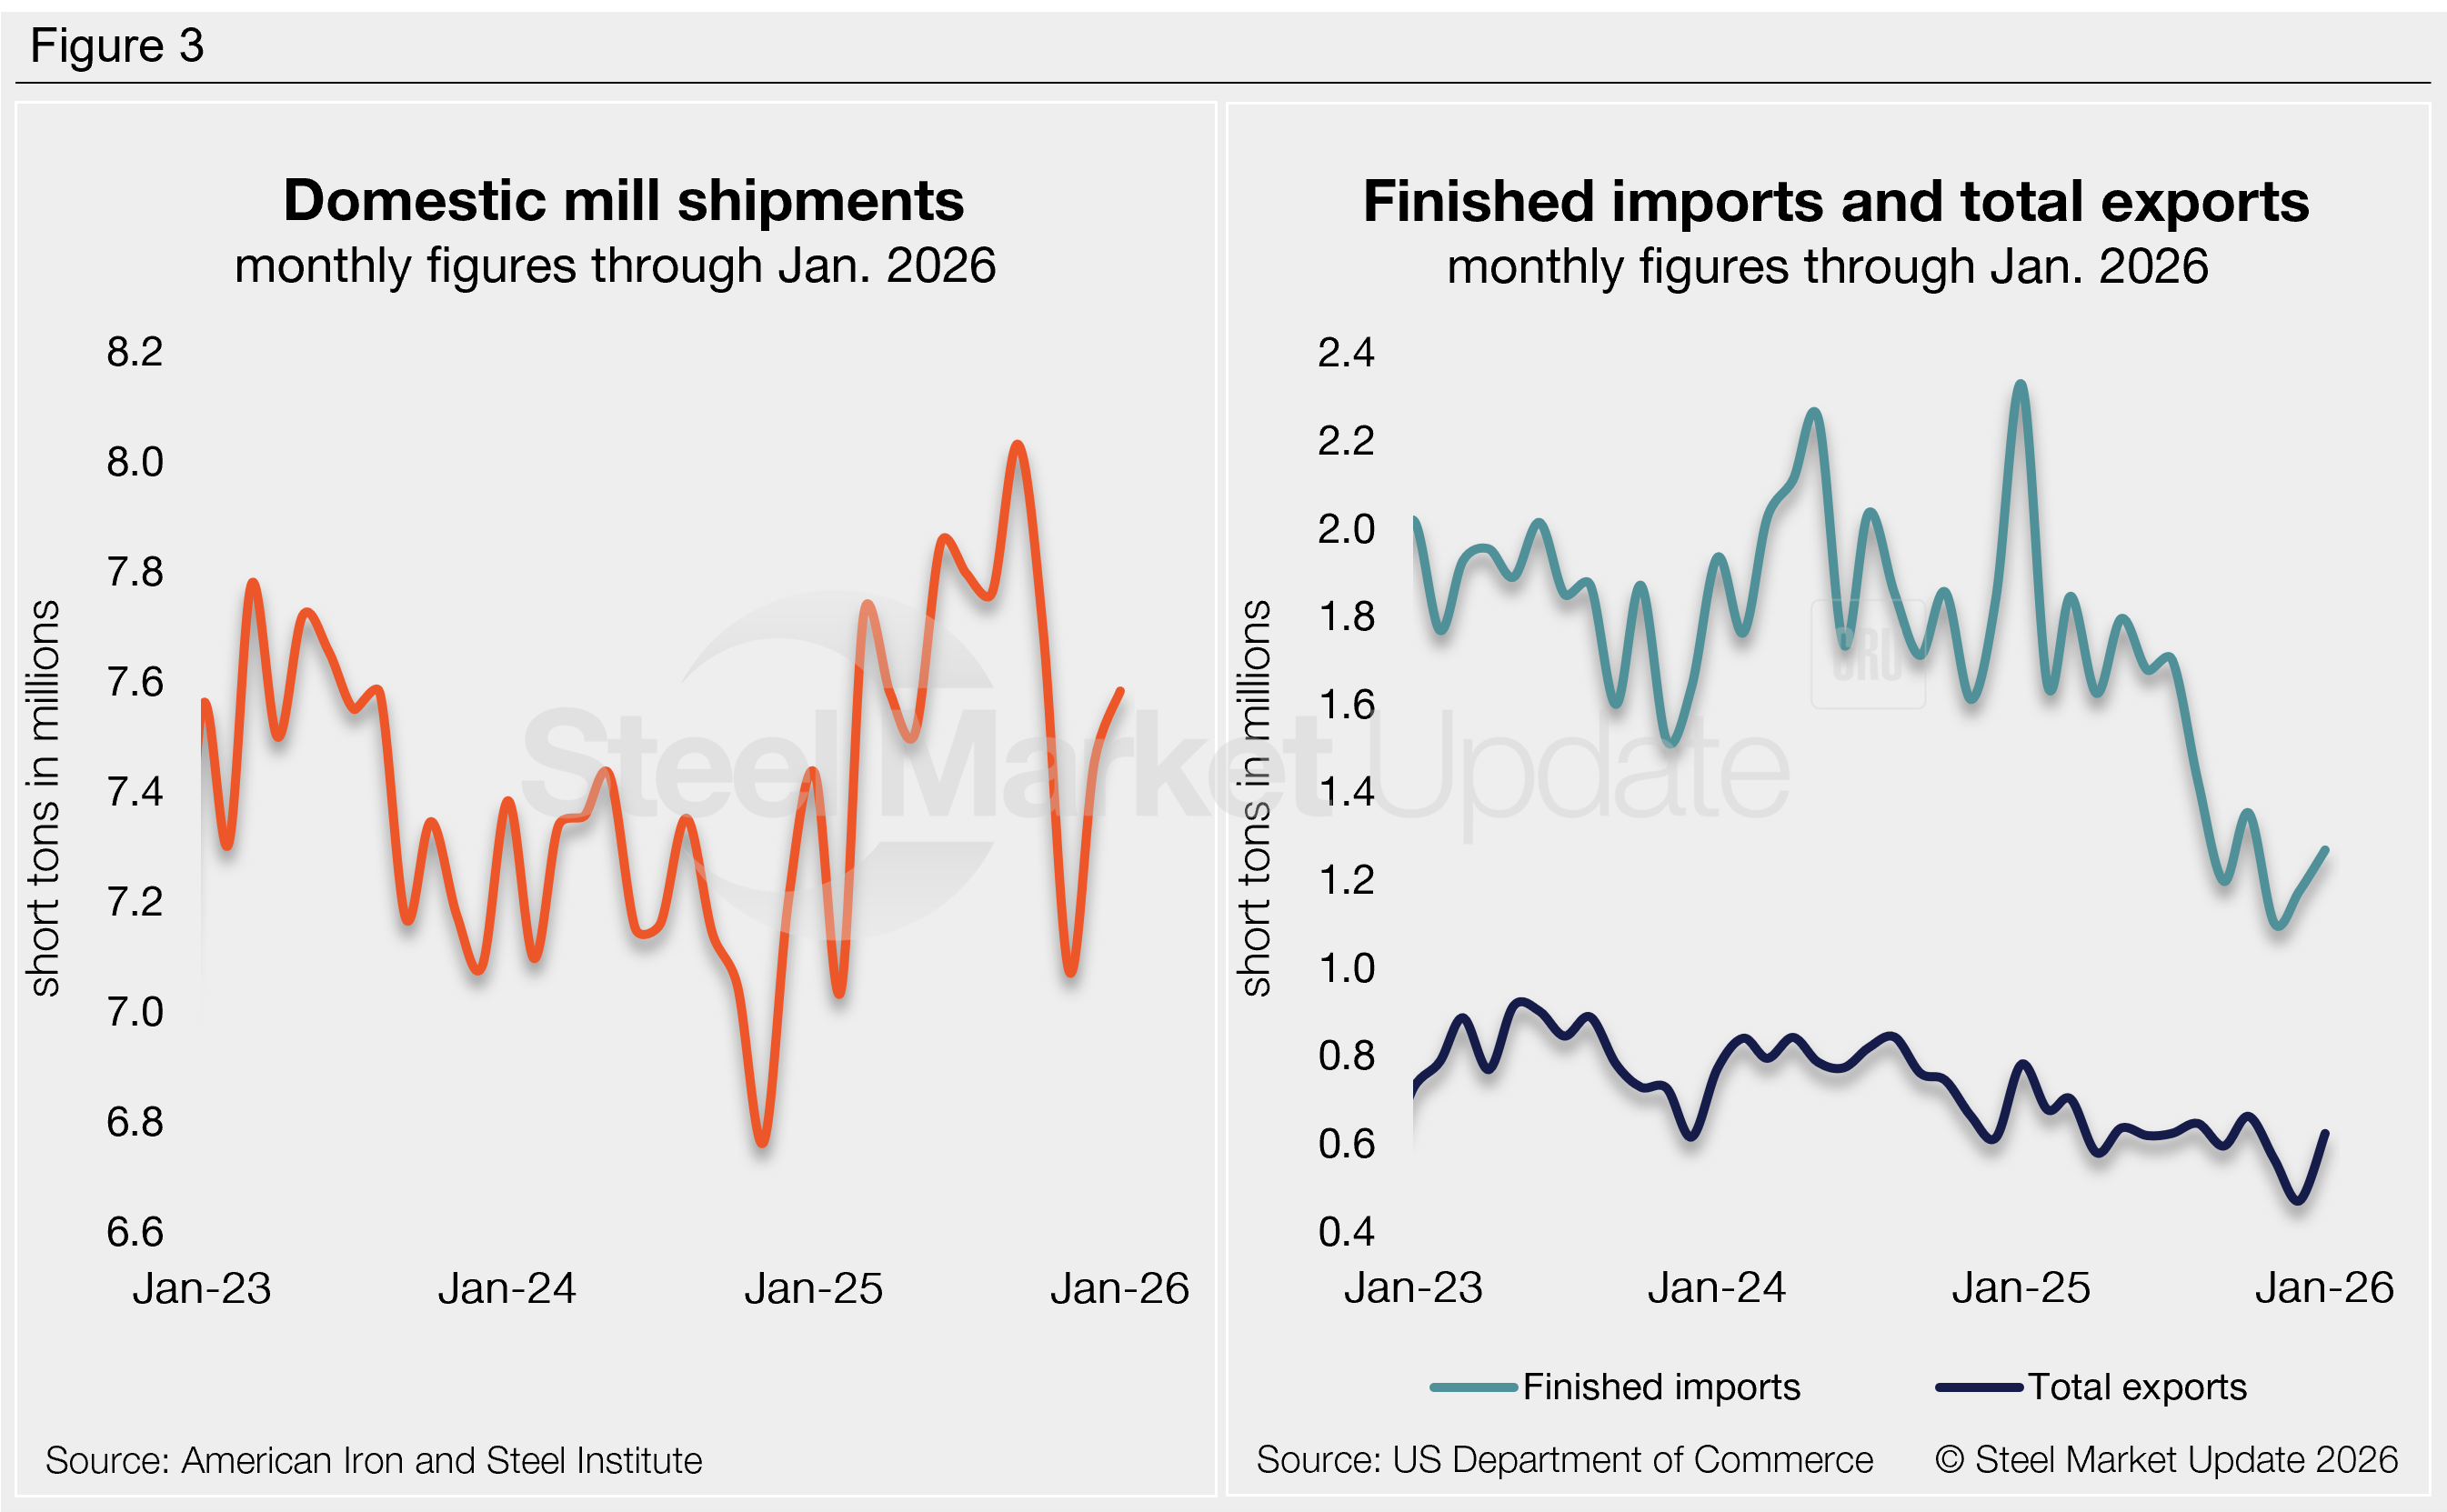
Figure 3 shows the individual components of apparent supply and their changes from December to January:
- Domestic shipments recovered 129,000 st m/m (2%) to 7.58 million st, accounting for 92% of total supply.
- Finished steel imports increased 94,000 st (8%) to 1.27 million st. The latest license data shows a potential 6% decline in February.
- Steel exports jumped 153,000 st (33%) to 623,000 st, previously at a five-year low.
- Net imports (finished imports minus exports) made up 8% of January’s supply. This is low in comparison to recent years (it averaged 11% in 2025 and 12% over the past three years).
To see an interactive graphic of our apparent steel supply history, click here. If you need any assistance logging into or navigating the website, contact us at smu@crugroup.com.


