Analysis

March 18, 2026
February service center shipments and inventories report
Written by David Schollaert
Flat rolled = 52.2 shipping days of supply
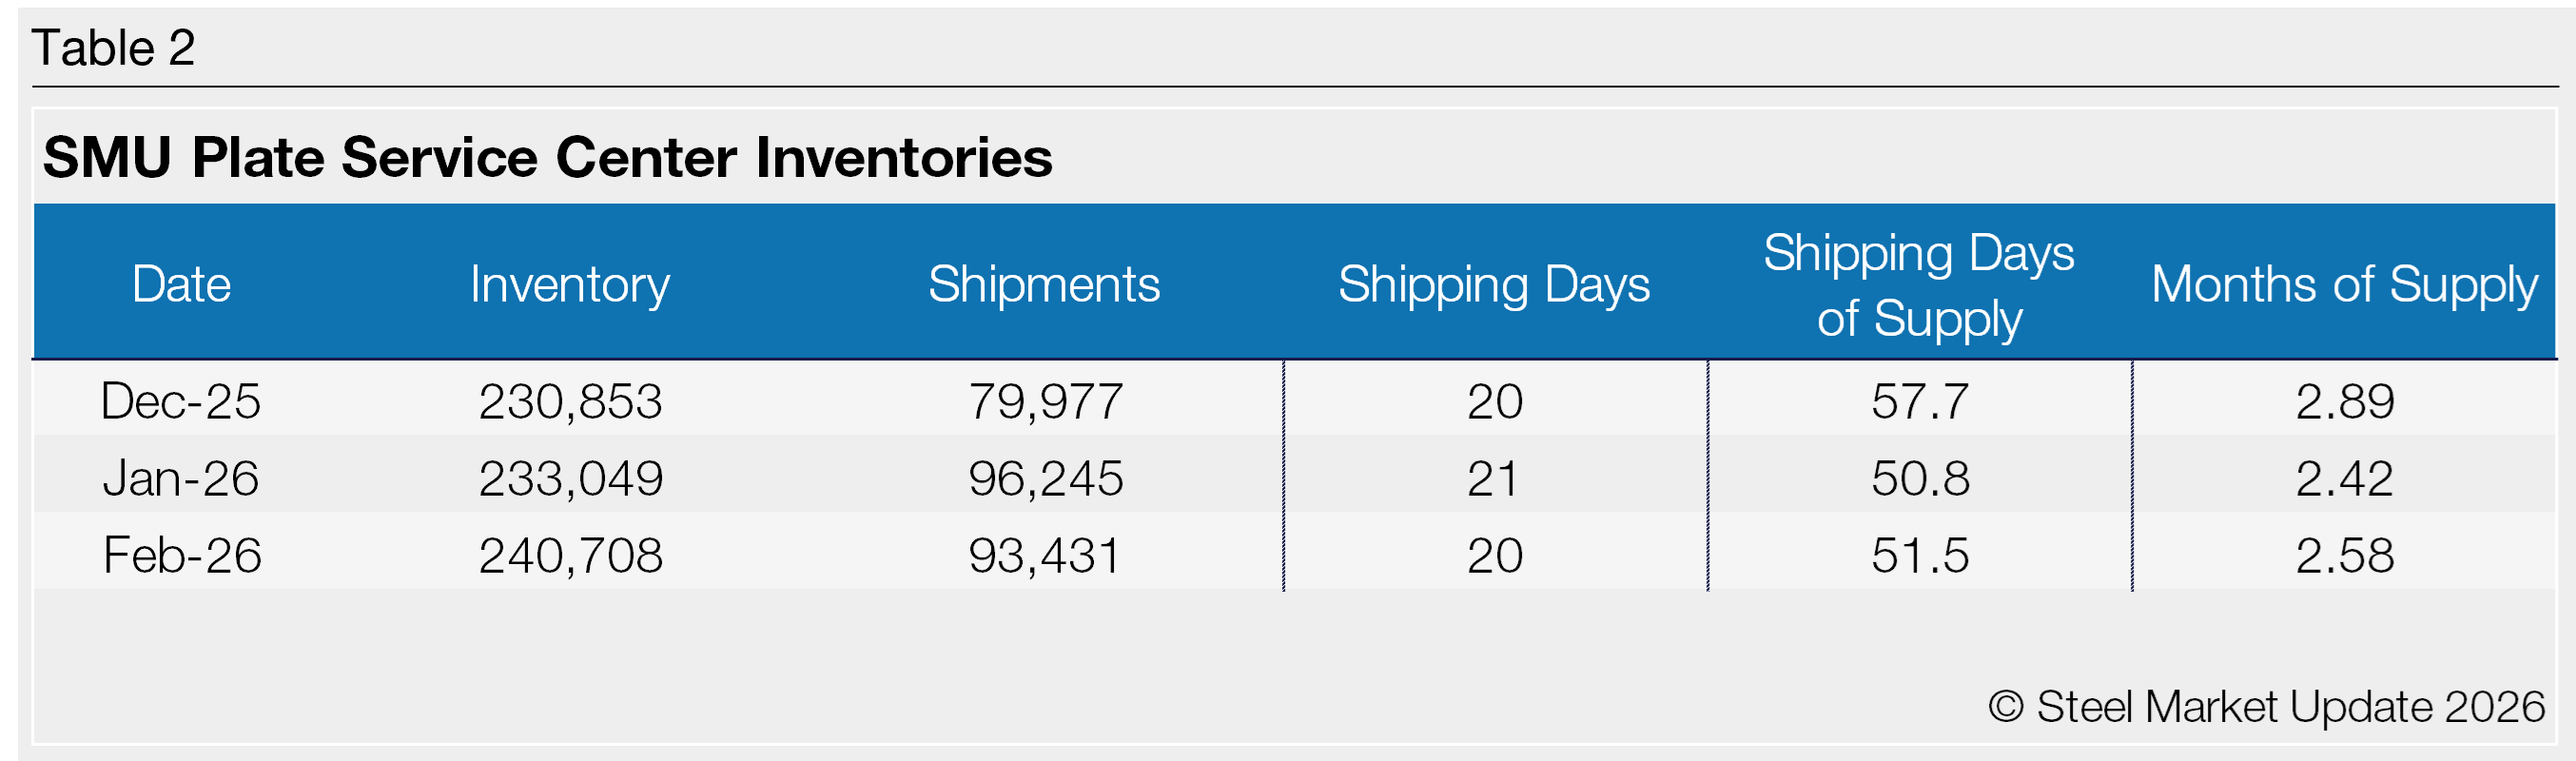
Plate = 51.5 shipping days of supply
Flat rolled
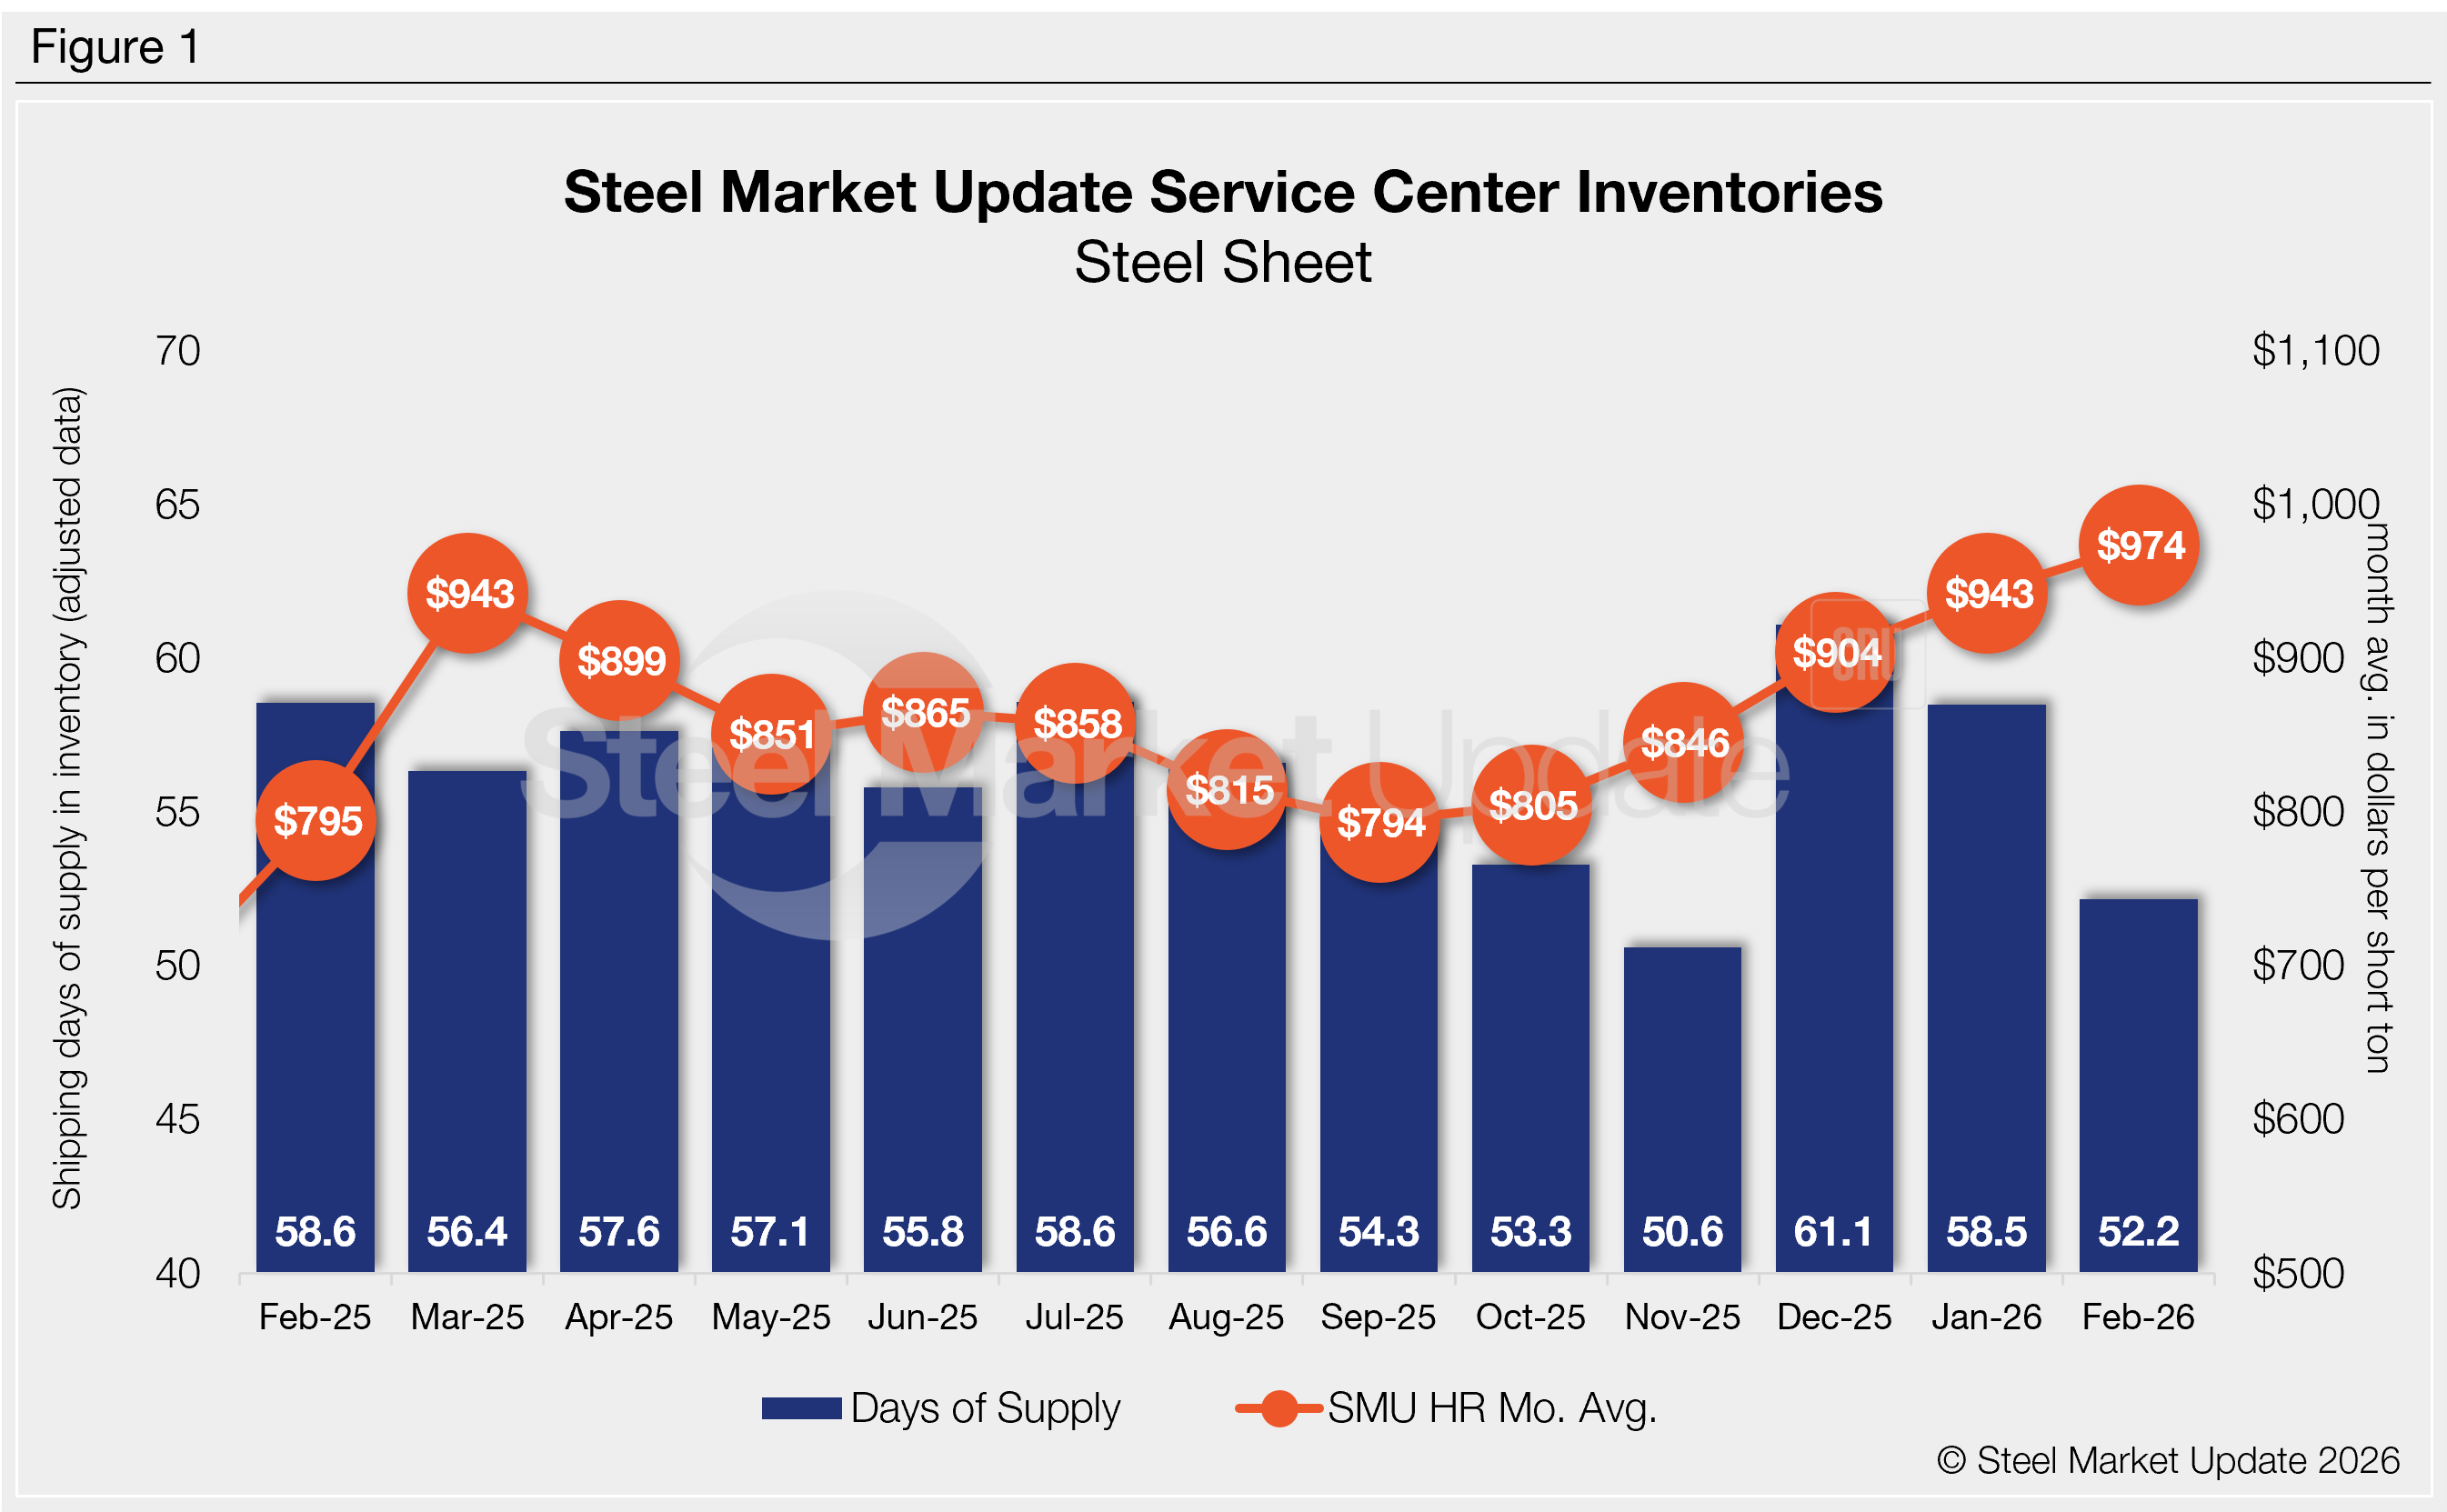
US service centers’ flat-rolled steel supply declined for a second consecutive month in February, with shipping days of supply slipping to 52.2 on an adjusted basis, according to SMU data.
That figure marks a significant decline from 58.6 shipping days in February 2025. It also marks the lowest February total since 2020.
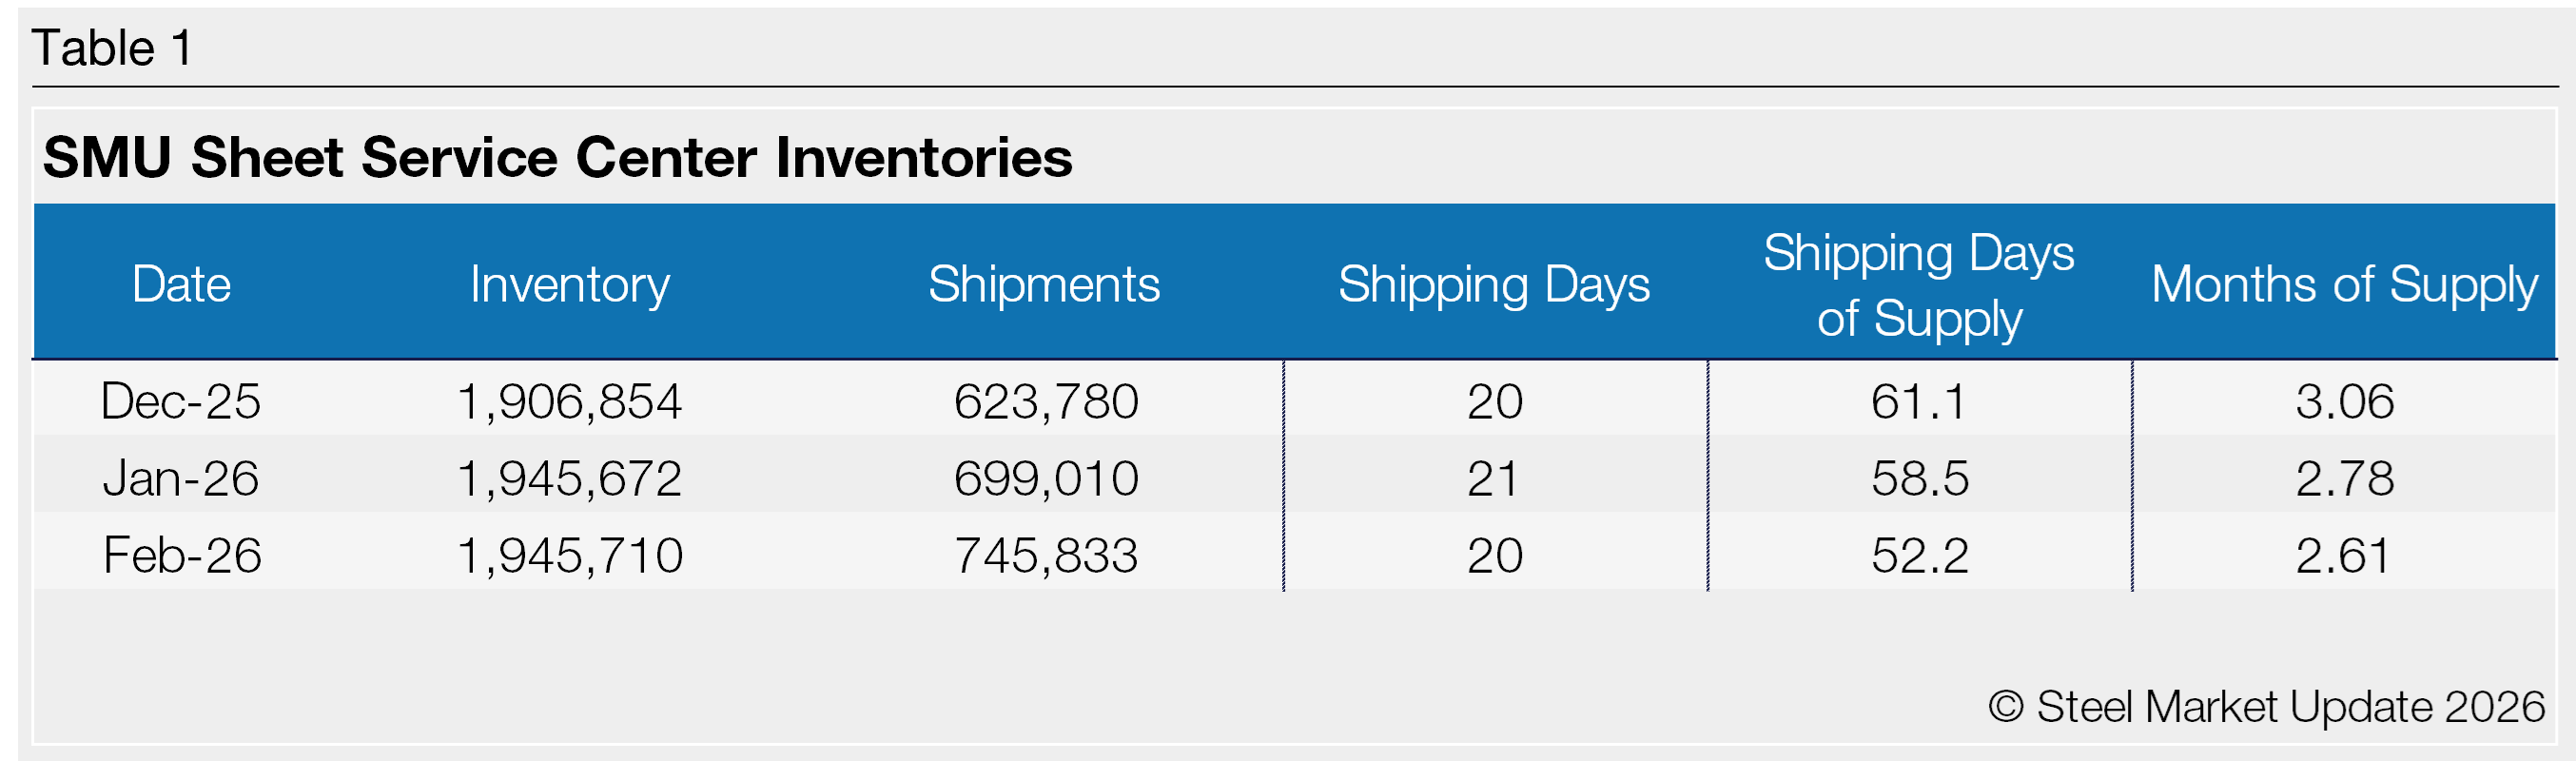
Flat roll inventories represented 2.61 months of supply in February, down from 2.78 in January and down from 2.93 months in February 2025. The month-on-month (m/m) decrease in inventories came largely due to an increase in shipments.
Shipments in February were up 6.7% m/m following a 12.1% jump from December to January. The higher shipping pace came despite a decline in total shipping days and amid a continuing upturn in prices.
Increased shipments track with market participants’ characterization of demand as flat or up. Case in point: SMU’s mid-February survey found that 37% of service centers were releasing the same amount of steel compared to one year ago, while roughly the same percentage were releasing more steel. Only 26% reported releasing less vs. the same time a year earlier. (We find that mid-month survey figures can be a useful early indicator of where full-month service center inventory data will land.)
SMU also recorded an increase of 3.2% m/m in on-order volumes. This likely reflects increased buying heading into the busier Q2 period.
At the end of February, service centers’ shipping days of supply on order were down 7.9% m/m, impacted by the daily shipping rate rise. The dynamic underscores how lean inventories remain.
The latest SMU survey from March 6 showed that lead times remained extended. The result corresponded well with SMU’s February survey, which saw, on average, 11% of service centers building inventory. Eighty-three percent maintained material, with the remaining 6% reducing inventory.
Plate
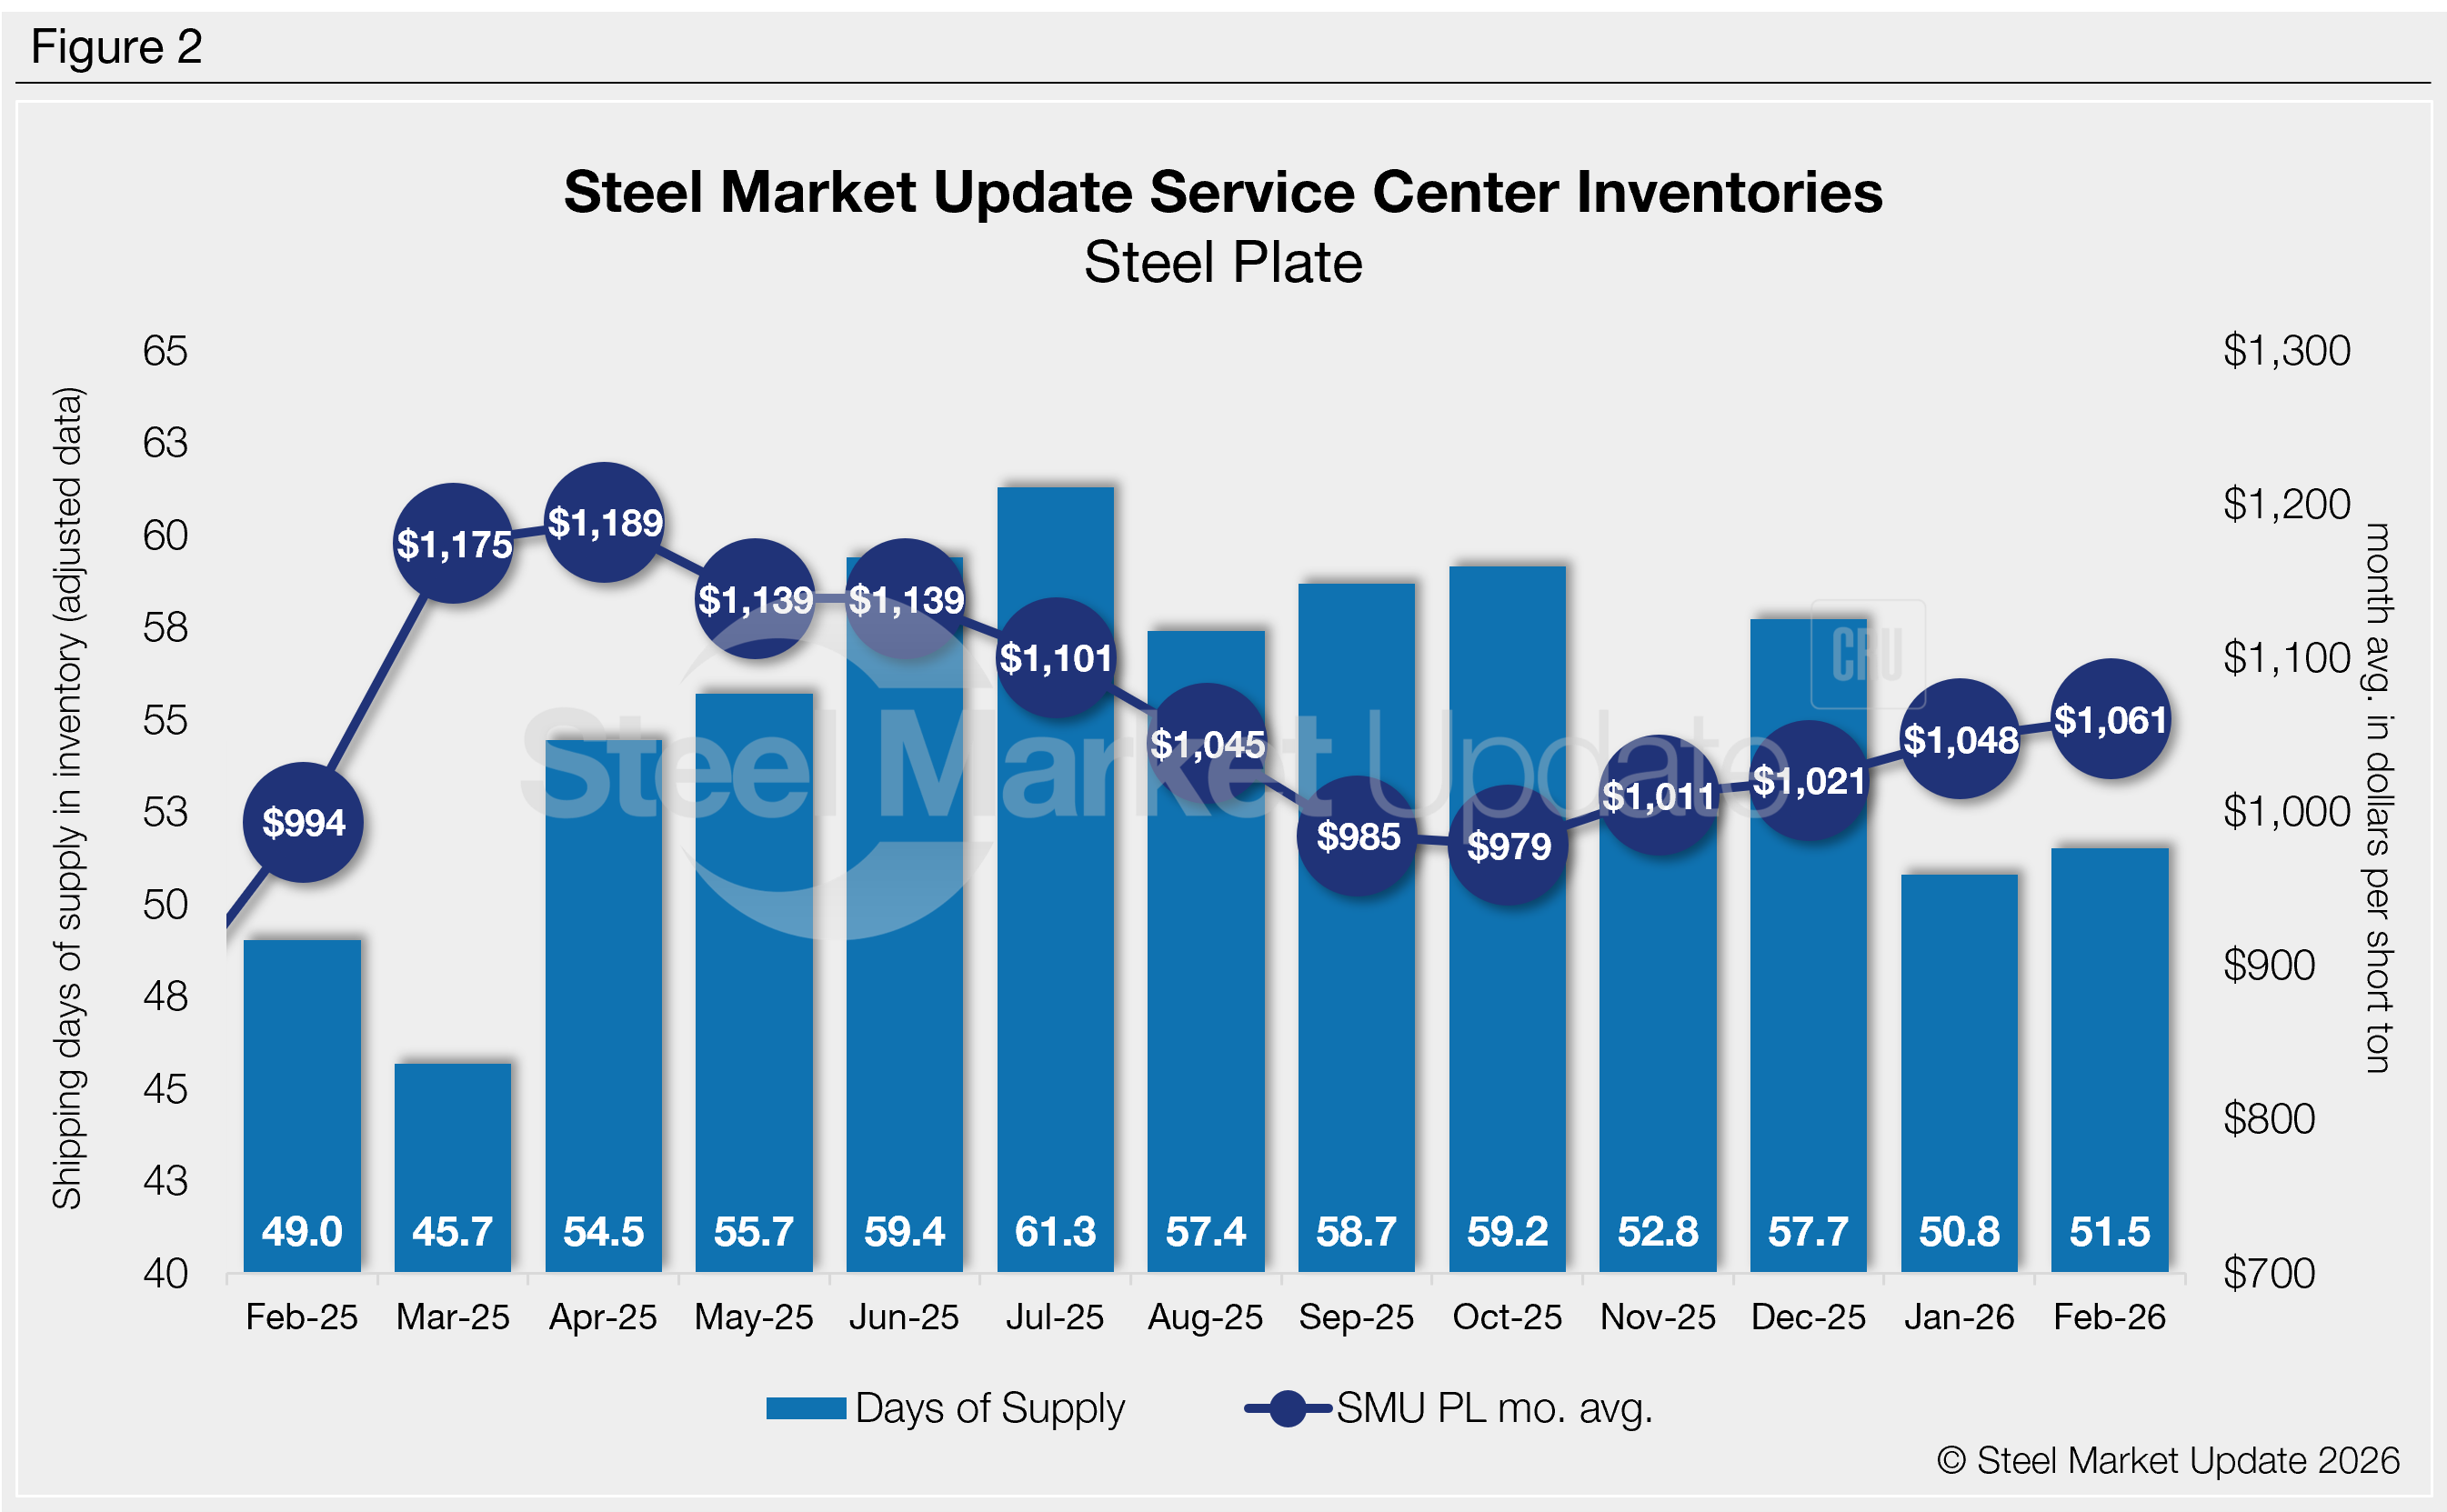
US service center plate inventories were up marginally in February, supported by a slight decline (-2.9%) in shipments, according to SMU data.
At the end of February, service centers held 51.5 shipping days of supply, up from 50.8 in January. Plate supply in February represented 2.58 months of supply, up from 2.42 months of supply in January.
February plate supply is also up vs. year-ago levels, when service centers carried 49.0 shipping days of supply, or 2.45 months of supply. The latest inventory levels are low, suggesting lean levels resulting from uneven demand dynamics continue. Some suggest this dynamic could bump prices up further should order volume increase to balance inventory levels.
Material on order rose in February, up 10.6 m/m, after increasing 3.5% from December to January. The trend was supported by a bump in shipping days of supply on order.
At the end of February, service centers shipping days of supply on order were up 8.6% from January, but down 8.5% from February 2025. Service centers continue to carry a lower volume of inventory because of added domestic capacity, and plate lead times remain normal at 6.5 weeks, up from 6.2 weeks vs. a month prior, according to the latest SMU survey.
But we continue to wonder, when is lean, too lean?
Service center demand has not picked up materially for the better part of the past seven months-plus. But sources continue to report an uptick in special projects. Strong order books in March and into April are being reported, with more sources maintaining a somewhat bullish outlook for 2026.
Mills have been pushing through price increases as the market starts to peek into Q2, though increases have only recently started to stick.