Canada
April 10, 2026
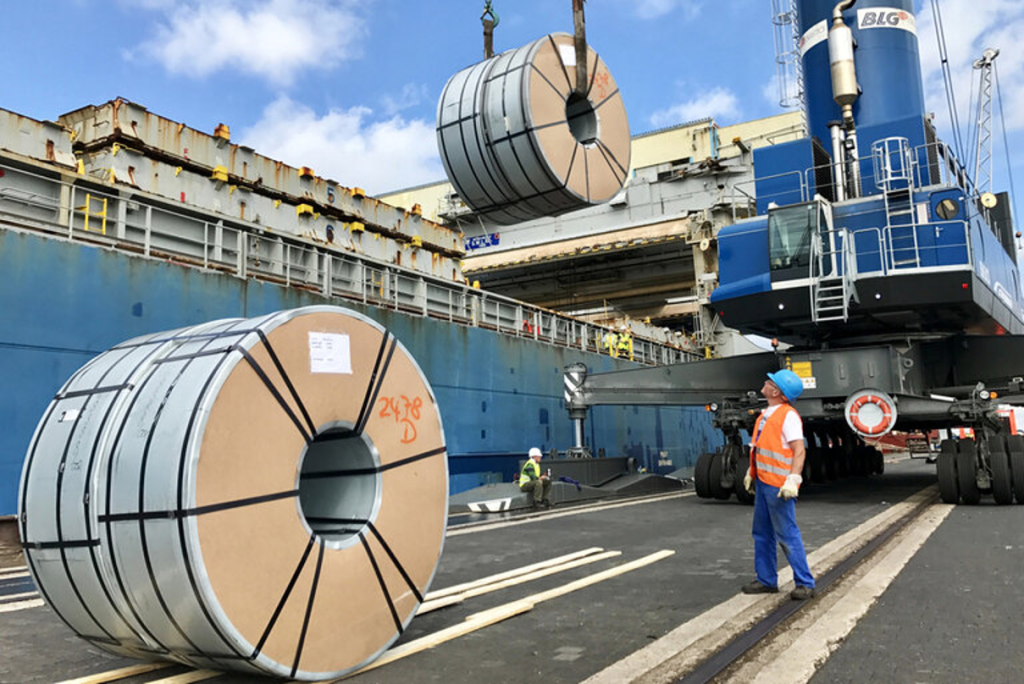
Steel imports inch up in February and March from historic lows
Written by Brett Linton
Steel import volumes marginally increased in February and March but remain historically weak, according to US Commerce Department data.
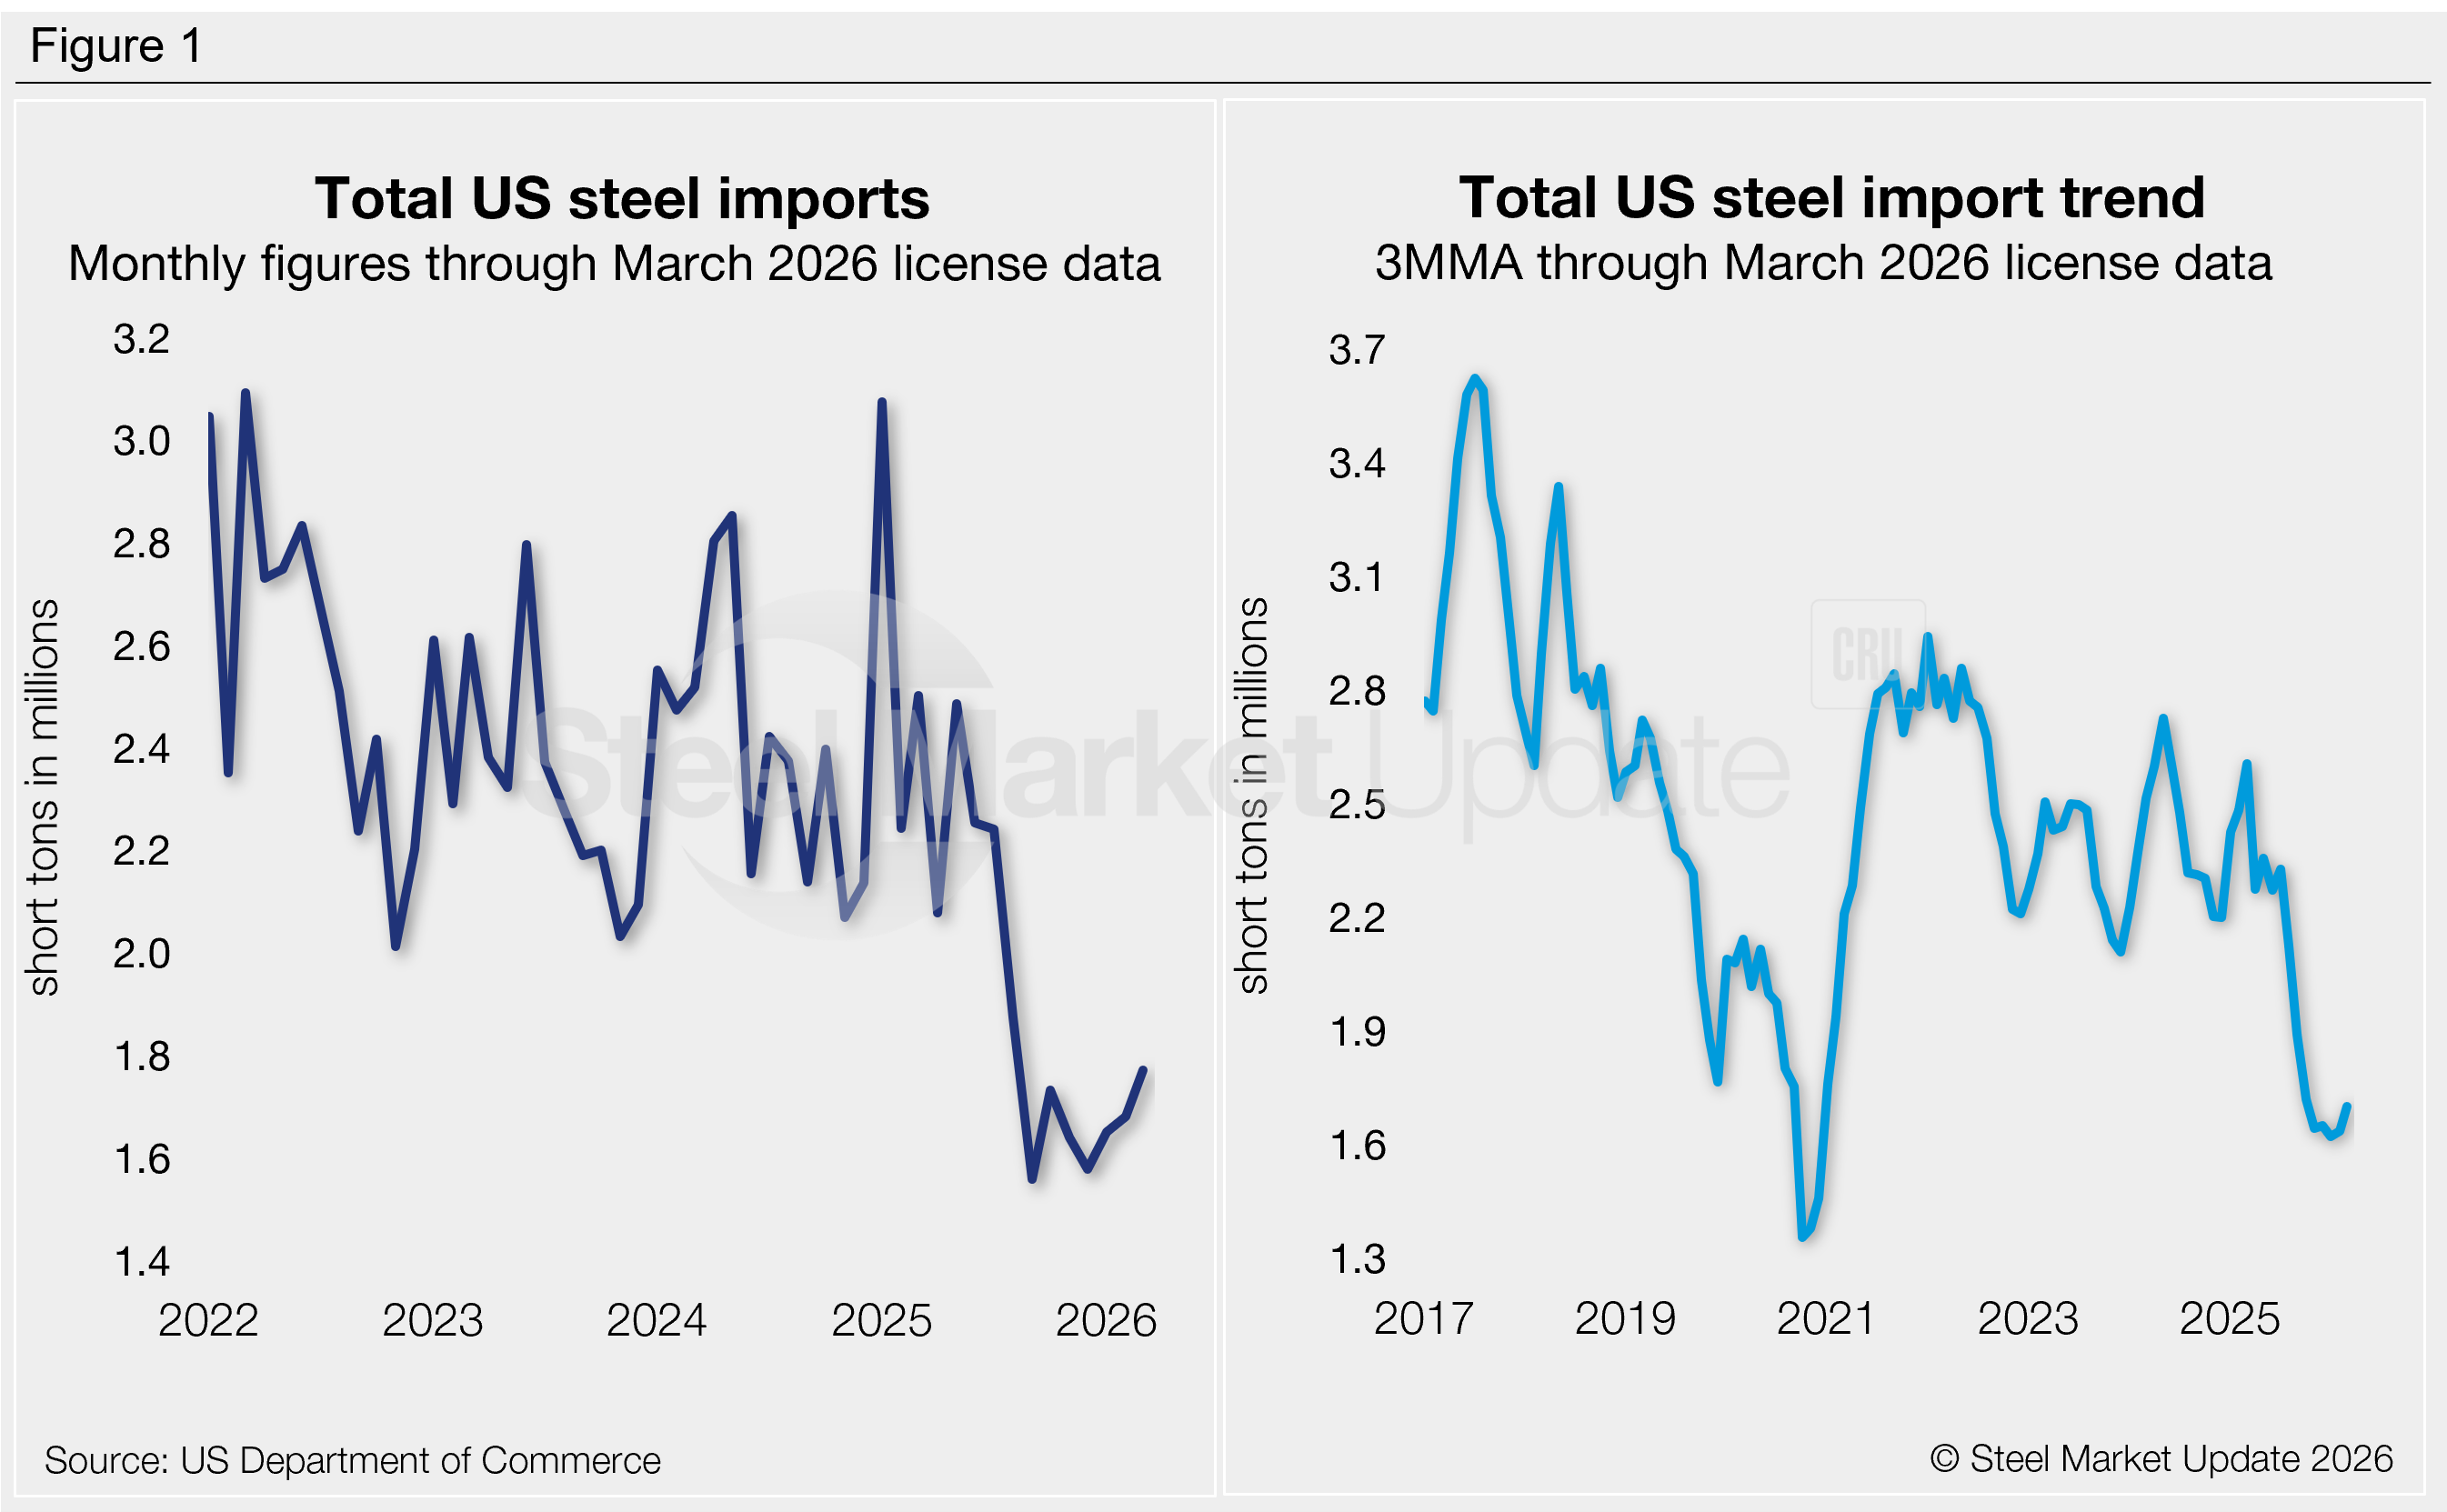
Final February data shows a 2% month-over-month (m/m) recovery, and March license data is up another 5%. Across the last seven months, imports have fallen to some of the lowest volumes recorded in the past five years.
Final February data shows that 1.68 million short tons (st) of steel were imported into the country throughout the month. This is only 121,000 st greater than a nearly five-year low set last September. March license data collected through April 6 currently totals 1.77 million st.
Recall that at the start of 2025, we saw imports briefly surge to a two-and-a-half-year high of 3.08 million st. Volumes moderated throughout the first half of last year, then significantly slowed after July. They have remained muted since (Figure 1, left).
Imports by country
In February, more than two-thirds of the steel that entered the country came from just six countries: South Korea (18%), Brazil (15%), Canada (13%), Mexico (10%), Japan (8%), and Vietnam (4%). Other major suppliers included Turkey, Germany, Romania, Taiwan, India, the United Arab Emirates, Argentina, the Netherlands, and the United Kingdom, each contributing 2-3% of the total. Combined, these 15 countries accounted for 90% of all February imports.
Visit the International Trade Administration’s Steel Import Monitor to explore steel import data by country, category, or specific product.
Import trends
Import data can be analyzed as a three-month moving average (3MMA) to smooth out monthly variations and better highlight trends (Figure 1, right). On this basis, 3MMA imports have generally trended lower since early 2025. The 3MMA inched up in March to a five-month high of 1.70 million st but is still well below most measures seen in the last five years.
Imports by product
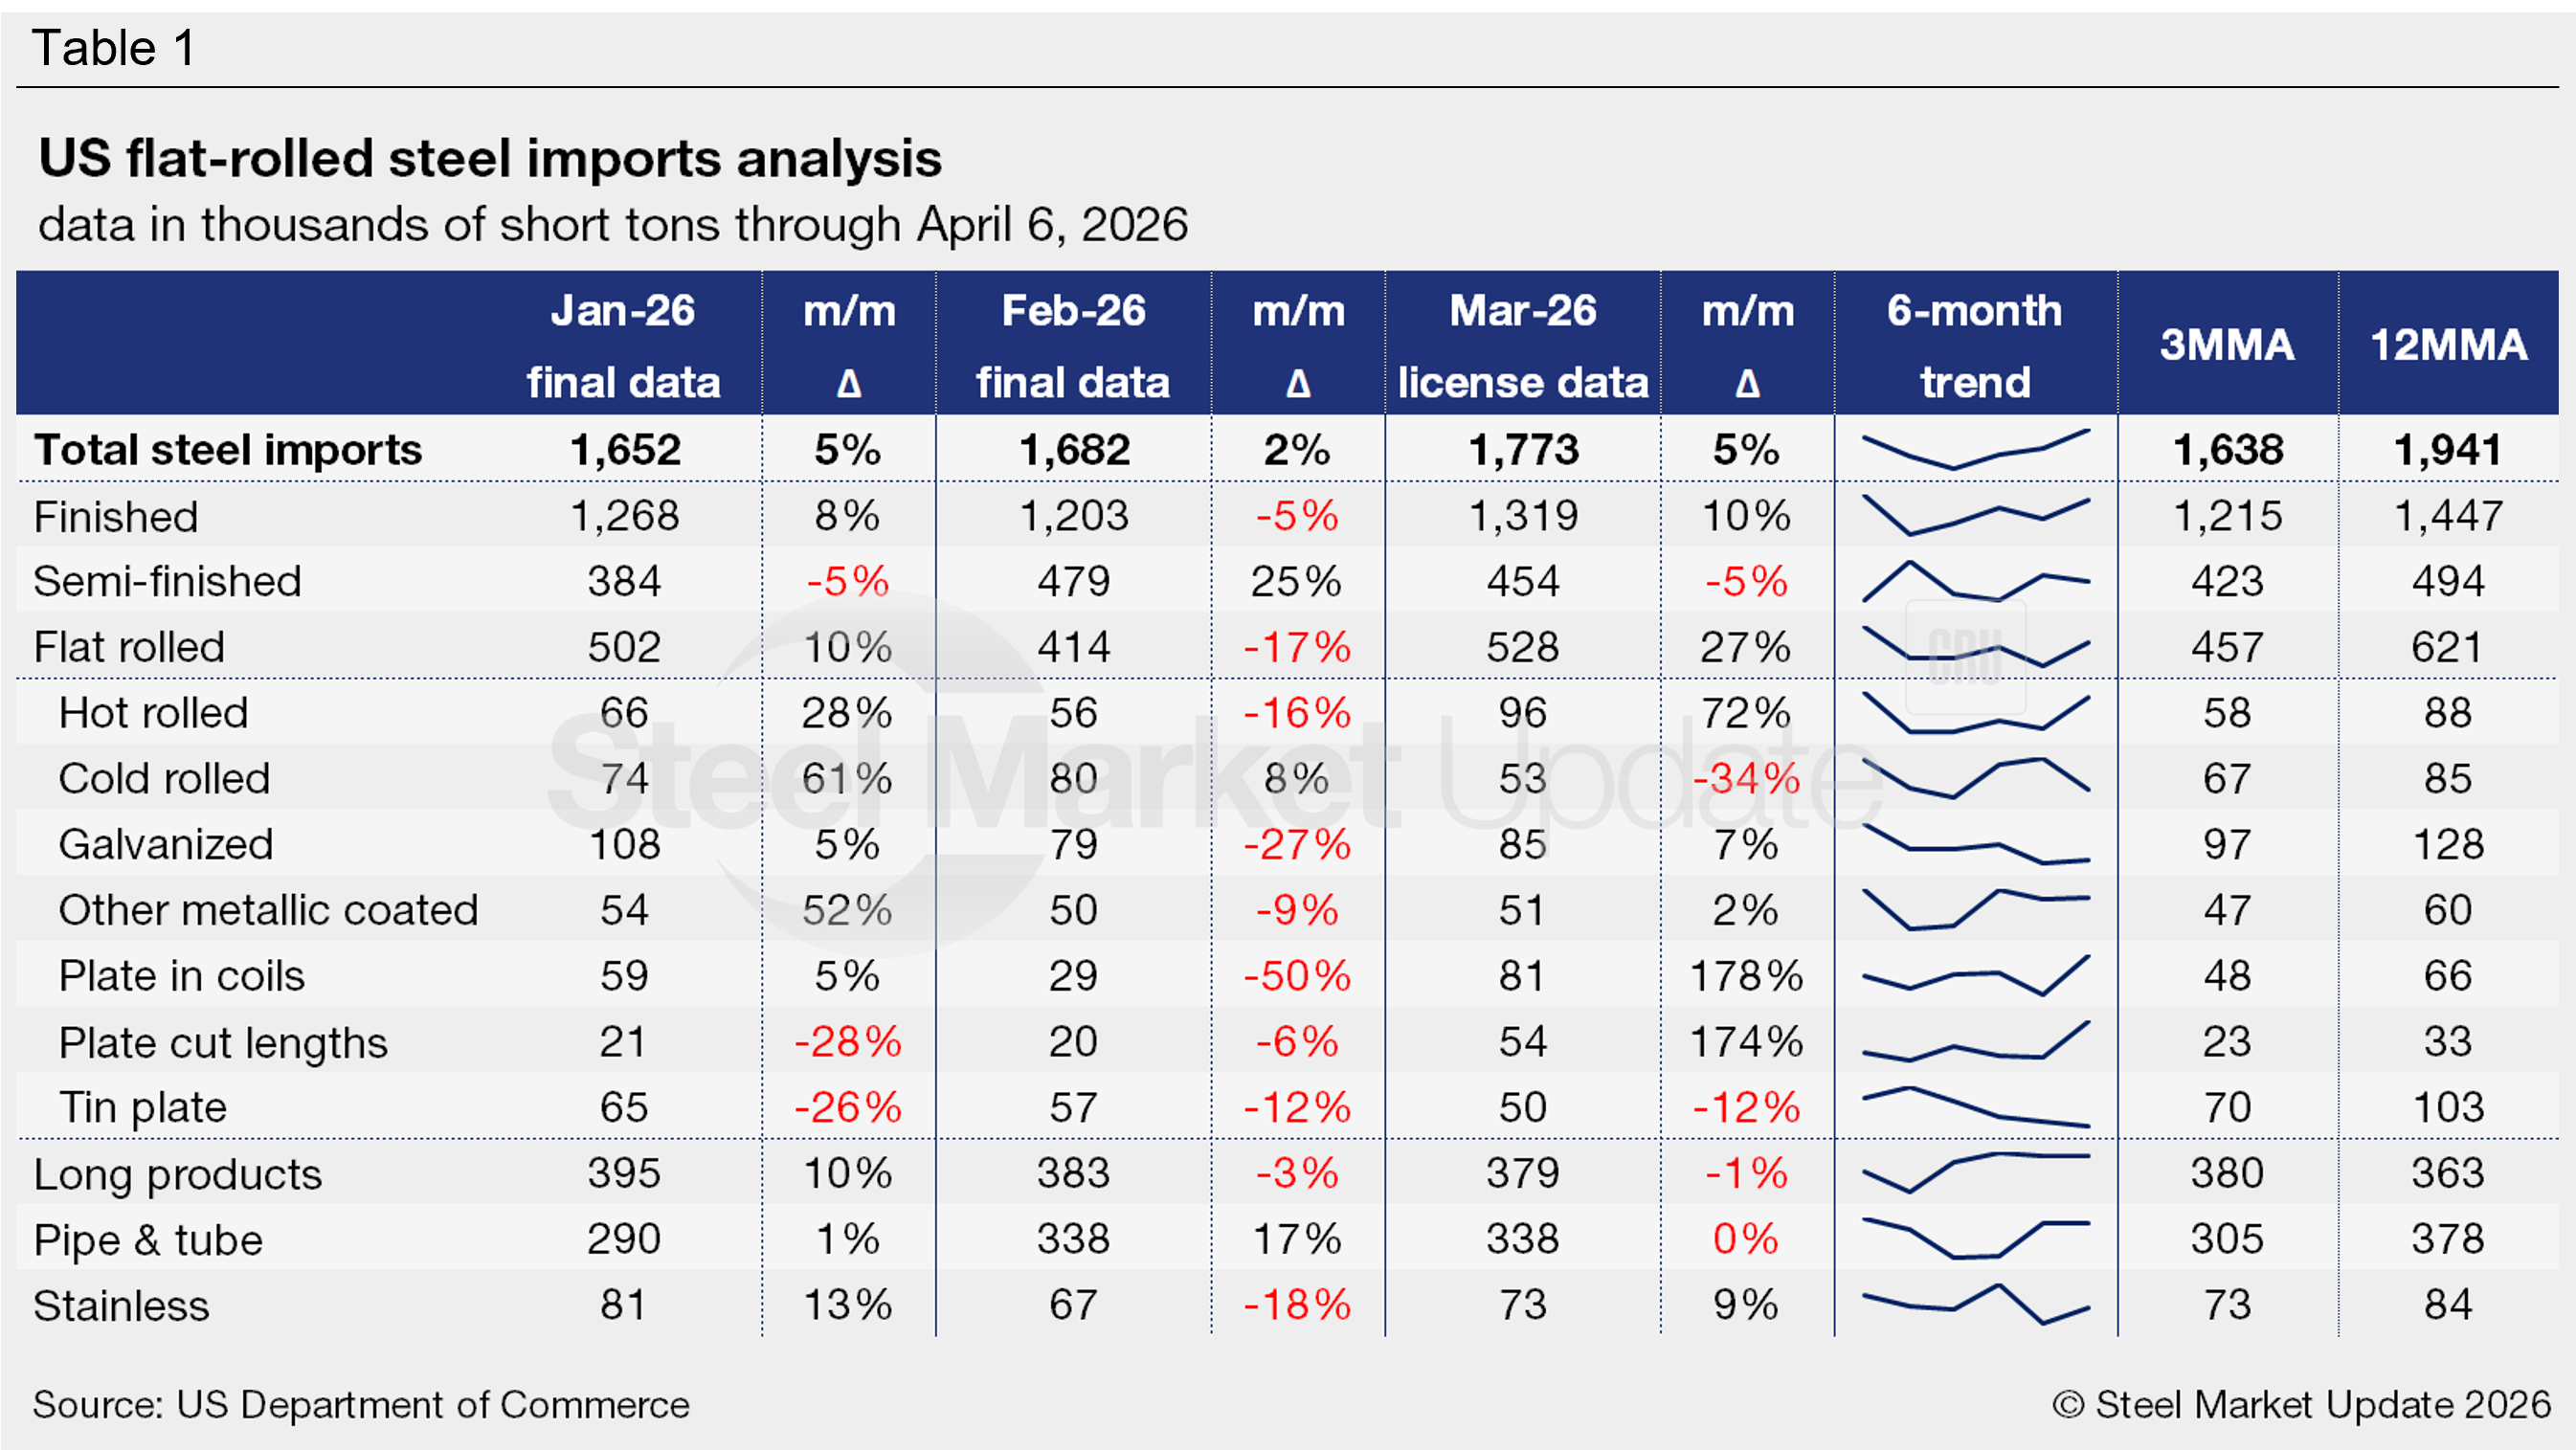
Table 1 highlights high-volume steel product imports (click to expand). Note that the 3MMA and 12MMA columns are calculated through final February data and do not include March licenses. For deeper analysis, visit our Steel Imports page.
Finished vs. semi-finished imports
Imports of finished steel versus semi-finished products (mostly slabs to be further processed by a mill) have moved in differing directions in recent months (Figure 2).
Semi-finished trade rebounded 25% from January to February to 479,000 st. March licenses are back down 5% to 454,000 st. These rates are 10-15% below the average monthly volumes of last year.
Finished imports slipped 5% in February to 1.20 million st. March licenses are back up 10% to a five-month high of 1.32 million st. Volumes are 16-24% lower than those seen across 2025.
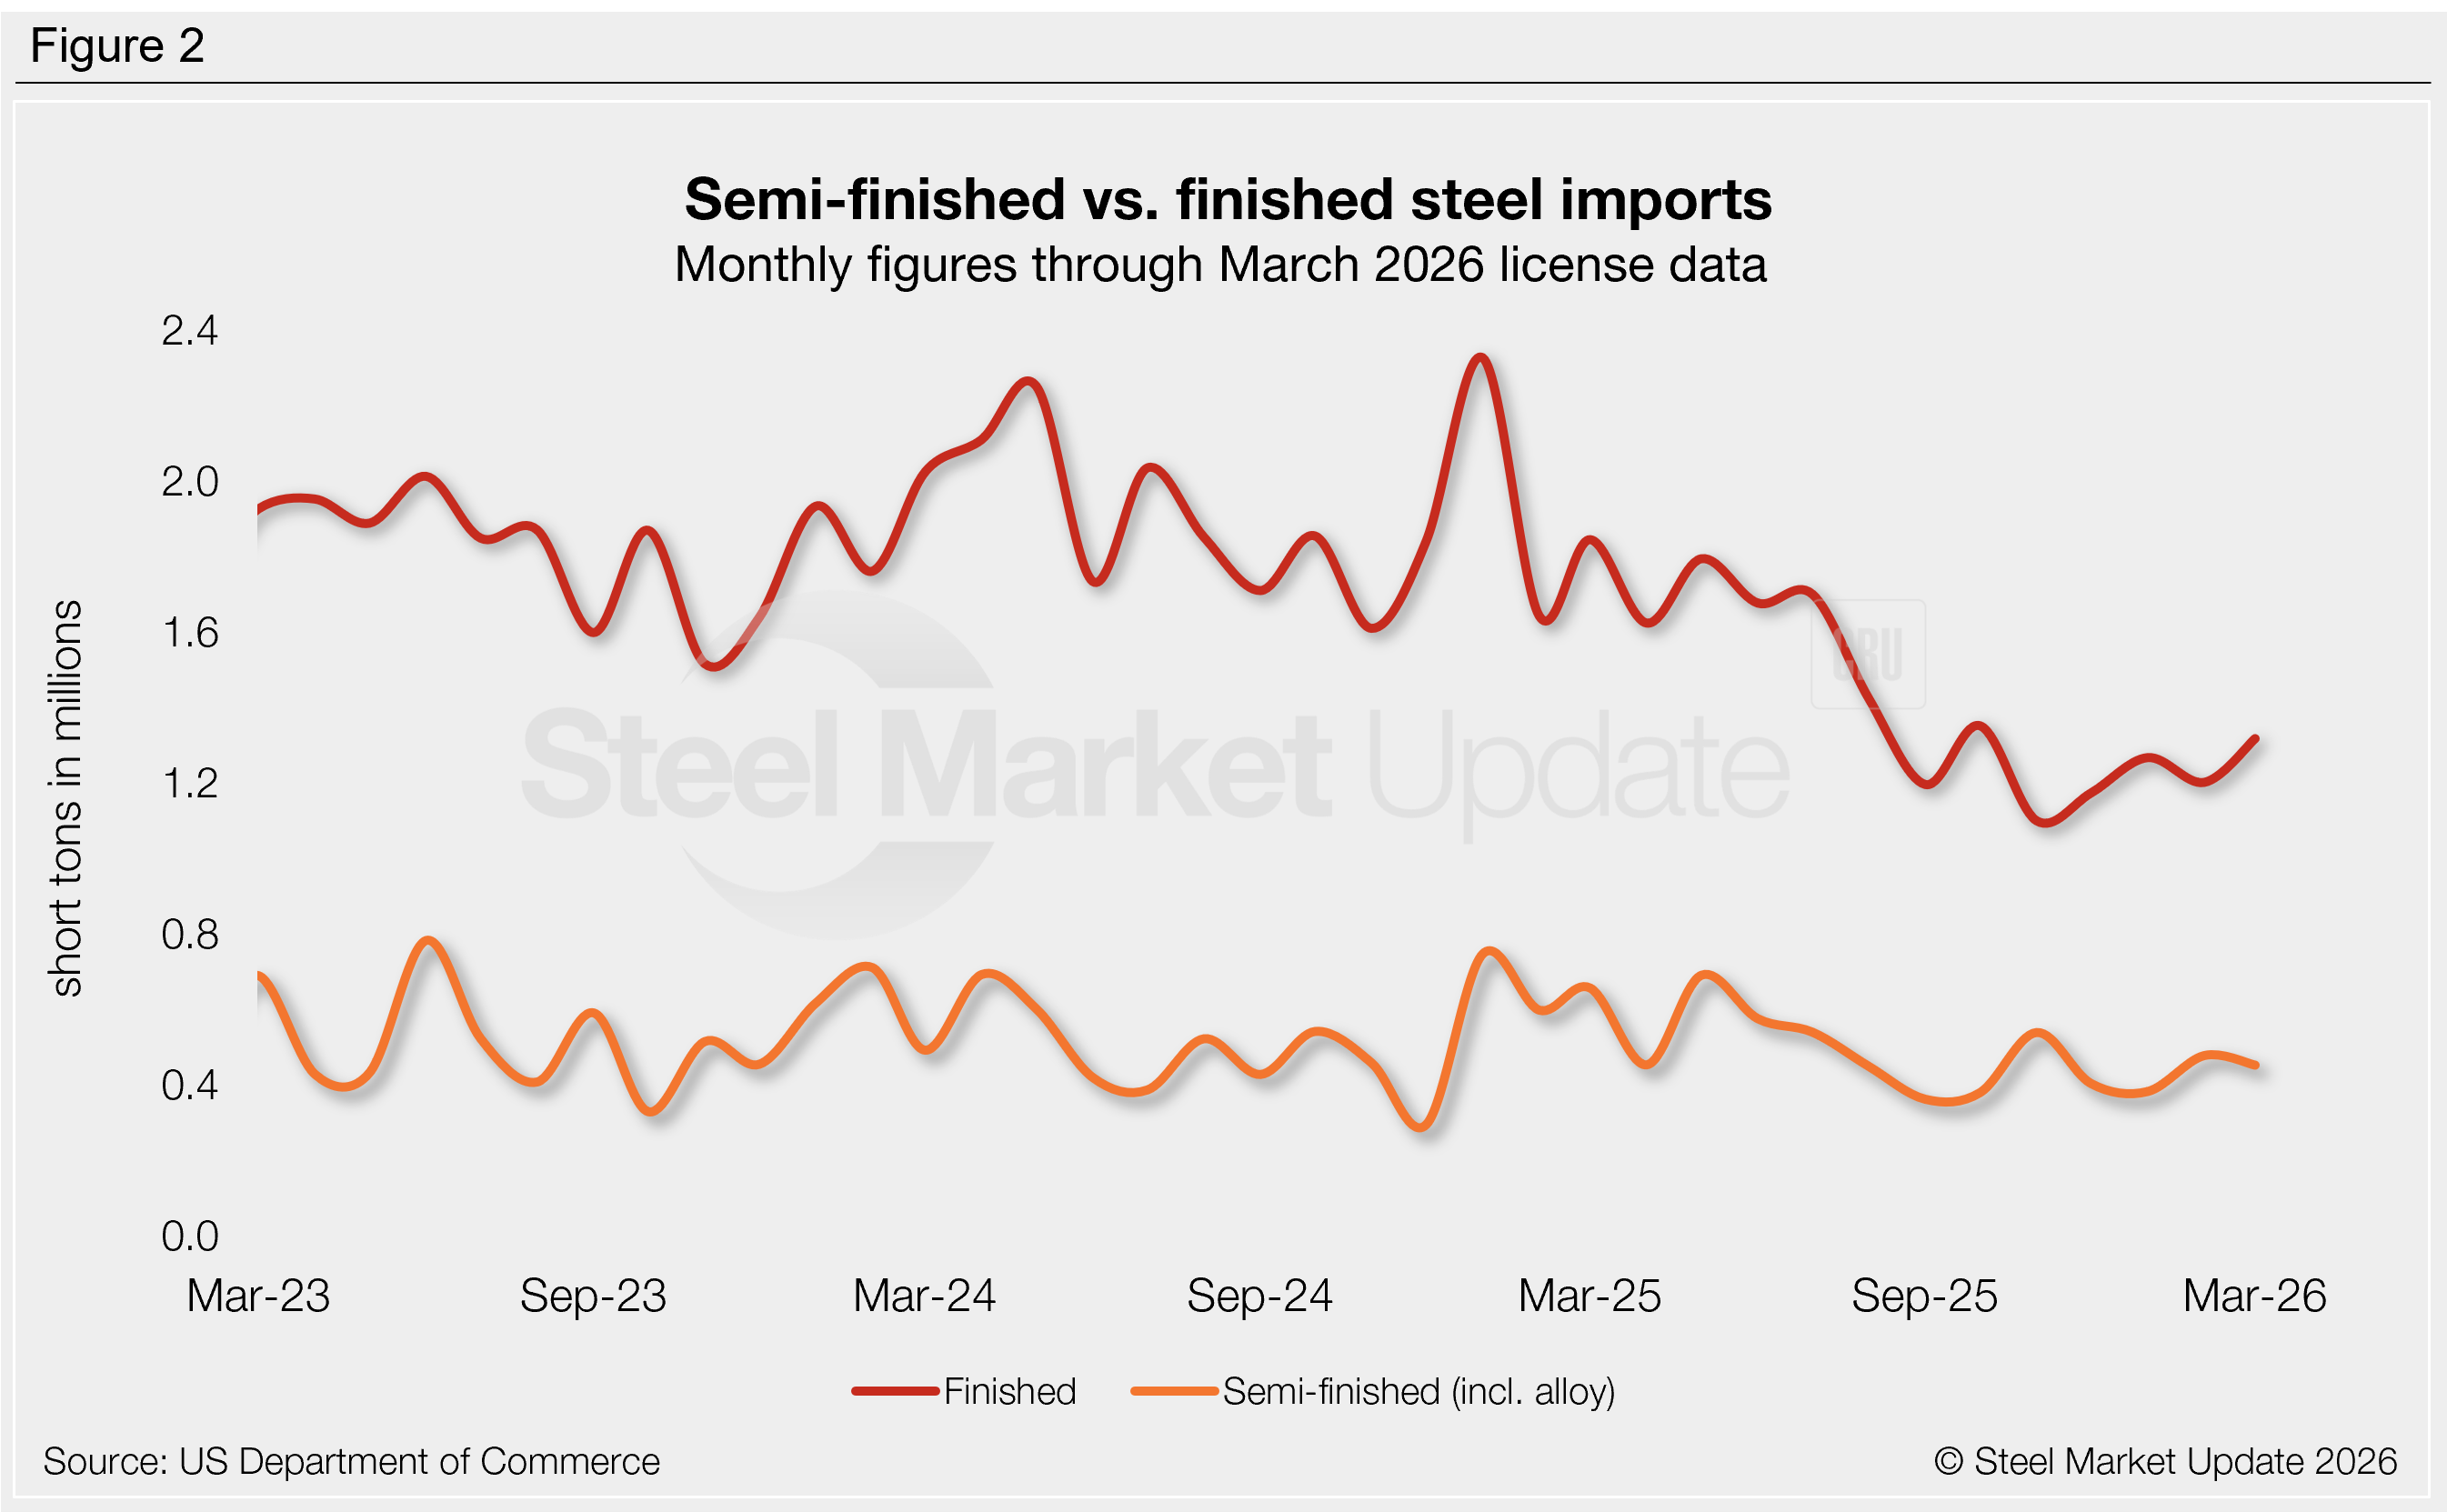
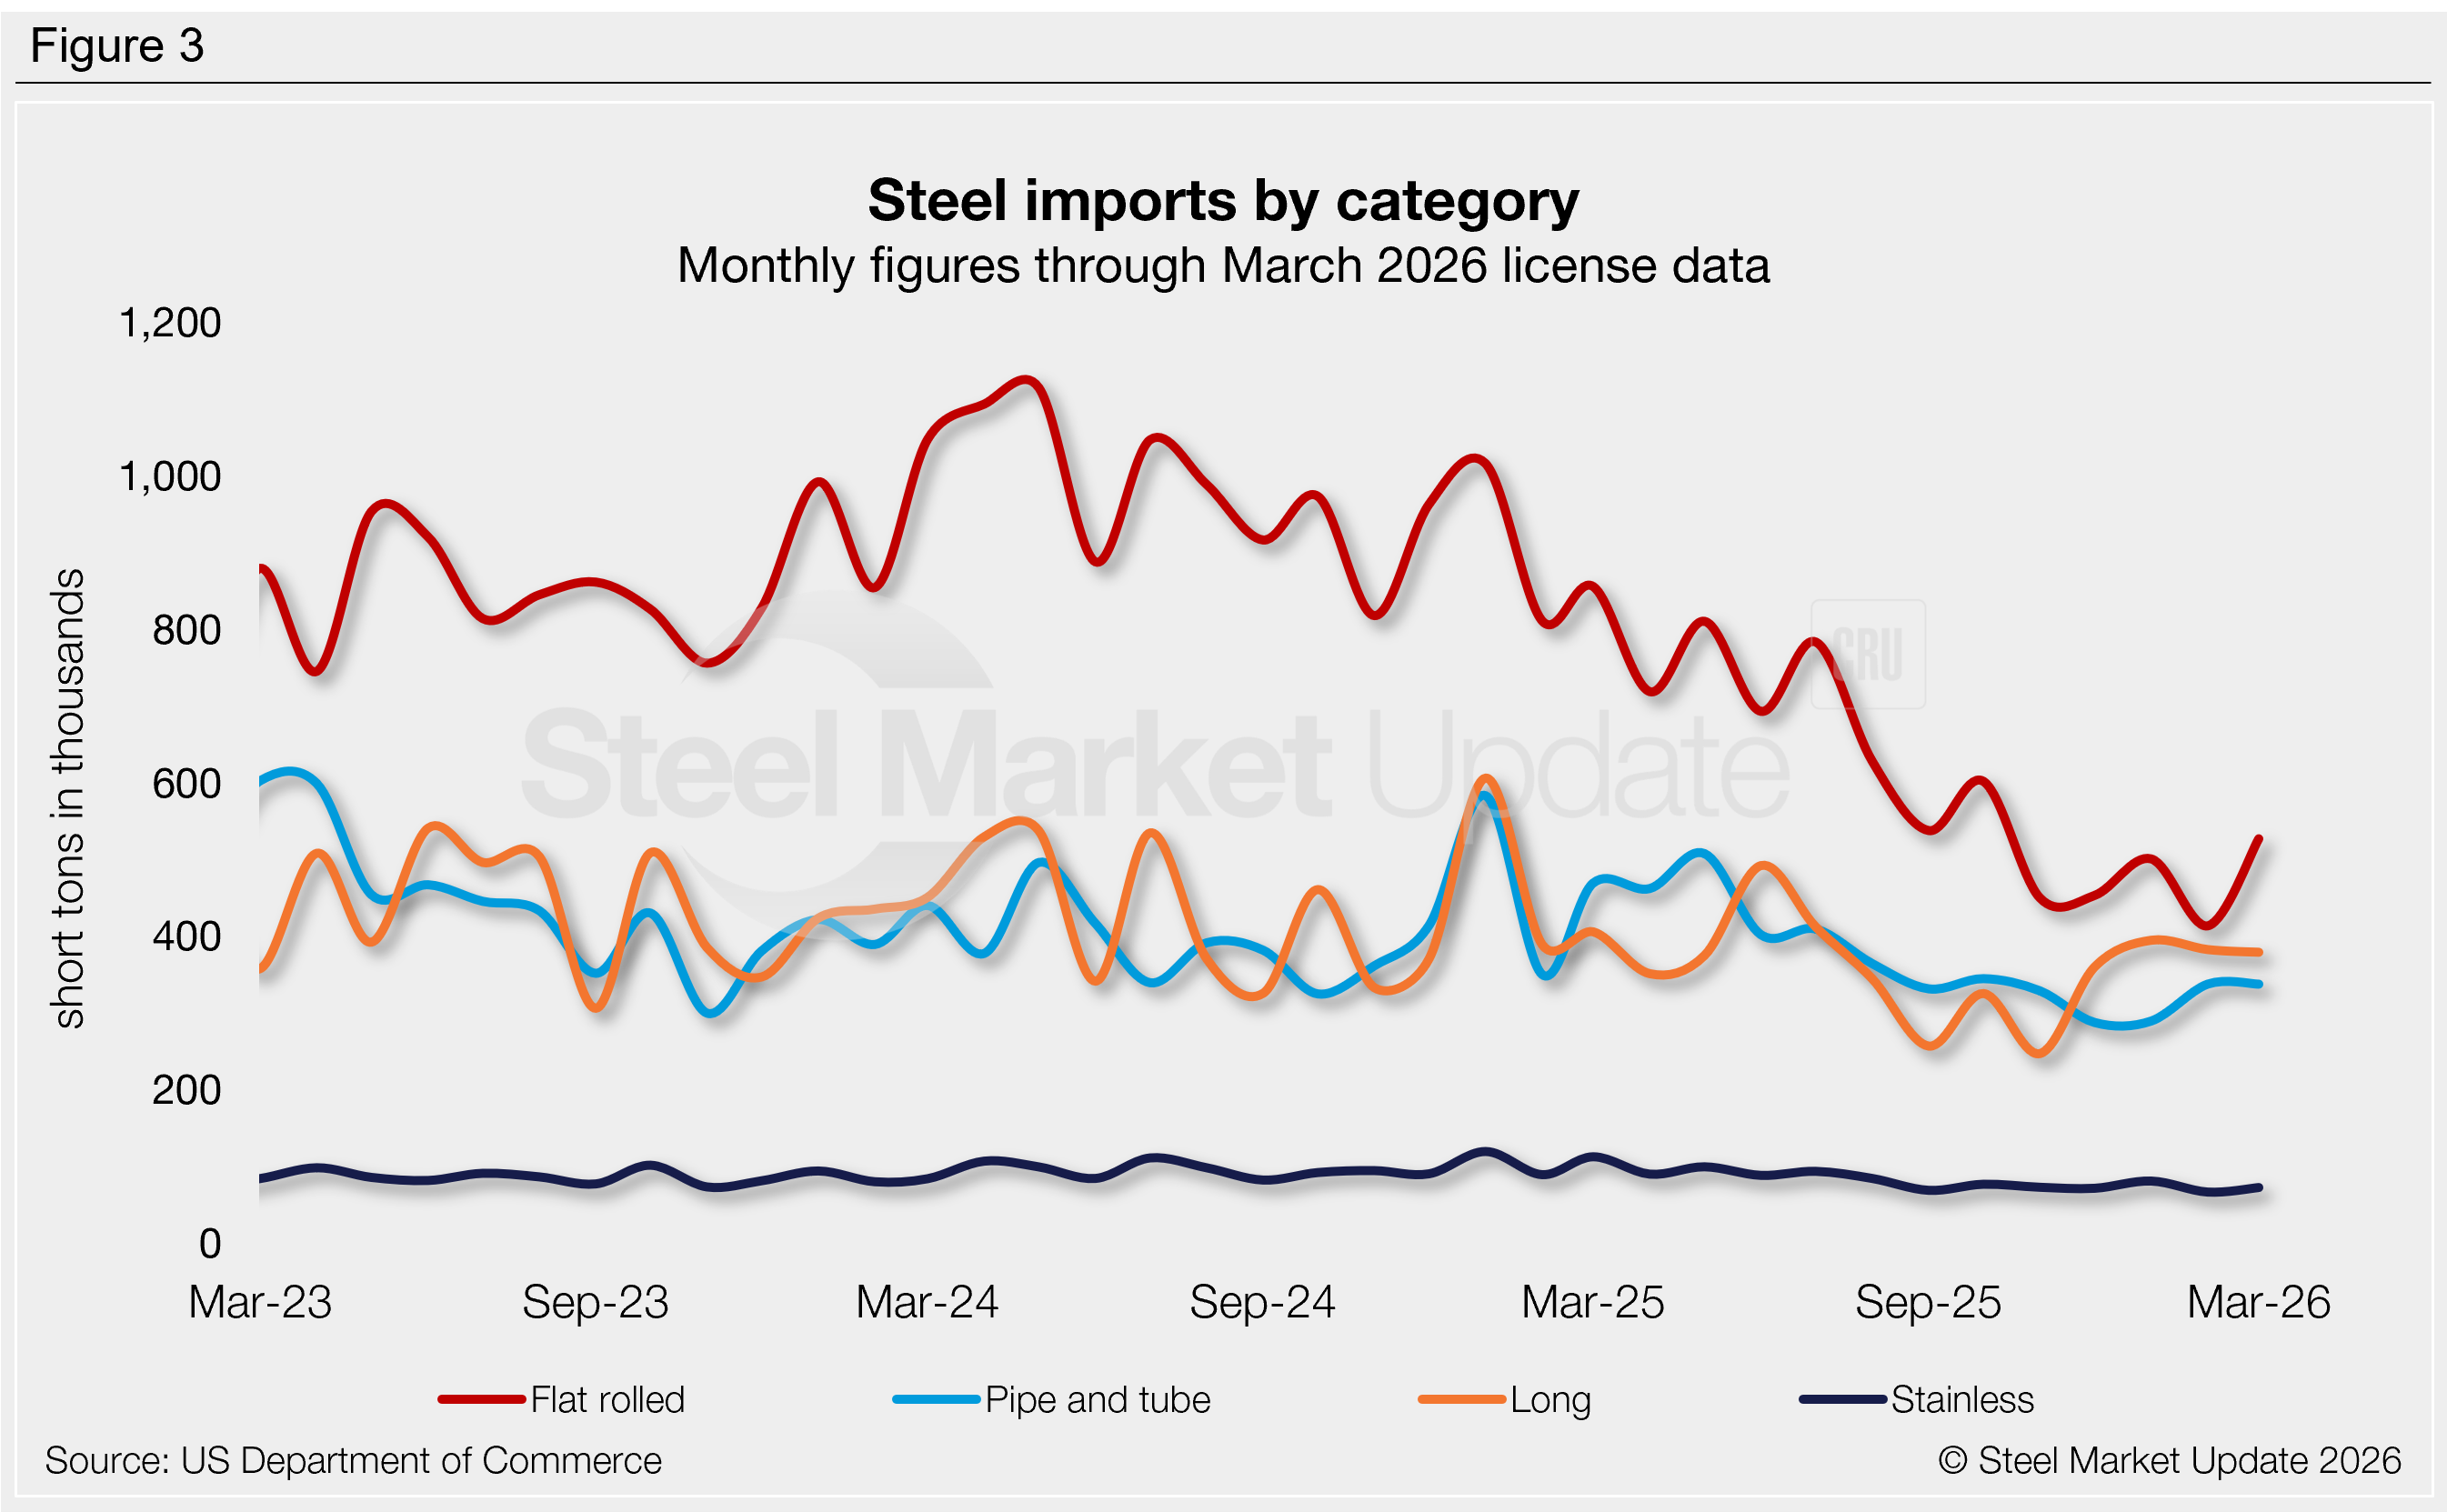
Figure 3 shows monthly imports of popular steel product categories. Notable shifts include:
- Flat-rolled imports fell 17% m/m in February to 414,000 st, the lowest measure seen in our seven-year data history and 41% below the average import rate of 2025. March licenses are back up 27% m/m to a potential five-month high.
- Long product imports declined 3% in February to 383,000 st. March licenses are down another 1%. Both volumes are in line with the average rates of last year.
- Pipe and tube imports jumped 17% in February to 338,000 st and remained there through March. Although up, both months are 16% below the average volumes of 2025.
- Stainless imports fell 18% m/m in February to a near five-year low of 67,000 st. March licenses are back up 9%. These rates are 18-25% lower than average volumes of last year.
Flat-rolled imports
Figure 4 tracks flat-rolled imports for six popular sheet products. All but one product saw reduced imports from January to February, but most recovered in March. Key highlights:
- Hot-rolled coil imports fell 16% in February to just 4,000 st above a multi-year low set last November. March licenses show a 72% recovery, potentially a five-month high.
- Cold-rolled coil imports increased 8% m/m in February to a seven-month high. March licenses are back down 34%, potentially the second-lowest monthly rate seen in 16 years.
- Galvanized imports fell 27% m/m in February, now the lowest measure witnessed in the last 15 years. March licenses rebounded 7%.
- Other-metallic coated (mostly Galvalume) imports declined 9% m/m in February. March licenses are potentially back up 2%.
- Coiled plate imports tumbled 50% m/m in February to the lowest rate seen in our 17-year data history. March licenses are currently back up 178% to a nine-month high.
- Cut-to-length (CTL) plate imports slipped 6% m/m in February, marginally above the multi-year low set last November. March licenses jumped 174% to a potential seven-month high.