Analysis

June 19, 2026
South Korea surges past Canada as top US steel supplier
Written by Laura Miller
South Korea has overtaken Canada as the top foreign supplier of steel to the US market.
Canada has traditionally been the largest exporter to the US by a large margin. But since the hike in Section 232 duties to 50% and the addition of steel derivatives to S232 coverage, Canadian steel shipments to the US have dropped precipitously.
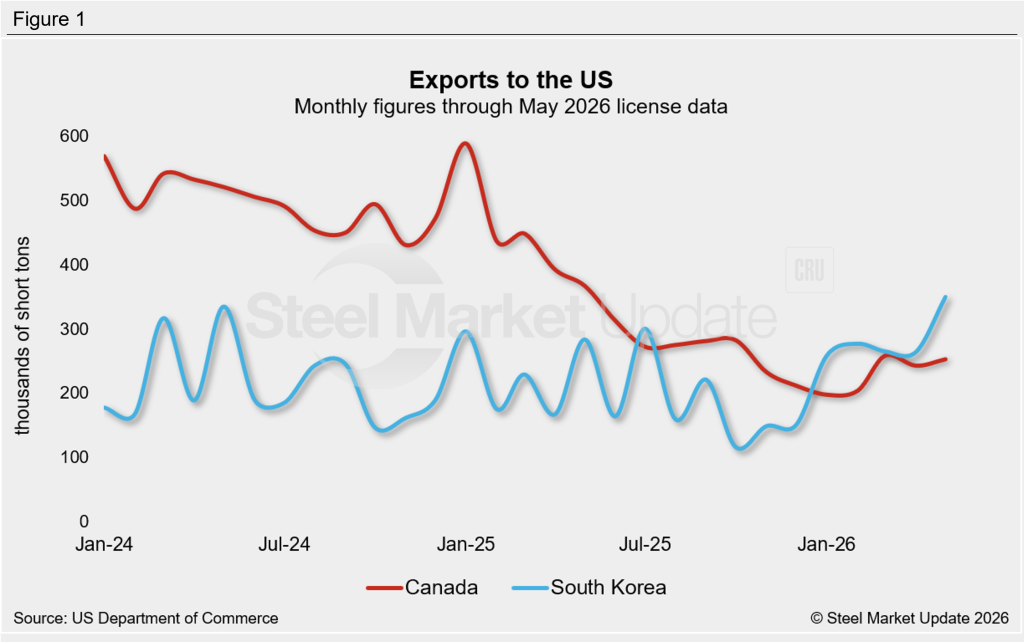
In 2024, Canada sent an average of 546,750 short tons (st) of steel to the US each month, according to US government data. Amid the tariff chaos, its monthly shipments dropped 31% to 377,304 st in 2025. Through April this year, its monthly shipments have averaged just 249,392 st. That’s another year-over-year decline of 33.9%.
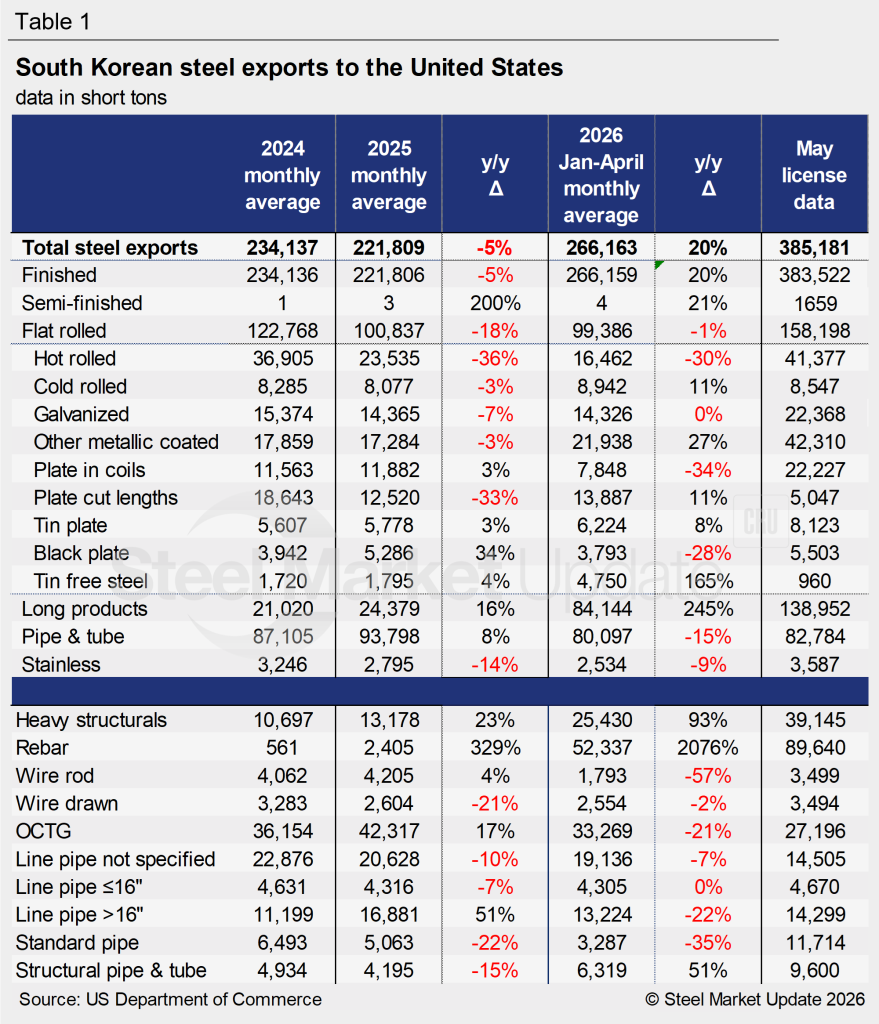
South Korea, meanwhile, has upped its exports to the US this year. After falling 5.3% year over year (y/y) in 2025 to a monthly average of 221,809 st, its steel shipments have risen 32.3% to an average of 293,394 st through April.
In July 2025, Korea surpassed Canada in steel shipments to the US, but it did not sustain the position. Canada’s US exports continued to fall through December 2025, while South Korea’s jumped in the last month of the year, overtaking Canada (Fig. 1 below). While Canadian shipments have bumped up, South Korea has maintained its position as the top supplier to the US each month since December.
Import licenses suggest another big jump in Korea’s steel exports to the US in May. With 385,181 st of licenses counted, that’s a 32% month-on-month rise and a 20% increase from the YTD average.
South Korean exports to US
The biggest increase in South Korean exports to the US is in rebar. Shipments in 2024 averaged just 561 st each month. In 2025, the monthly average jumped to 2,405 st. So far in 2026, shipments have averaged 57,692 st per month, an increase of 2,298% y/y.
Heavy structural exports have also been on the rise, with a 113% y/y increase to 13,178 st on average each month in 2025. Year-to-date (YTD) 2026 shipments are up 23.2% to 28,032 st from 2025’s monthly average.
On the flat-rolled side, shipments of other metallic coated sheet (mostly Galvalume), after falling 3.2% y/y in 2025, are increasing. YTD average monthly shipments of 24,181 st are up 39.9% from 2025.
Cold-rolled sheet shipments fell 2.5% y/y in 2025 to 8,076 st, but have rebounded so far this year with a monthly average of 9,857 st, a 22% increase.
Tin-free steel shipments averaged 1,720 st per month in 2024, but rose 4.4% to 1,795 st in 2025. This year through April, shipments are up 192% to 5,236 st.
Shipments of hot-rolled sheet, meanwhile, have been declining. In 2025, they dropped 36.2% to 23,535 st. YTD 2026, they’re down another 22.9% to 18,146 st. May licenses, however, show a big jump to 41,377 st.
In addition to HR sheet, May licenses show a surge of galvanized sheet, other metallic coated sheet, coiled plate, heavy structurals, rebar, and standard pipe. Other metallic coated licenses, at 42,310 st in May, are tracking 68% ahead of April’s final count. May licenses for coiled plate are also up bigly, at 22,227 st.