Analysis

October 3, 2017
CPIP Data: Construction Growth Slows
Written by Peter Wright
Total construction expenditures contracted in the three months through August year over year for the first time since November 2011, according to August data for construction put in place (CPIP) released by the Department of Commerce on Monday. Privately funded projects still have positive growth on a rolling 12-month basis, but are more than negated by contraction in state, local and federal projects. All three sectors have negative momentum. Construction is extremely seasonal; the growth or contraction we report in this analysis has had seasonality removed by providing only year-over-year comparisons.
![]() At SMU, we analyze the CPIP data with the intent to provide a clear description of activity we believe accounts for about 45 percent of total U.S. steel consumption. See the end of this report for more detail on how we perform this analysis and structure the data. In particular, note that we present NO seasonally adjusted numbers. Much of what you will see in the press may differ from our presentation because others base their comments on adjusted values. Our rational is that construction is highly seasonal and our businesses function in a seasonal world. Also, we don’t understand how the adjustments are made, nor do we trust them.
At SMU, we analyze the CPIP data with the intent to provide a clear description of activity we believe accounts for about 45 percent of total U.S. steel consumption. See the end of this report for more detail on how we perform this analysis and structure the data. In particular, note that we present NO seasonally adjusted numbers. Much of what you will see in the press may differ from our presentation because others base their comments on adjusted values. Our rational is that construction is highly seasonal and our businesses function in a seasonal world. Also, we don’t understand how the adjustments are made, nor do we trust them.
Total Construction
Total construction contracted by 0.2 percent in three months through August year over year, though it expanded 3.4 percent on a rolling 12-months basis. This was the first contraction after 63 consecutive months of positive growth. Since the three-month growth rate is lower than the 12-month rate, we conclude that the rate of growth is slowing. We describe this as negative momentum. August construction expenditures totaled $94.6 billion, which breaks down to $67.6 billion of private work, $25.2 billion of state and locally funded (S&L) work, and $1.8 billion of federally funded work (Table 1).
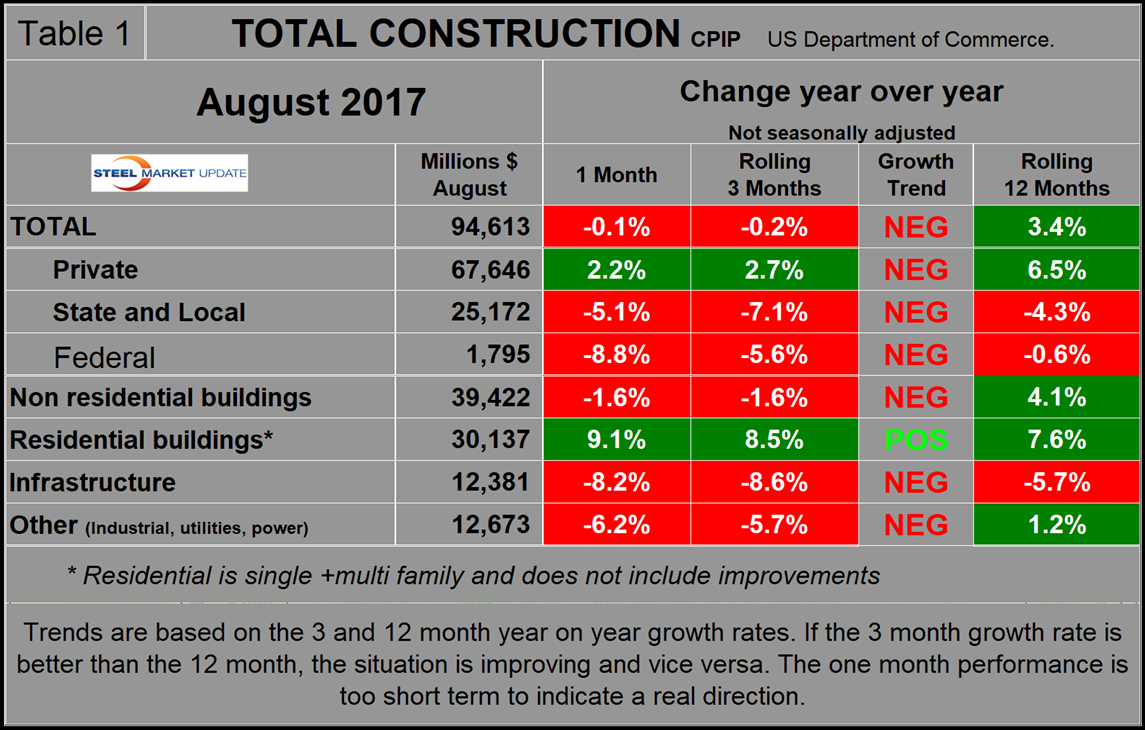
Growth trend columns in all four tables in this report show momentum. Figure 1 shows total construction expenditures on a rolling 12-month basis as the blue line and the rolling three-month year-over-year growth rate as the brown bars.
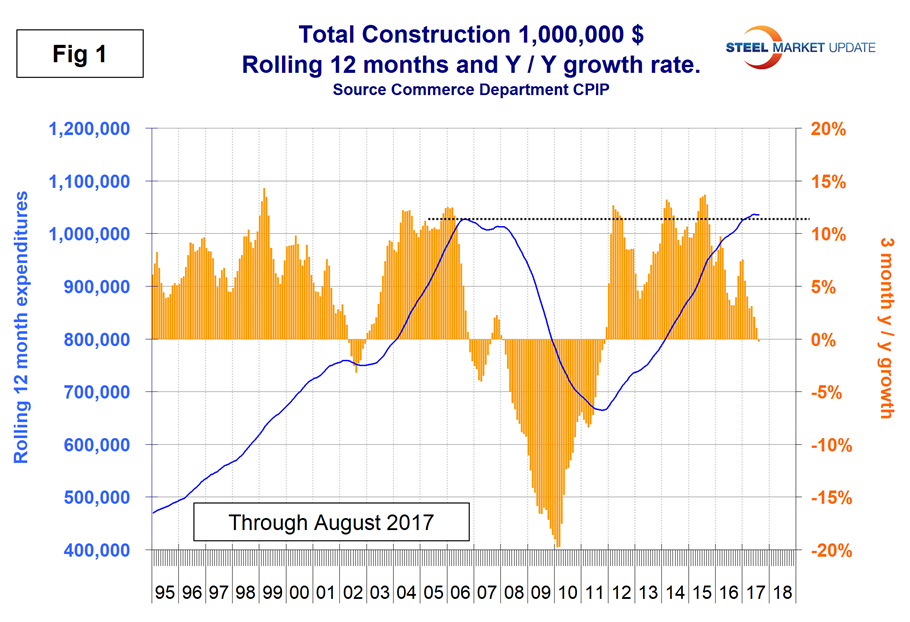
Figures 1 through 4 in this analysis have the same format, the result of which is to smooth out variation and eliminate seasonality. We consider four sectors within total construction. These are nonresidential, residential, infrastructure and other. The latter is a catchall and includes industrial, utilities and power. All four of these sectors, except residential buildings, had negative momentum in this latest data.
The pre-recession peak of total construction on a rolling 12-month basis was $1.028 trillion through August 2006. The low point was $665.1 billion in the 12 months through April 2011. August 2016 through August 2017 on a rolling 12-month basis were the first months to exceed the trillion-dollar level since August 2008. In 12 months through August 2017, construction expenditures totaled $1.035 trillion.
Private Construction
Table 2 shows the breakdown of private expenditures into residential and nonresidential and subsectors of both. The growth rate of private construction was 2.7 percent in the three months through August, down from 11.0 percent in the three months through January as shown by the brown bars in Figure 2.
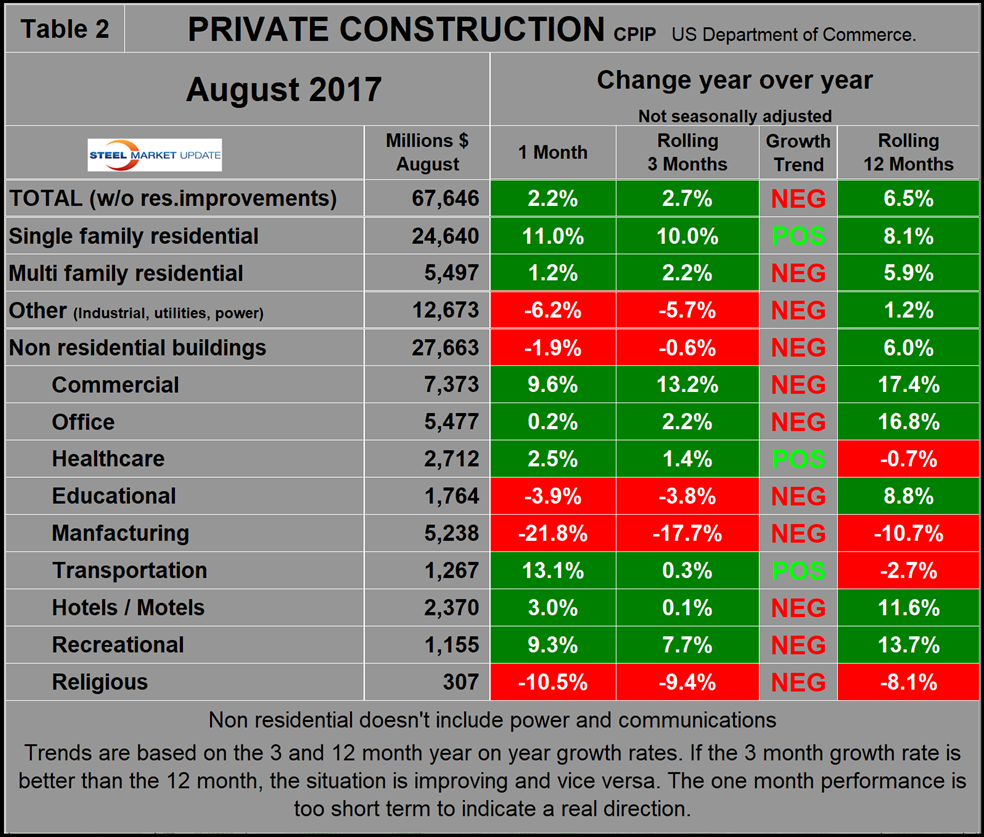
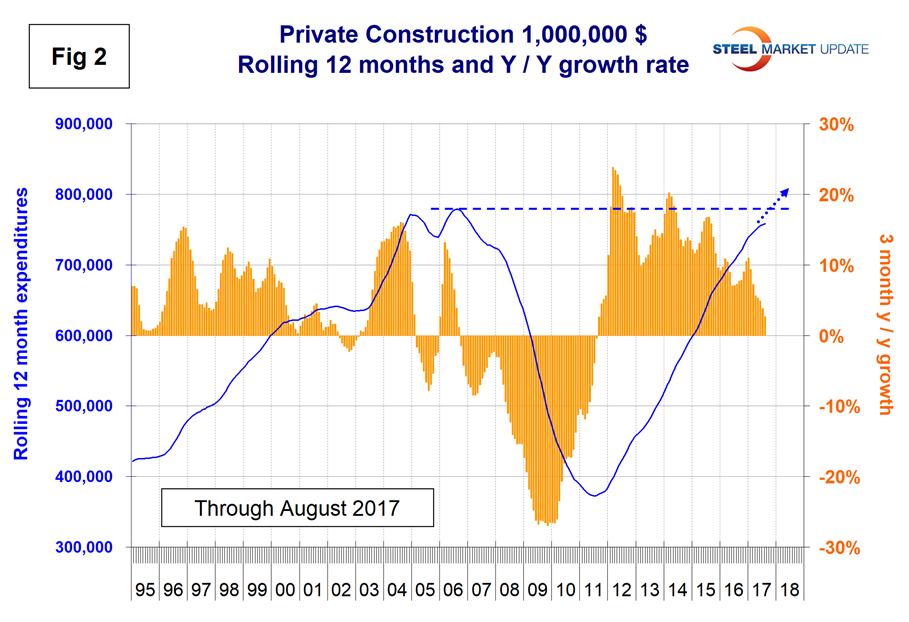
In previous reports, we projected that total private expenditures would reach the pre-recession high at about the end of this year. This prospect is now receding. Excluding property improvements, our report shows that single-family residential grew by 10.0 percent with positive momentum and multifamily residential grew by 2.2 percent with negative momentum.
The Census Bureau reports on construction starts in their housing analysis. In the starts data, the whole project is entered into the database when ground is broken. Single-family starts grew at 5.9 percent in the three months through August, about half the growth rate of CPIP, but multifamily starts contracted by 25.8 percent. Multifamily starts have gone off a cliff since April, and this is now beginning to show in the CPIP data. Within private nonresidential buildings, the commercial sector, mainly retail, has double-digit growth. This doesn’t jibe with the retail employment report, which has seen declining job growth for almost a year. Neither does it make sense considering all we read about the woes of big box retail driven by online purchases. Educational, manufacturing and religious building expenditures are contracting. All other private building sectors still have positive growth, but except for healthcare and transportation terminals are slowing. The third-quarter Federal Reserve Senior Loan Officer Survey indicated there is currently a net decrease in demand for construction and land development loans, and terms for such loans are tightening. The Fed survey reviews changes in the terms of, and demand for, bank loans to businesses on a quarterly basis based on the responses from 73 domestic banks and 24 U.S. branches and agencies of foreign banks.
State and Local Construction
S&L work contracted by 7.1 percent in the rolling three months through August year over year with negative momentum (Table 3).
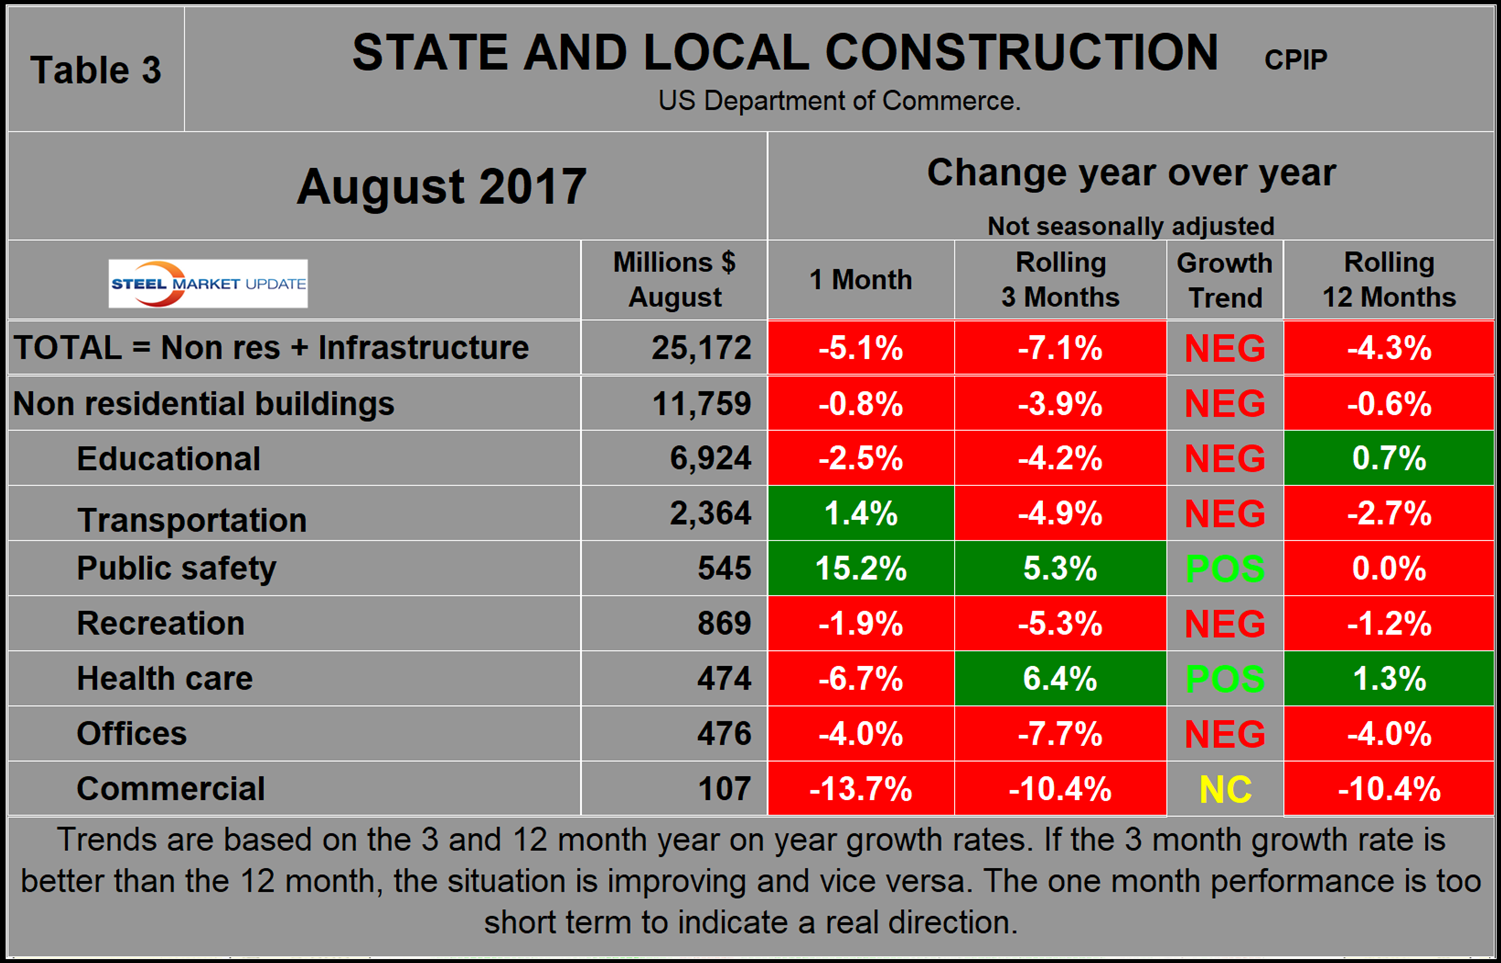
This overall figure includes both nonresidential buildings and infrastructure. Nonresidential buildings contracted by 3.9 percent. April 2016 was the last month in which S&L expenditures had positive year-over-year growth. Figure 3 shows growth as the brown bars and the rolling 12-month total of expenditures as the blue line. Educational buildings are by far the largest subsector of S&L nonresidential buildings at $6.9 billion in August when on a 3MMA basis year-over-year growth was negative 4.2 percent with negative momentum.
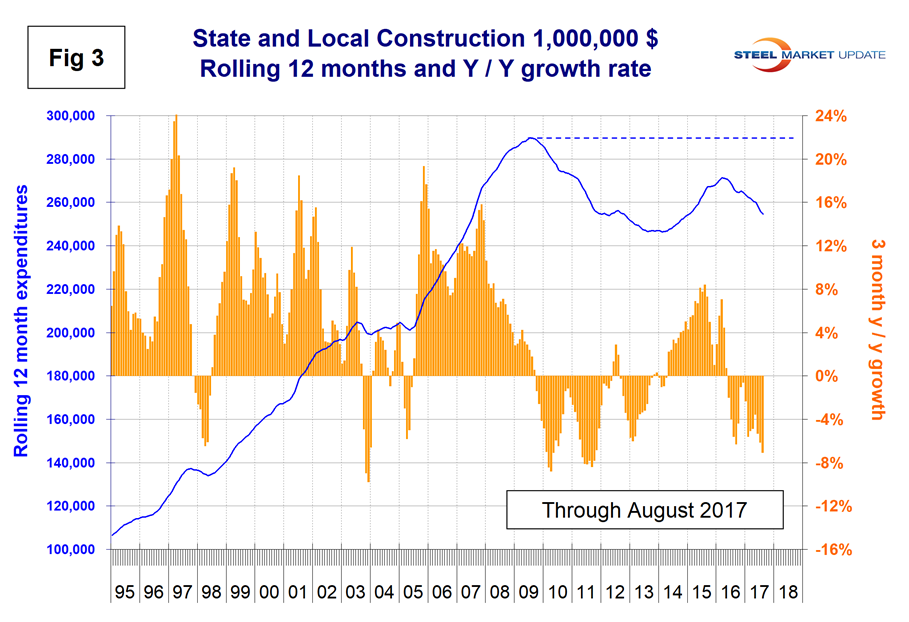
Comparing Figures 2 and 3, S&L construction did not have as severe a decline as private work during the recession and private work bounced back faster. The downturn in S&L (including infrastructure) means that a full recovery to the pre-recession level of expenditures won’t be achieved until well into the next decade, at best.
Drilling down into the private and S&L sectors as presented in Tables 2 and 3 shows which project types should be targeted for steel sales and which should be avoided. There are also regional differences to be considered for which data is not available from the Commerce Department.
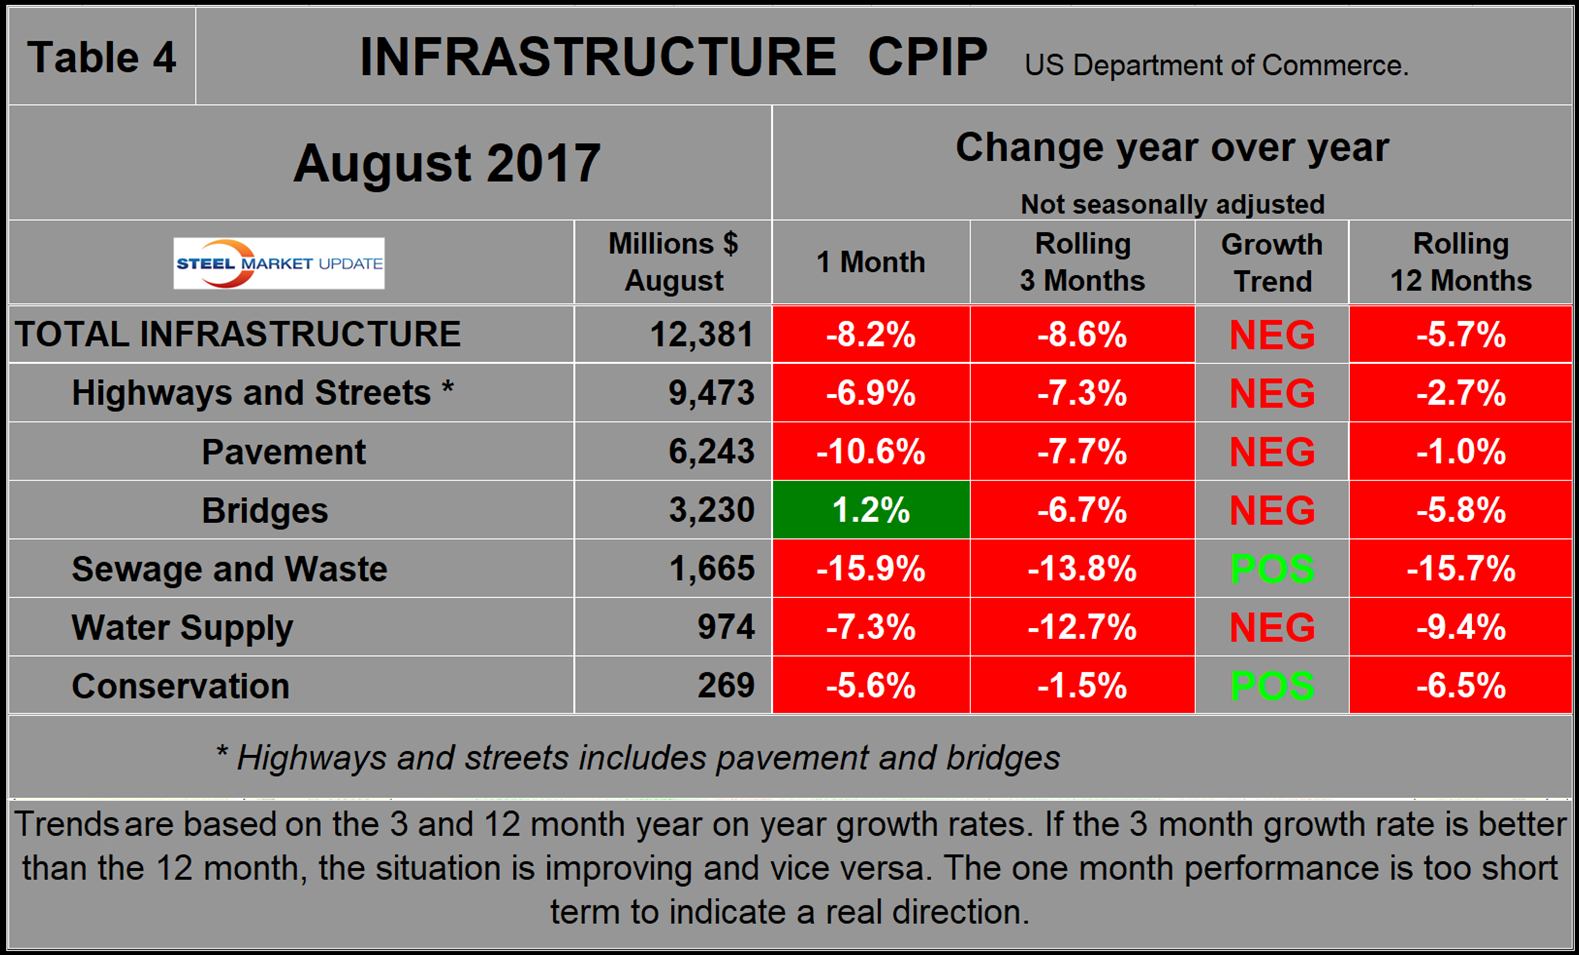
Infrastructure
Infrastructure expenditures had positive growth in the first five months of last year and have had only one slightly positive month since then. In the August data, every subsector of infrastructure contracted, and only sewage and waste projects had positive momentum. Highways and streets including pavement and bridges account for about two-thirds of total infrastructure expenditures. Highway pavement is the main subcomponent of highways and streets and had a 7.3 percent contraction in three months through August. Bridge work contracted by 6.7 percent (Table 4). We are wondering why there isn’t an infrastructure component in the private expenditures section of CPIP considering the volume of private toll road construction that this writer sees in Texas. We will try to get an answer from the Commerce Department.
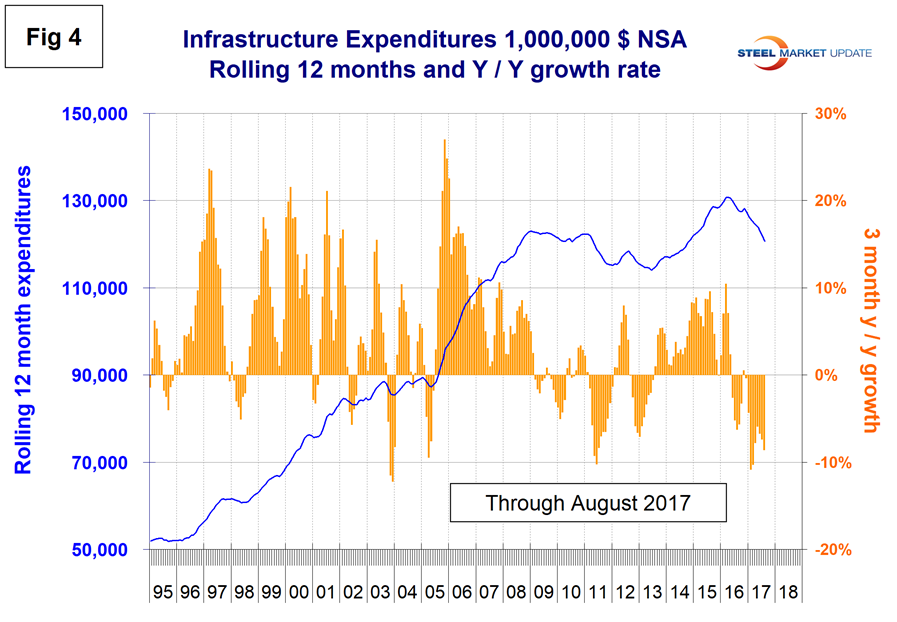
Infrastructure expenditures have exceeded the pre-recession high every month since August 2015, but in the last 16 months have been in a downturn (Figure 4). There is still no sign that the $305 billion authorized in December 2015 by Congress to fund roads, bridges and rail lines has begun to take effect. The long lead time for approvals and project design slows the application of available infrastructure funds, but it seems now there must be some other drag at work. The 2015 five-year infrastructure bill was the largest reauthorization of federal transportation programs approved by Congress in more than a decade, ending an era of stopgap bills and half-measures that left the Highway Trust Fund nearly broke and frustrated local governments and business groups.
Total Building Construction Including Residential
Figure 5 compares year-to-date expenditures for building construction for 2016 and 2017. Single-family residential is dominant and in the 12 months of 2016 totaled $243 billion, up from $233 billion in 2015. On a rolling 12-month basis through August, single-family residential expenditures totaled $255 billion. In the first eight months of 2017 year over year, all project segments expanded except manufacturing, religious and lodging led by commercial (mainly stores), up by 23.0 percent, and offices, up by 8.5 percent.
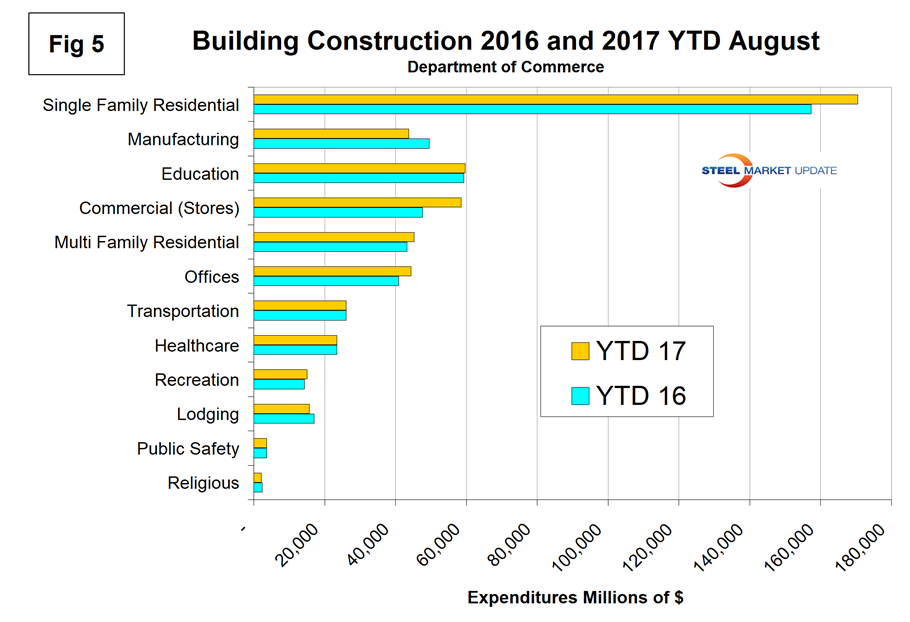
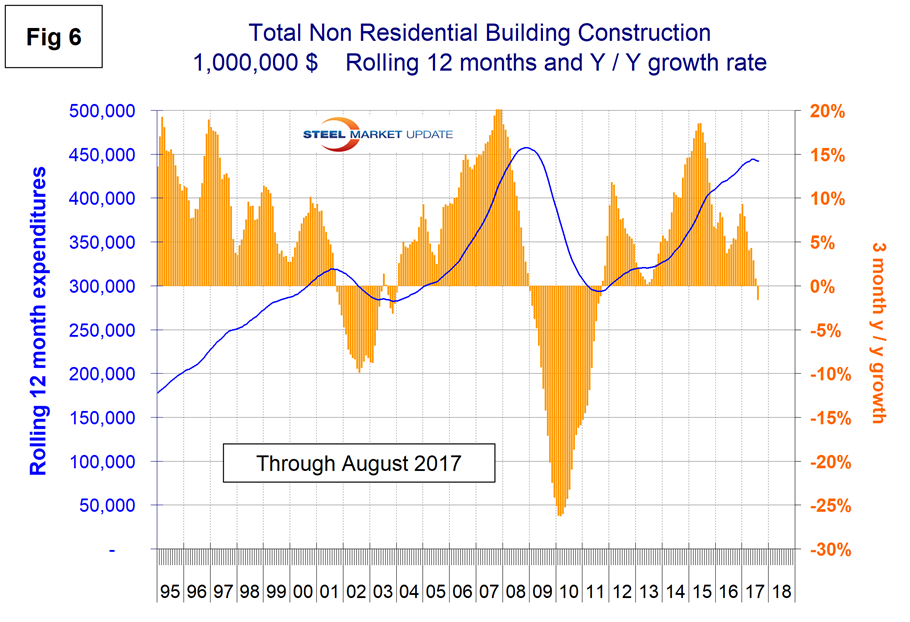
Figure 6 shows total expenditures and growth of nonresidential building construction. Growth has been slowing this year and went negative in the three months through August year over year for the first time since September 2011.
Explanation: Each month, the Commerce Department issues its construction put in place (CPIP) data, usually on the first working day covering activity one month and one day earlier. Construction put in place is based on spending work as it occurs, estimated for a given month from a sample of projects. In effect, the value of a project is spread out from the project’s start to its completion. This is different from the starts data published by the Census Bureau for residential construction, by Dodge Data & Analytics and Reed Construction for nonresidential, and Industrial Information Resources for industrial construction. In the case of starts data, the whole project is entered to the data base when ground is broken. The result is that the starts data can be very spiky, which is not the case with CPIP.
The official CPIP press release gives no appreciation of trends on a historical basis and merely compares the current month with the previous one on a seasonally adjusted basis. The background data is provided as both seasonally adjusted and non-adjusted. The detail is hidden in the published tables, which SMU tracks and dissects to provide a long-term perspective. Our intent is to provide a route map for those subscribers who are dependent on this industry to “follow the money.” This is a very broad and complex subject, therefore to make this monthly writeup more comprehensible, we are keeping the information format as consistent as possible. In our opinion, the absolute value of the dollar expenditures presented are of little interest. What we are after is the magnitude of growth or contraction of the various sectors. In the SMU analysis, we consider only the non-seasonally adjusted data. We eliminate seasonal effects by comparing rolling three-month expenditures year over year. CPIP data also includes the category of residential improvements, which we have removed from our analysis because such expenditures are minor consumers of steel.
In the four tables included in this analysis, we present the non-seasonally adjusted expenditures for the most recent data release. Growth rates presented are all year over year and are the rate for the single month’s result, the rolling three months and the rolling 12 months. We ignore the single month year-over-year result in our writeups because these numbers are preliminary and can contain too much noise. The growth trend columns indicate momentum. If the rolling three-month growth rate is stronger than the rolling 12 months, we define that as positive momentum, and vice versa. In the text, when we refer to growth rate, we are describing the rolling three-month year-over-year rate. In Figures 1 through 4 and 6, the blue lines represent the rolling 12-month expenditures and the brown bars represent the rolling there-month year-over-year growth rates.