

Prices

October 18, 2018
HRC Futures: What Goes Up, Comes Down?
Written by Gaurav Chhibbar
Gaurav Chhibbar is a partner at Metal Edge Partners, a firm engaged in Risk Management and Strategic Advisory. In this new role, he and his firm design and execute risk management strategy for clients along with providing process and analytical support.
In Gaurav’s previous role, he was a Trader at Cargill spending time in Metal and Freight markets in Singapore before moving to the U.S. He can be reached at Gaurav@MetalEdgePartners.com for queries/comments/questions.
The futures market has shown some interesting movements over the past few weeks. Last week, the price increase announcement from the mills led the futures to see some buying interest emerge. The buyers, still uncertain on how far the index will drop given the announcement, were either locking in physical steel prices or simply covering shorts. A week later, with the index printing down $14, the curve got pushed back down.
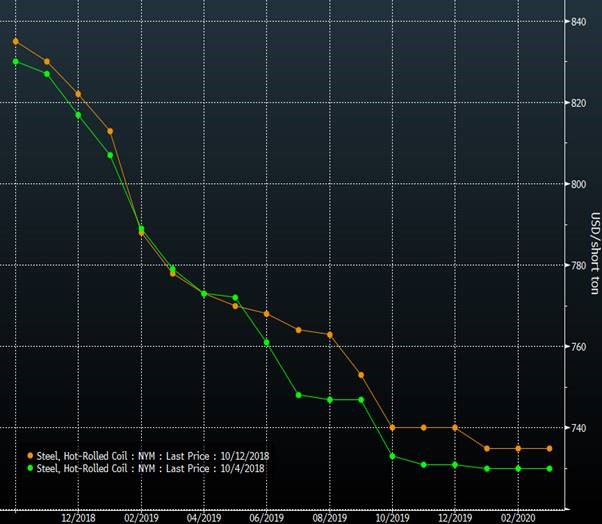
The chart below shows the change in the futures curve for HRC from 10/4 (Green) to 10/12 (Orange). On 10/10 was when Nucor announced the price increase.
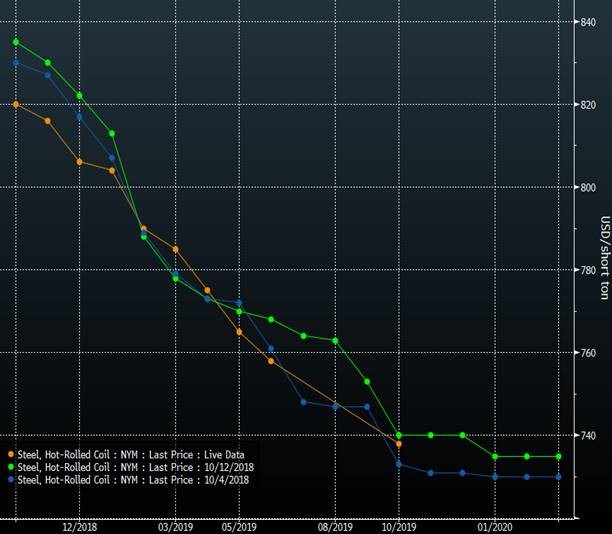
The chart below shows the curves again, with the Orange curve in this chart showing the most recent levels. The impact of the falling index level was felt hard on the front of the curve, with November and December getting hit hard.
Meanwhile, the physical market continued to transact with similar lack of direction. Interestingly, the bulls in this market continued to make the case for higher prices on the basis of ‘impending production cuts’.
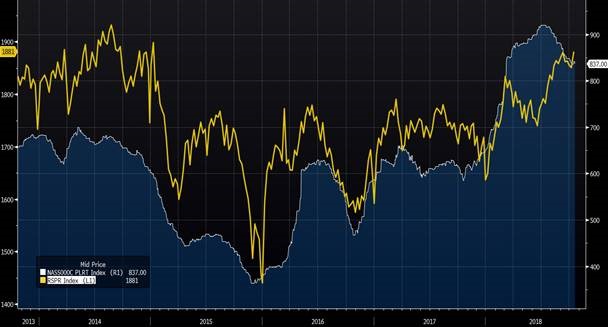
The yellow line in the chart below shows the weekly AISI raw steel production. The data is published in ‘000s of short tons and shows a steady rise in the recent weeks as prices have come under pressure.
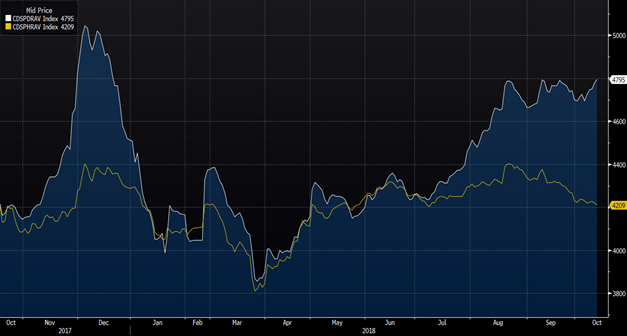
While the story in the U.S. was of pressure on pricing, the story on Chinese Rebar, an important gauge for international steel traders, was a different one. Asian traders continue to assess the impact that winter production cuts in China have in domestic and in global markets. Chinese Rebar has remained supported in the run up to Q4, while HRC prices in China have taken a dip on the back of reported weakness in consumer durables and the auto sector in China.
HRC prices outside of China in European markets weren’t in a different place. The green line below, the North European HRC prices (Eur/mt), have remained under pressure despite European safeguards in place. Combined with upward pressure from scrap prices, this has led to a squeeze on margins for producers in Europe. Local traders have stated this to be the result of seasonal weakness and higher production rates at European mills. However, it remains to be seen if weaker domestic European prices lead to increased offers to the U.S. for HRC.
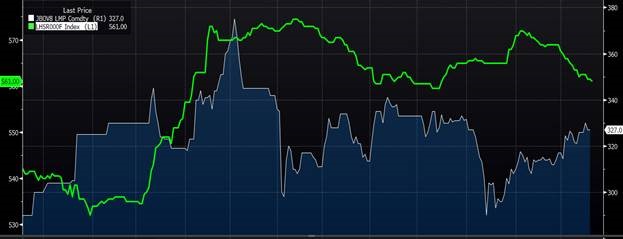
In order to assess the feasibility of executing this arb, one has to look at the EUR 561 levels below, and calculate the equivalent USD levels. With a 1.15 conversion rate of Eur to USD, the European price works to $642.50. Add another 25 percent of Section 232 tariff rate and the FOB pricing is a touch above $800. Having priced ocean freight many times, I can’t recall when this route (Med-USG) on a Handy or Handymax (25,000mt-45,000mt) was below $30.
Disclaimer: The information in this write-up does not constitute “investment service”, “investment advice”, or “financial product advice” as defined by laws and/or regulations in any jurisdiction. Neither does it constitute nor should be considered as any form of financial opinion or recommendation. The views expressed in the above article by Metal Edge Partners are subject to change based on market and other conditions. The information given above must be independently verified and Metal Edge Partners does not assume responsibility for the accuracy of the information.


