Prices

March 26, 2020
Preliminary Data Suggests February Imports at 10-Year Low
Written by Brett Linton
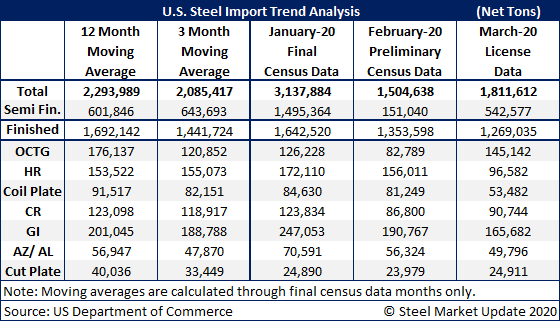
Preliminary steel import license data for February, released this week, slipped to the 1.5 million net ton range for total steel imports, according to the U.S. Department of Commerce. Steel Market Update’s last import update just one week ago had February imports at 1.9 million tons. This is the lowest monthly import level seen since December 2009 when final imports were at 1.4 million tons. Final February data usually varies only slightly from these preliminary figures, but the early effects of the coronavirus on the economy make this data unpredictable.
Other notable lows in February: OCTG imports have not been this low since September 2016, and cold rolled imports have not been this low since July 2013.
Finished steel imports in February are now at 1.4 million tons, down over January’s 1.6 million ton level and below the 2019 finished import average of 1.7 million tons. The latest February license data shows 150,000 tons of semi-finished product imports (mostly slabs).
March licenses collected through the 24th day of the month are up to 1.8 million tons, with 1.3 million tons being finished products and 540,000 tons being semi-finished.
Note: The total January import figure is unusually high as a result of buyers seeking to max out quarterly quota limits on semi-finished products. For the remainder of the first quarter, final semi-finished imports should be significantly lower. January semi-finished imports were 1.5 million tons, the highest level seen in SMU’s 10-year history. Due to these month-to-month swings, SMU has ceased monthly import “trending” projections and now only shows unadjusted figures as reported by the Commerce Department.
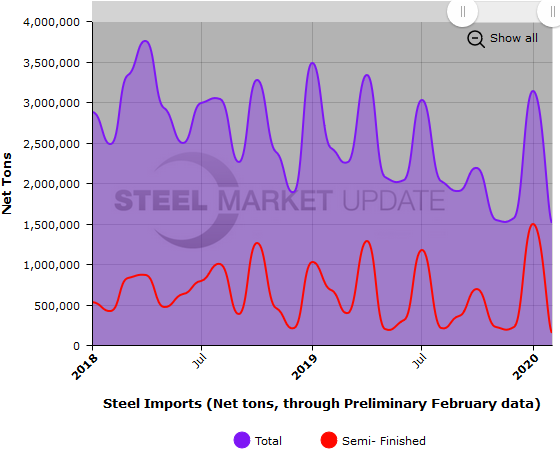
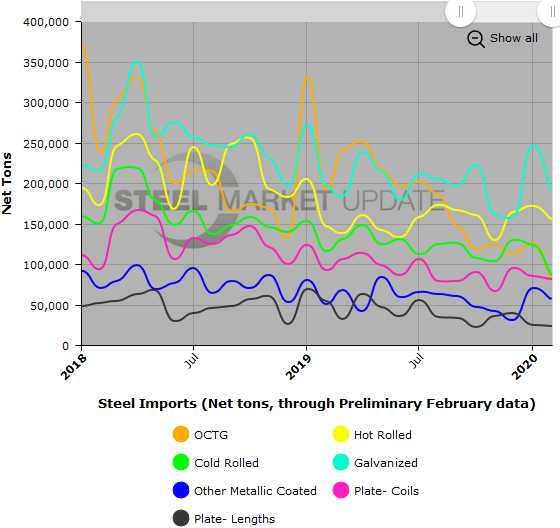
The two graphics below show total steel imports through preliminary February data. To provide the most clarity, we are only showing a two-year snapshot. To see a greater data history and utilize our interactive graphing features, you can visit our website. Contact us at info@SteelMarketUpdate.com if you have any questions.
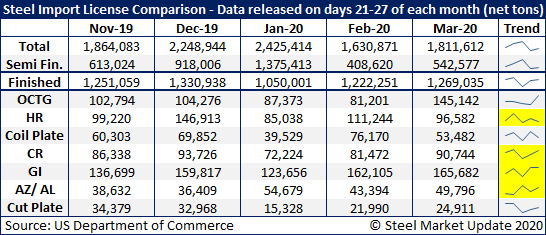
The table below compares import license data collected between the 21st and 27th days of each respective month; i.e. the Mar-20 column represents the March import licenses collected through March 24, the Feb-20 column shows license data collected in February through Feb. 26, etc. This is an attempt to compare monthly import licenses against similar time periods to see how imports for the latest month are progressing. This is a new look at licenses by SMU and is subject to revisions. We welcome any reader input on this topic.