

Prices

August 8, 2020
SIMA: Steel Import License Data for July
Written by Peter Wright
Steel Market Update is pleased to share this Premium content with Executive subscribers. For more information on how to upgrade to a Premium subscription, email Info@SteelMarketUpdate.com.
July was the ninth consecutive month where imports were down by more than 20 percent compared to the same month last year, according to the latest Commerce Department data. Year over year, total rolled product imports in July were down by 25.9 percent on a three-month moving average (3MMA) basis.
This early look at July’s import volume is based on Commerce Department license data (see explanation below.) This import analysis includes all major steel sectors: sheet, plate, longs and tubulars, with a total of 18 subsectors. All volumes in this analysis are reported in short tons. We use three-month moving averages rather than single-month results to smooth out monthly variability.
Imports of total carbon and low alloy rolled products in July were 1.164 million tons on a single month basis, down from 1.254 in June. From September last year to June this year the new normal has been a range of 1.24 to 1.56 million tons with July breaking through the bottom of this range. Year over year on a 3MMA basis, sheet products were down by 16.5 percent, plate products were down by 43.3 percent, long products were down by 21.0 percent and tubulars were down by 38.6 percent. Imports of flat rolled, tubulars and longs all had a recent peak in July 2018.
Figure 1 shows the tonnage of total rolled steel and semi-finished imports through July on a 3MMA basis. Due to quota opening and closing times there is a violent cyclicality within each quarter in the monthly volume of semifinished, which is masked by the 3MMA calculation. Imports of semifinished have recently ranged from a high of 1.5 million tons in January 2020 to a low of 69,000 tons in the preliminary volume for June 2020. The licensed volume of semis in July was 75,000 tons. Total rolled product volume has been on an erratically downward trend since mid-2017 (Figure 1).
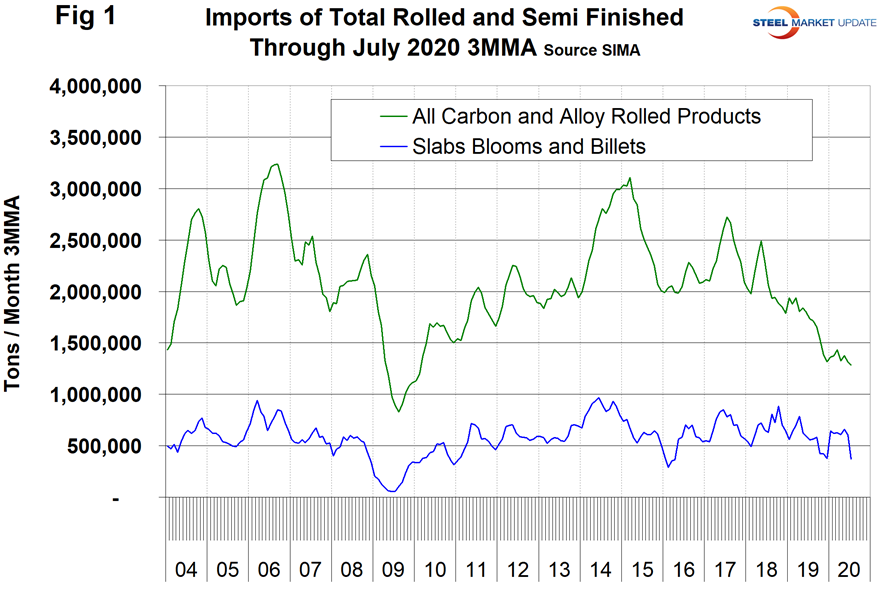
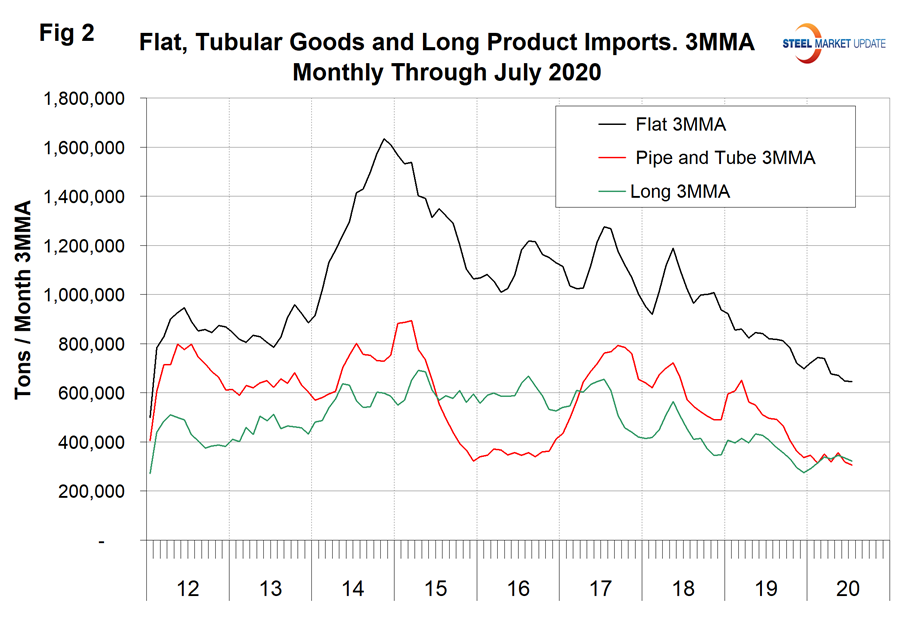
Figure 2 summarizes the import volume of flat rolled, tubular and long products since 2012 on a 3MMA basis. All three have been trending down since mid-2017.
There are three tables in this report. In each of them we show the 3MMA of the tonnage in July 2020 and July 2019 with the year-over-year change. We then calculate the percentage change in volume in the most recent three months with the previous three months. This month we are comparing May through July with February through April (3M/3M). The next column to the right shows the year-over-year change as a percentage. Declines are color coded green and increases are coded red. Finally, in the far-right column, we subtract the 12-month change from the three-month change. This is a way of describing the recent momentum as a percentage. It is not unusual for the color code of the momentum to be the opposite of the year-over-year time frame analyses, which it was in July.
Table 1 describes the imports of all major sectors of the sheet and plate markets. In the flat rolled sectors shown in Table 1, total sheet products were down by 16.5 percent and total plate products were down by 43.3 percent, both year over year. All individual products in the sheet and plate groups except tin plate were down year over year. The three major sheet products, HR, CR and HDG, were all down about the same, ranging from 19.3 percent for cold rolled to 22.7 percent for hot dipped galvanized. In the plate sector, cut to length was down by 45.7 percent and coiled down by 42.2 percent. Figures 3 and 4 show the history of sheet and plate product imports since January 2012.
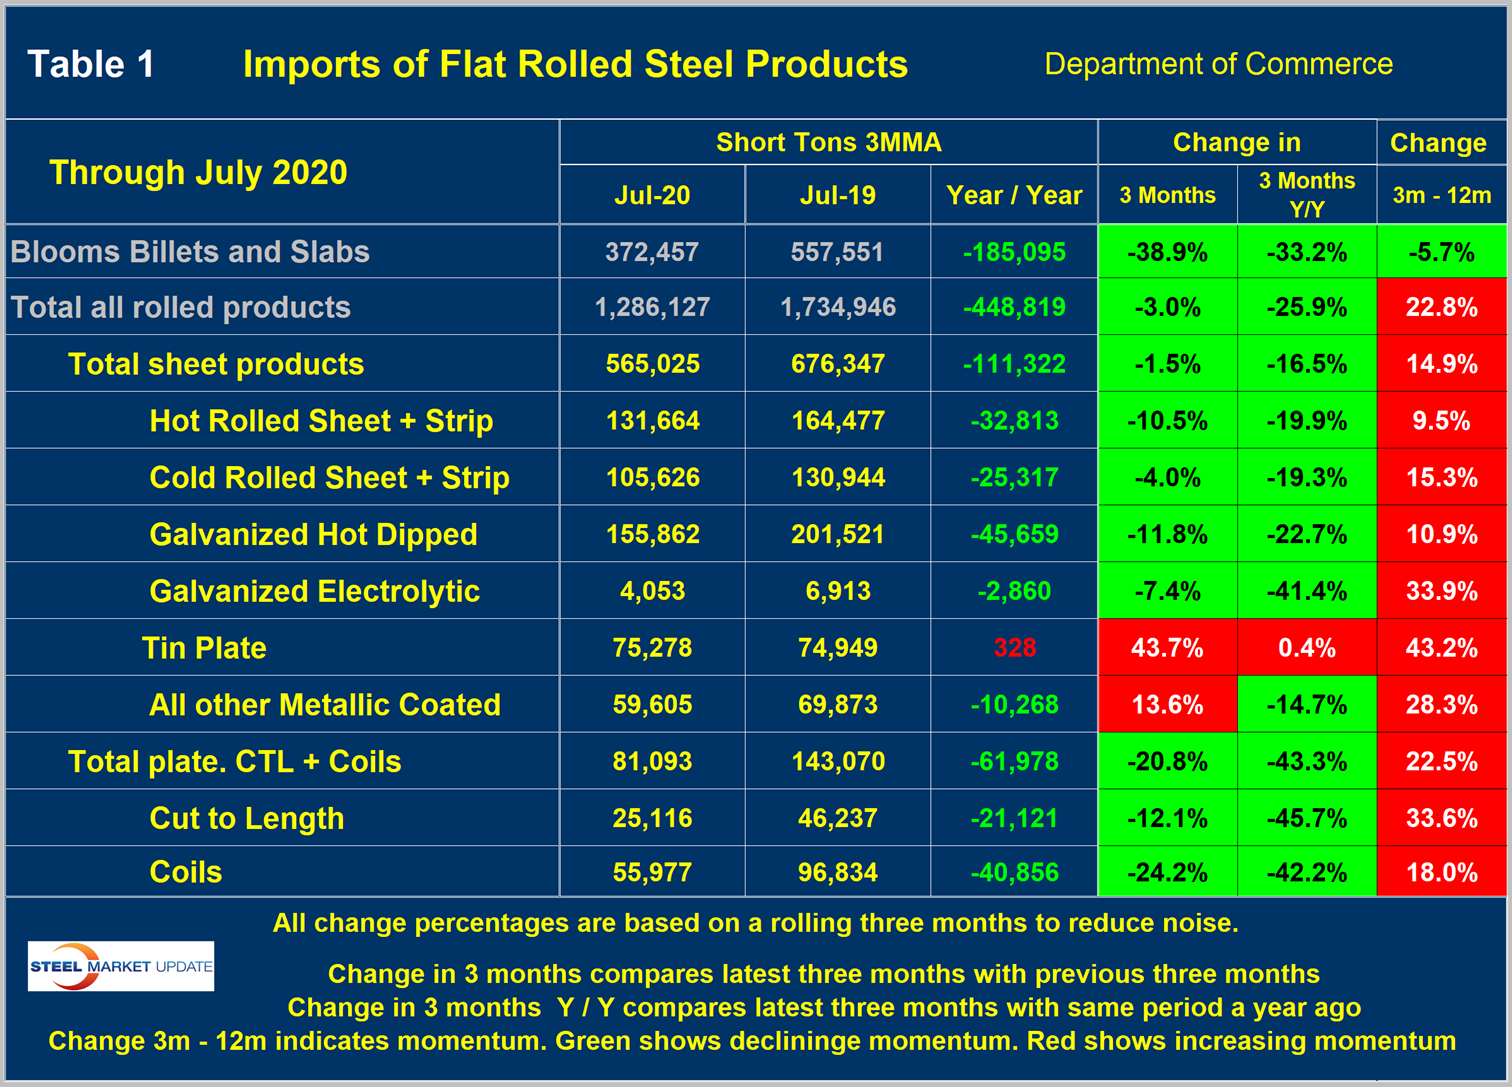
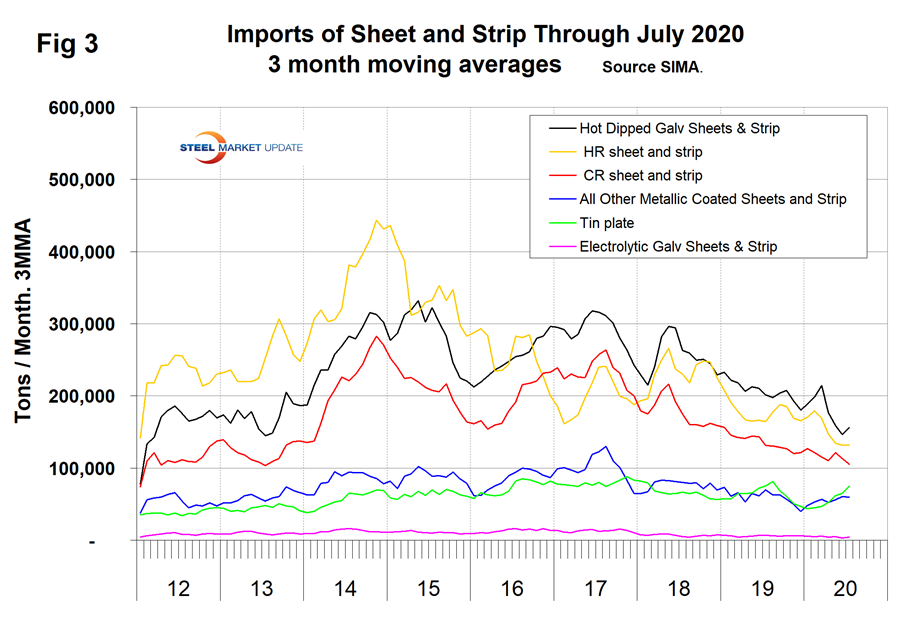
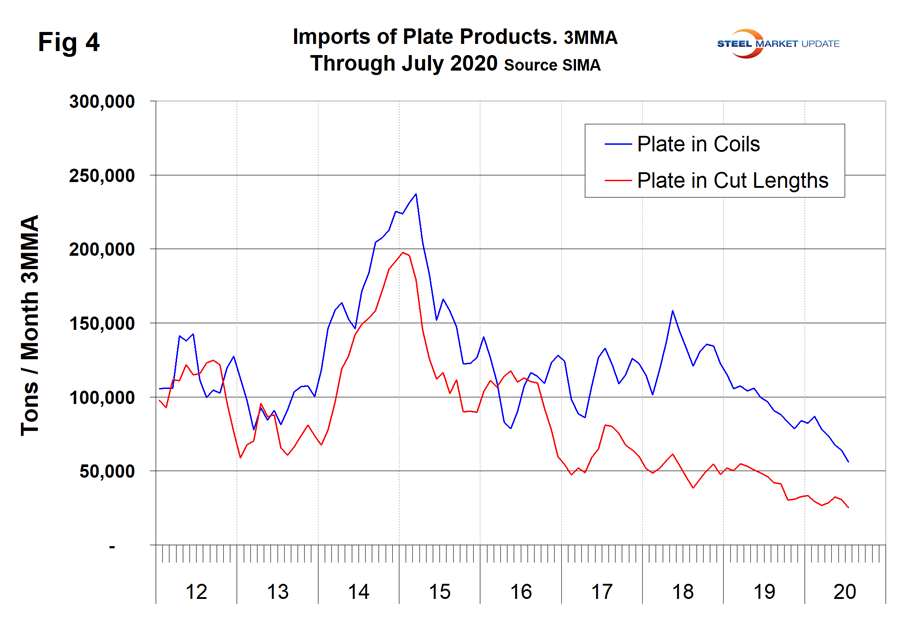
Table 2 shows the same analysis for long products where the year-over year volume was down by 21.0 percent in total. All individual products except light shapes were down year over year with heavy structurals down the most. Rebar was down the least as a result of continuing strength in construction expenditures. Figure 5 shows the history of long product imports.
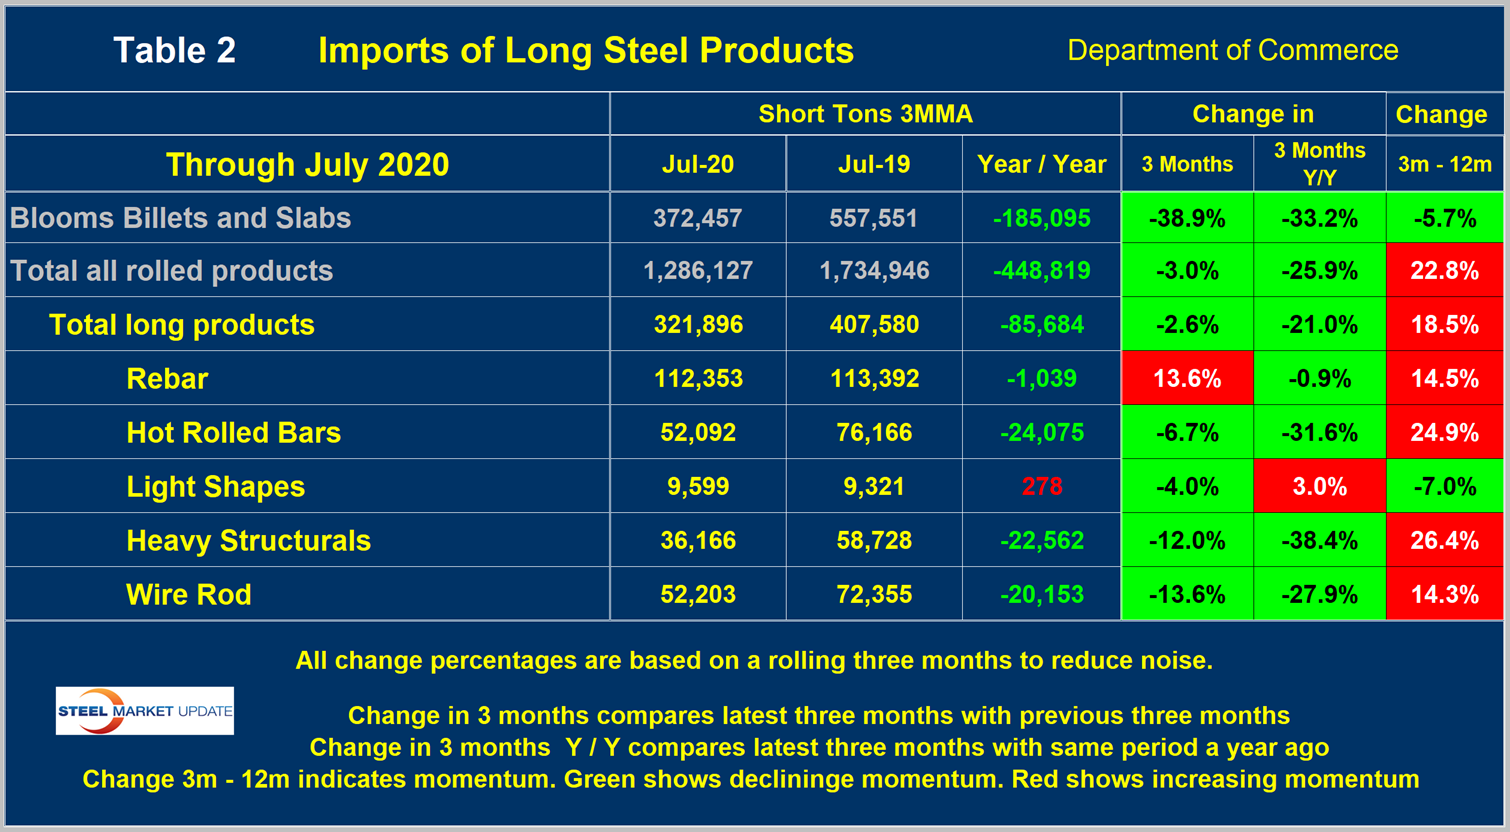
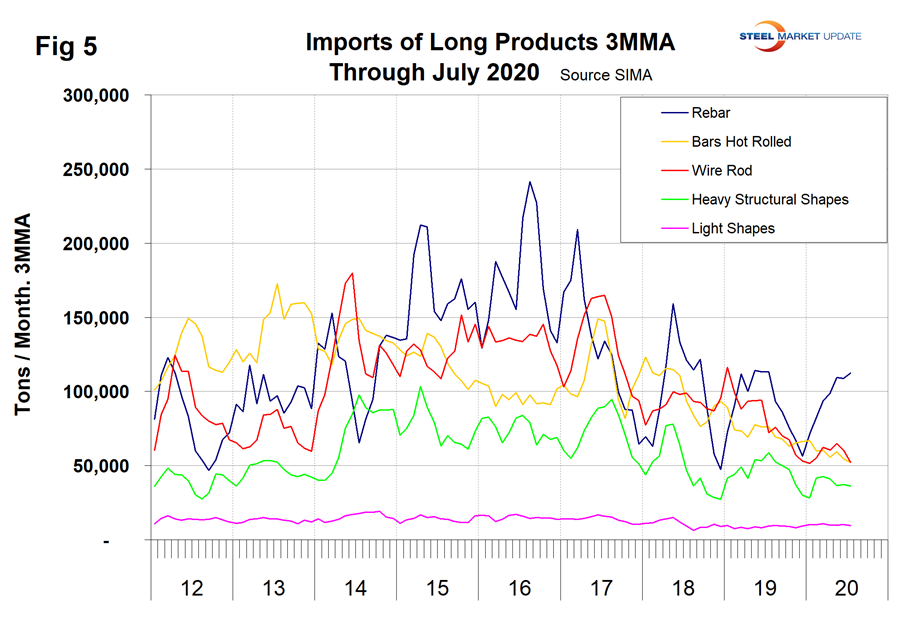
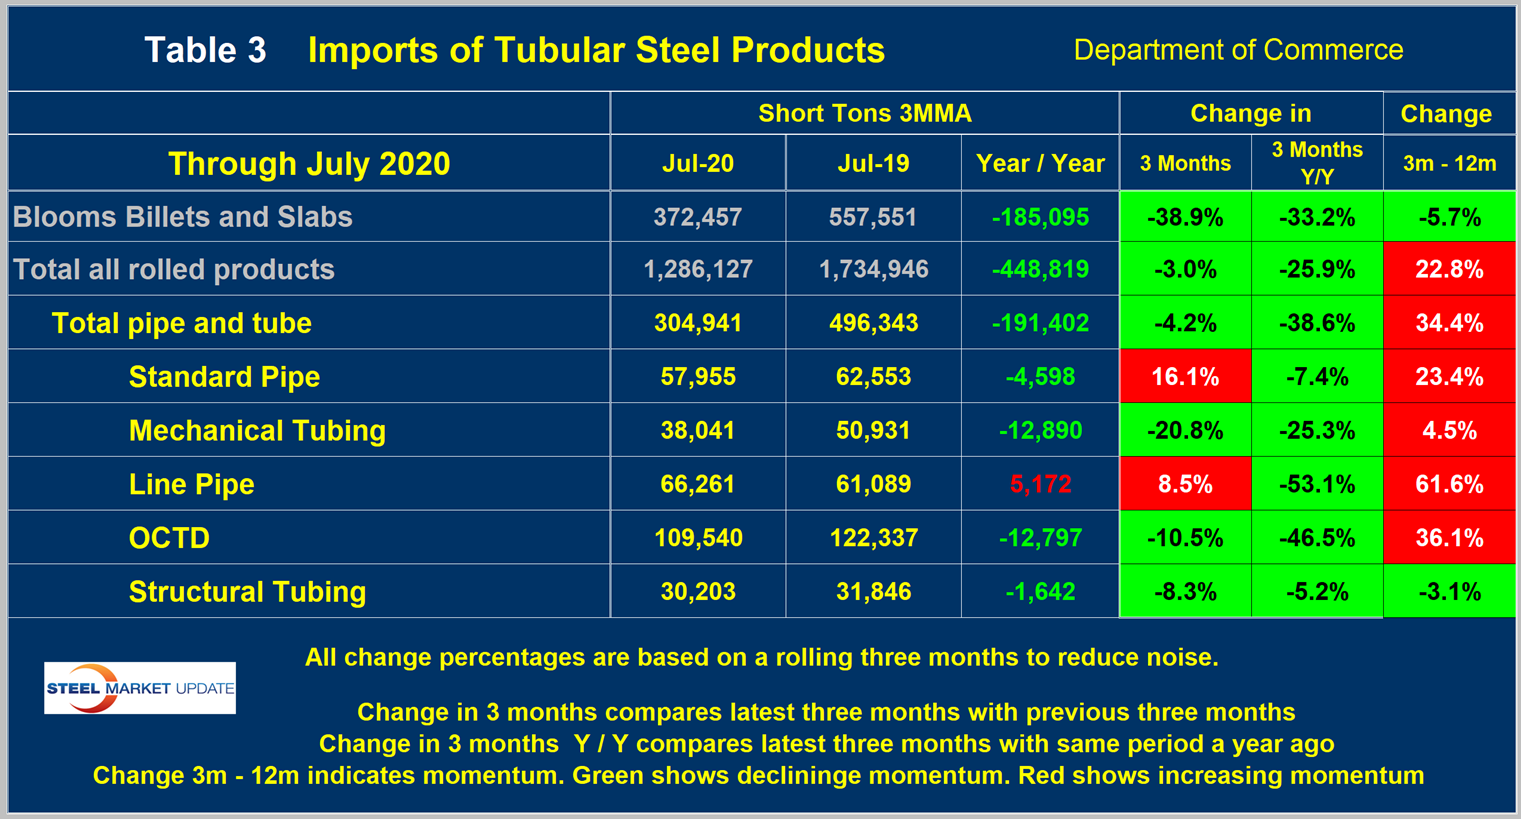
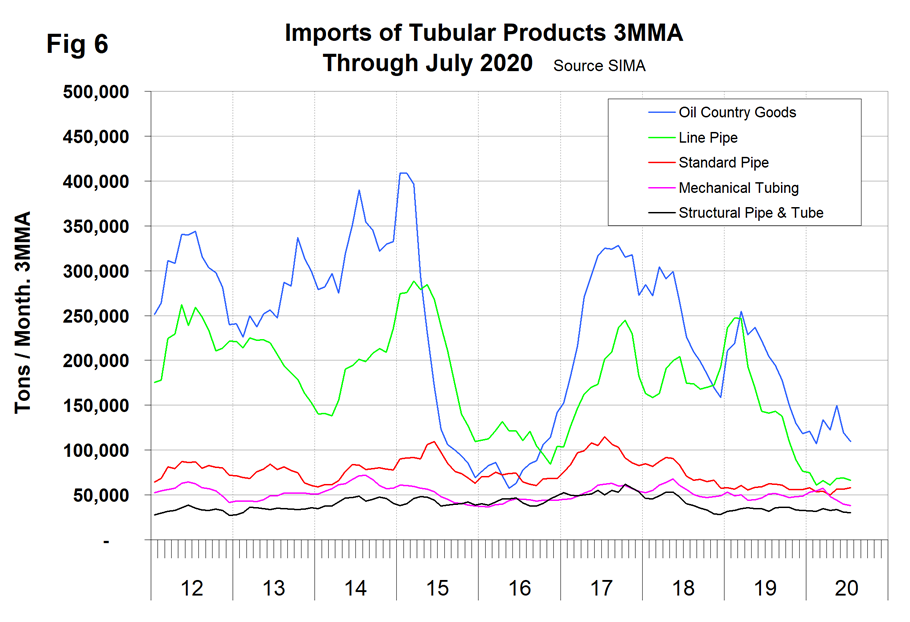
Table 3 shows that for tubular products in total the volume was down by 38.6 percent year-over-year with line pipe down the most at 53.1 percent followed by OCTG at 46.5 percent. Figure 6 shows the history of tubular imports since January 2012.
Explanation: SMU publishes several import reports ranging from this very early look using license data to the very detailed analysis of final volumes by product, by district of entry and by source nation, which is available in the Premium member section of our website. The early look is based on three-month moving averages using the latest license data, either the preliminary or final data for the previous month and final data for earlier months. We recognize that the license data is subject to revisions but believe that by combining it with earlier months in this way gives a reasonably accurate assessment of volume trends by product as early as possible. The main issue with the license data is that the month the tonnage arrives is not always the same month in which the license was recorded.
Statement from the Department of Commerce: The Steel Import Monitoring and Analysis (SIMA) system of the Department of Commerce collects and publishes data of steel mill product imports. By design, this information gives stakeholders valuable information on steel trade with the United States. This is achieved through two tools: the steel licensing program and the steel import monitor. All steel mill imports into the United States require a license issued by the SIMA office. The SIMA Licensing System is an online system for importers to register, apply for and receive licenses in a timely manner. In addition to managing the licensing system, SIMA publishes near-real-time aggregate data on steel mill imports into the United States. These data incorporate information collected from steel license applications and publicly released Census data. The data are displayed in tables and graphs for users to analyze. Additionally, SIMA provides data on U.S. steel mill exports, as well as imports and exports of select downstream steel products.


