

Prices

December 3, 2020
Ferrous Futures: Epic Rally in Steel and Scrap
Written by David Feldstein
Editor’s note: SMU Contributor David Feldstein is president of Rock Trading Advisors. David has over 20 years of trading experience in financial markets and has been active in the ferrous futures space for over eight years. You can learn more at www.thefeldstein.com or add him on twitter @TheFeldstein and on Instragram at #thefeldstein.
During the week of Nov. 16, the relentlessly bullish steel news cycle looked to be turning. Big River announced they successfully started up their second EAF mill and rumors that U.S. Steel’s restart of Gary Works #4 were under way. The spread between domestic and foreign offers had expanded past the $100 threshold. Relief to the extended lead times and lack of availability looked to finally be on the way.
There was a feeling that week, especially for those short physical steel and/or short CME HR futures, reminiscent of a scene from the movie “The Perfect Storm,” where the crew of the fishing boat the Andrea Gail found themselves basking in the relatively calm ocean waters and morning sunshine after battling an historic Nor’easter hurricane through the long night before. Unbeknownst to them, they were merely in the eye of the hurricane. A short while later, the crew of the Andrea Gail themselves plunged back into the storm with ninety-foot waves that eventually sent the ship and its crew to the bottom of the ocean.
Also during that week of Nov. 16, there was a breakout liquid steel spill at ArcelorMittal’s Dofasco resulting in the loss of their caster for weeks while their Burns Harbor facility saw production slow dramatically after a COVID outbreak infected a number of its staff. Just like in that movie, the brief calm was followed by a roaring storm sending spot hot rolled and HRC futures vertically higher by more than $100 in less than 10 days.
Rolling 2nd Month CME Hot Rolled Coil Future $/st
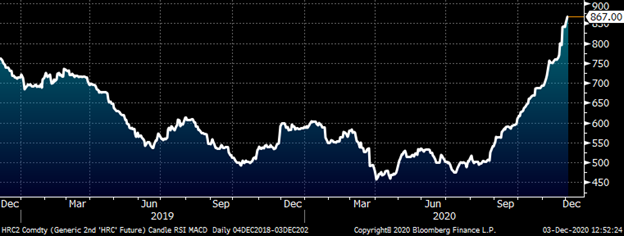
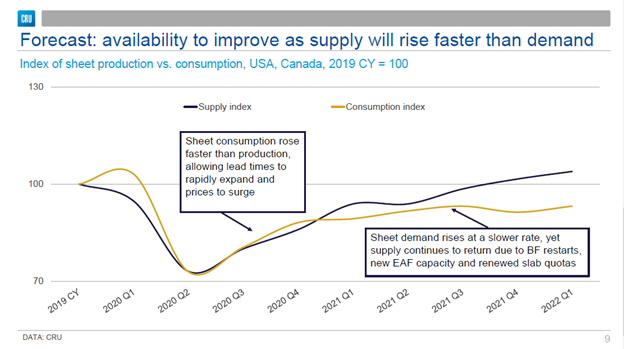
Josh Spoores of CRU, you all know him, provided some fantastic insights into how the market got here and what he is forecasting moving forward during the SMU Community Chat on Dec. 2. With his permission, here is one of his slides graphing supply vs. consumption I found to elegantly illustrate why the domestic steel market is experiencing a shortage.
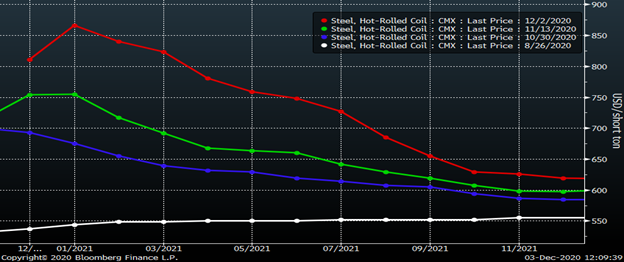
This chart shows the CME Midwest HRC futures curve at a number of points since the SMU Steel Summit on Aug. 26. The August CME HRC futures settled at $451, then gained $98 in September, $96 in October and another $70 in November. The December future is trading $815 and January 2021 is trading $865. If January settles at $865, it would account for a 92% gain in five months. Smoke ’em if you got ’em.
The big takeaway from this chart is how the curve has steepened its backwardation (downward sloping) during its epic run.
CME Midwest HRC Futures Curve $/st
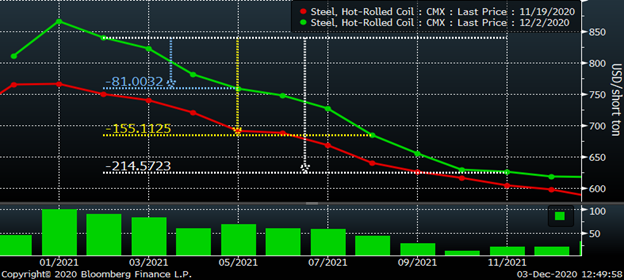
If you go back to Josh Spoores’ chart from above, notice he models that the shortage creating gap where consumption overtook supply closes and then supply moves back above consumption in early Q1. The gap created in Q1 looks to be much larger than the one that caused the shortage. Then in the second half of 2021, supply and demand diverge significantly. The futures curve’s pricing in of downside risk meshes well with the analysis from above.
Using Wednesday’s settlements, February (Q1) is $81 above May (Q2), $155 above August (Q3) and $215 above November (Q4). First, don’t think of the curve as a crystal ball, but rather an indicator of where the market not only believes prices will be, but also where they are willing to invest capital for whatever reason they have.
CME Midwest HRC Futures Curve $/st
This chart illustrates the metal margin, a rough gauge for EAF mills’ profit per ton at astronomical levels. January’s margin is almost $490 and the spread doesn’t fall back below $400 until August. Typically, the spread is around $280.
CME Midwest HRC (red) & Busheling (bl) Futures Curves $/st
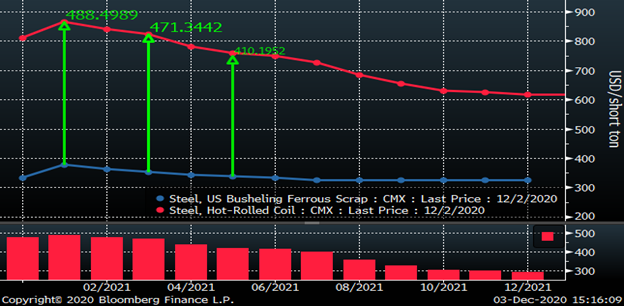
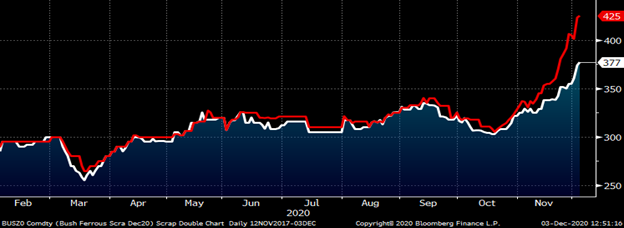
November busheling settled just below $300/lt in November, which was surprisingly weak considering where flat rolled prices ranged. However, CME busheling has since screamed higher with the December future trading above $370 today and January trading $425. Something had to give and finally busheling did, although recent gains in hot rolled exceeded the gains in busheling during that same time.
Rolling 1st (white) & 2nd Month (red) CME Busheling Future $/gt
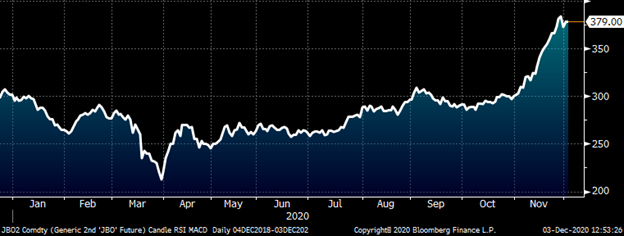
Moreover, there has been a global commodity risk-on rally in metal prices with Turkish scrap also exploding to the upside. This rally has slowed the potential impact from the import release valve. The January LME Turkish scrap future traded $379/MT today.
Rolling 2nd Month LME Turkish Scrap Future $/mt
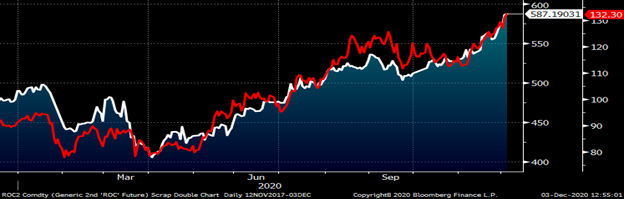
Iron ore and Chinese hot rolled futures are also in serious rally mode.
Rolling 2nd Month SGX Iron Ore Future $/mt & SHFE Chinese HRC Future $/st
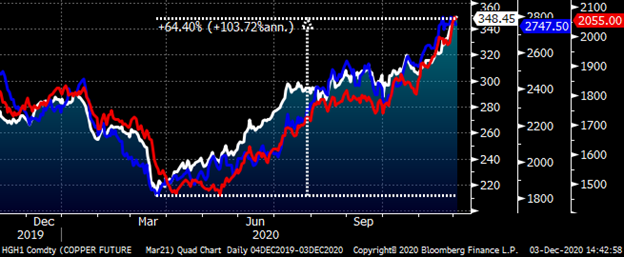
As well as copper, zinc and aluminum shown below. Since bottoming in March, copper has rallied 86%.
CME Jan. Copper Future (wh), LME 3-Month Aluminum(red) & Zinc (bl) Future
At the moment, there seems to be a global shortage or apparent shortage that has restricted to a degree some alternative international supply lines into the U.S. I spend a great deal of my time analyzing macroeconomics and, whether it is U.S. or China’s economics, I have struggled to find the data justifying where all of this demand is coming from. Similar to the stock markets, there seems to be a great deal of speculation underpinning the apparent demand and price action. There is a mania feel to it all. I am very curious to see if that is the case or if the economic data starts to surprise to the upside.
The implications and (buyers’) reactions to the past few month’s volatility and lack of availability in steel will be interesting to watch. How will the mills, distributors and OEMs manage the downside risk? Will the Section 232 tariffs be reversed? Are the international/import supply lines being revived and what does that look like when added to the supply curve from above? 2021, a fantastic voyage for steel.
Disclaimer: The content of this article is for informational purposes only. The views in this article do not represent financial services or advice. Any opinion expressed by Mr. Feldstein should not be treated as a specific inducement to make a particular investment or follow a particular strategy, but only as an expression of his opinion. Views and forecasts expressed are as of date indicated, are subject to change without notice, may not come to be and do not represent a recommendation or offer of any particular security, strategy or investment. Strategies mentioned may not be suitable for you. You must make an independent decision regarding investments or strategies mentioned in this article. It is recommended you consider your own particular circumstances and seek the advice from a financial professional before taking action in financial markets.


