Product
March 11, 2013
Construction Will Lead Steel Growth from Here
Written by Peter Wright
Written by: Peter Wright
Net job creation in January exceeded expectations with a headline value of 236,000. Built into this number is data that can validate, (or not) other statistics of interest to steel producers and processors. The big picture is 1,966,000 jobs have been created in the last 12 months and we are tracking to have a full recovery in employment by July next year.
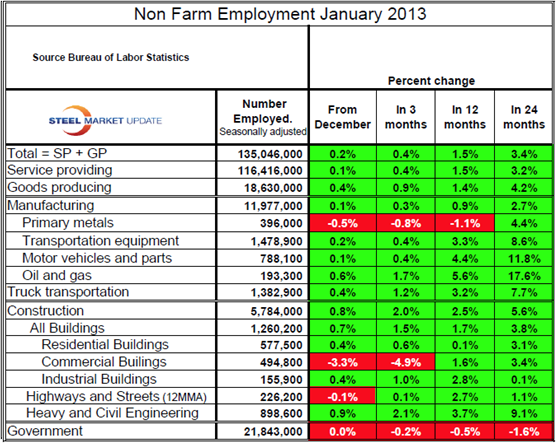
Manufacturing and construction employment jobs are found in the second tier of the employment statistics which makes the split: service providing and goods producing. Total goods producing employment is only 13.8 percent of nonfarm jobs, the balance being service industries. Within goods producing, are almost 12 million and 5.8 million jobs in manufacturing and construction respectively.
In the early stage of the recovery, manufacturing was the employment growth engine, now construction has taken over. In the last six months construction has added 154,000 jobs while manufacturing has lagged with only 34,000. Construction employment has grown by 2.5 percent in the last 12 months. If anything, the growth should be stronger as the Commerce Department report shows construction put in place has grown by 10.7 percent in the same time period.
Historically, construction trends have been stable for long periods. It, therefore, appears that from both statistical sources, construction is on a sustainable growth track which will benefit steel consumption for the foreseeable future. Individual construction sectors drive different steel products. The table below shows performance by sector.
Manufacturing employment growth has been slow though positive for the last 10 months; however, primary metals have had a small net loss for six of the last seven months. The post recession employment surge in transportation equipment and oil and gas production has clearly run its course. The growth in truck transportation employment is steady.
As an aside, it’s incredible to realize that government employment exceeds total goods producing. Happily government figures continue to show a small net loss.
SP = service providing
GP = goods providing
This is small piece of what will become part of our “premium product” once our new website is up and running (projected for July 1st or slightly earlier).